Online services experiencing rapid growth often encounter abrupt surges in traffic and may become targets of Distributed Denial of Service (DDoS) attacks orchestrated by malicious actors or inadvertently due to self-induced bugs. Mitigating these challenges to ensure high availability requires meticulous architectural practices, including implementing caching mechanisms, leveraging Content Delivery Networks (CDNs), Web Application Firewalls (WAFs), deploying queuing systems, employing load balancing strategies, implementing robust monitoring and alerting systems, and incorporating autoscaling capabilities. However, in this context, we will focus specifically on techniques related to load shedding and throttling to manage various traffic shapes effectively.
1. Traffic Patterns and Shapes
Traffic patterns refer to the manner in which user requests or tasks interact with your online service throughout a given period. These requests or tasks can vary in characteristics, including the rate of requests (TPS), concurrency, and the patterns of request flow, such as bursts of traffic. These patterns must be analyzed for scaling your service effectively and providing high availability.
Here’s a breakdown of some common traffic shapes:
Normal Traffic: defines baseline level of traffic pattern that a service receives most of the time based on regular user activity.
Peak Traffic: defines recurring period of high traffic based on daily or weekly user activity patterns. Auto-scaling rules can be set up to automatically allocate pre-provisioned additional resources in response to anticipated peaks in traffic.
Off-Peak Traffic: refers to periods of low or minimal traffic, such as during late-night hours or weekends. Auto-scaling rules can be set to scale down or consolidating resources during periods of low demand help minimize operational costs while maintaining adequate performance levels.
Burst Traffic: defines sudden, short-lived spikes in traffic that might be caused by viral contents or promotional campaigns. Auto-scaling rules can be configured to allocate extra resources in reaction to burst traffic. However, scaling resources might not happen swiftly enough to match the duration of the burst traffic. Therefore, it’s typically recommended to maintain surplus capacity to effectively handle burst traffic situations.
Seasonal Traffic: defines traffic patterns based on specific seasons, holidays or events such as Black Friday or back-to-school periods. This requires strategies similar to peak traffic for allocating pre-provisioned additional resources.
Steady Growth: defines gradual and consistent increase in traffic over time based on organic growth or marketing campaigns. This requires proactive monitoring to ensure resources keep pace with demand.
Classifying Requests
Incoming requests or tasks can be identified and categorized based on various contextual factors, such as the identity of the requester, the specific operation being requested, or other relevant parameters. This classification enables the implementation of appropriate measures, such as throttling or load shedding policies, to manage the flow of requests effectively.
Additional Considerations:
Traffic Patterns Can Combine: Real-world traffic patterns are often a combination of these shapes, requiring flexible and adaptable scaling strategies.
Monitoring and Alerting: Continuously monitor traffic patterns to identify trends early and proactively adjust your scaling strategy. Set up alerts and notifications to inform about sudden traffic surges or potential DDoS attacks so you can take timely action.
Incident Response Plan: Develop a well-defined incident response plan that outlines the steps for communication protocols, mitigation strategies, engaging stakeholders, and recovery procedures.
Cost-Effectiveness: Balance scaling needs with cost optimization to avoid over-provisioning resources during low traffic periods.
2. Throttling and Rate Limiting
Throttling controls the rate of traffic flow or resource consumption within a system to prevent overload or degradation of service. Throttling enforces quota limits and protects system overload by limiting the amount of resources (CPU, memory, network bandwidth) a single user or client can consume within a specific time frame. Throttling ensures efficient resource utilization, allowing the service to handle more users in a predictable manner. This ensures better fairness and stability while preventing a noisy neighbor problem where unpredictable spikes or slowdowns caused by heavy users. Throttling can be implemented by API Rate Limiting on the number of API requests a client can make with a given time window; by limiting maximum bandwidth allowed for various network traffic; by limiting rate of read/write; or by limiting the number of concurrent connections for a server to prevent overload.
These throttling and rate limiting measures can be applied to both anonymous and authenticated requests as follows:
Anonymous Requests:
Rate limiting: Implement rate limiting based on client IP addresses or other identifiers within a specific time window, preventing clients from overwhelming the system.
Concurrency limits: Set limits on the maximum number of concurrent connections or requests that can be processed simultaneously.
Server-side throttling: Apply throttling mechanisms at the server level, such as queue-based rate limiting or token bucket algorithms, to control the overall throughput of incoming requests.
Authenticated Requests:
User-based rate limiting: Implement rate limiting based on user identities or API keys, ensuring that authenticated users cannot exceed specified request limits.
Prioritized throttling: Apply different throttling rules or limits based on user roles, subscription tiers, or other criteria, allowing higher priority requests to be processed first during peak loads.
Circuit breakers: Implement circuit breakers to temporarily disable or throttle load from specific services or components that are experiencing high latency or failures, preventing cascading failures.
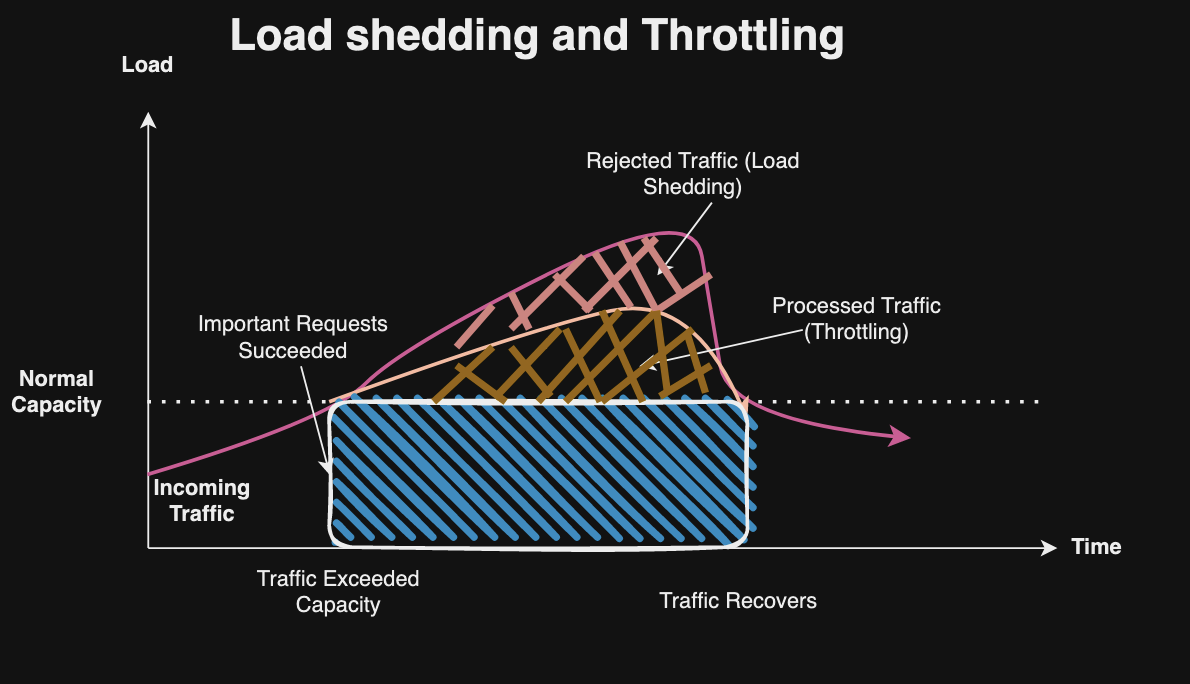
Load shedding is used to prioritize and manage system resources during periods of high demand or overload. It may discard or defer non-critical tasks or requests to ensure the continued operation of essential functions. Load shedding helps maintain system stability and prevents cascading failures by reallocating resources to handle the most critical tasks first. Common causes of unexpected events that require shedding to prevent overloading system resources include:
Traffic Spikes: sudden and significant increases in the volume of incoming traffic due to various reasons, such as viral content, marketing campaigns, sudden popularity, or events.
DDoS (Distributed Denial of Service): deliberate attempts to disrupt the normal functioning of a targeted server, service, or network by overwhelming it with a flood of traffic. A DDoS attack can be orchestrated by an attacker who commands a vast botnet comprising thousands of compromised devices, including computers, IoT devices, or servers. Additionally, misconfigurations, software bugs, or unforeseen interactions among system components such as excessive retries without exponential delays that can also lead to accidental DDoS attacks.
Here is how excessive load for anonymous and authenticated requests can be shed:
Anonymous Requests: Drop requests during extreme load conditions or when server capacity is reached, drop a percentage of incoming requests to protect the system from overload. This can be done randomly or based on specific criteria such as request types, and headers. Alternatively, service can degrade non-critical features or functionalities temporarily to reduce the overall system load and prioritize essential services.
Authenticated Requests: Apply load shedding rules based on user roles, subscription tiers, or other criteria, prioritizing requests from high-value users or critical services.
3.1 Error Response
When a request exceeds the rate limit, the server typically returns a 503 HTTP status code indicating that the request has been throttled or rate-limited due to Too Many Requests. The server may also return HTTP headers such as Retry-After, other headers specifically employed for throttling are less prevalent in the context of load shedding. Unlike throttling errors, which fall under user-errors with 4XX error codes, load shedding is categorized as a server error with 5XX error codes. Consequently, load shedding requires more aggressive monitoring and alerting compared to throttling errors. Throttling errors, on the other hand, can be considered expected behavior as a means to address noisy neighbor problems and maintain high availability.
4. Additional Techniques for Throttling and Load Shedding
Throttling, rate-limiting and load shedding measures described above can be used to handle high traffic and to prevent resource exhaustion in distributed systems. Here are common techniques that can be used to implement these measures:
Admission Control: Set up thresholds for maximum concurrent requests or resource utilization.
Request Classification and Prioritization: Classify requests based on priority, user type, or criticality and then dropping low-priority requests when the thresholds for capacity are exceeded.
Backpressure and Queue Management: Use a fixed-length queues to buffer incoming requests during high loads and applying back-pressure by rejecting requests when queues reach their limits.
Fault Isolation and Containment: Partition the system into isolated components or cells to limit the blast radius of failures.
Redundancy and Failover: Build redundancy into your infrastructure and implement failover mechanisms to ensure that your services remain available even if parts of your infrastructure are overwhelmed.
Simplicity and Modularity: Design systems with simple, modular components that can be easily understood, maintained, and replaced. Avoid complex dependencies and tight coupling between components.
Circuit Breaker: Monitor the health and performance of downstream services or components and stop forwarding requests if a service is overloaded or unresponsive. Periodically attempt to re-establish the connection (close the circuit breaker).
Noisy Neighbors: Throttle and apply rate limits to customer traffic to prevent them from consuming resources excessively, thereby ensuring fair access for all customers.
Capacity Planning and Scaling: Continuously monitor resource utilization and plan for capacity growth. Implement auto-scaling mechanisms to dynamically adjust resources based on demand.
Communication Optimization: Employ communication optimization techniques like compression, quantization to minimize network traffic and bandwidth requirements.
Privacy and Security Considerations: Incorporate privacy-preserving mechanisms like secure aggregation, differential privacy, and secure multi-party computation to ensure data privacy and model confidentiality.
Graceful Degradation: Identify and disable non-critical features or functionality during high loads.
Monitoring and Alerting: Monitor system metrics (CPU, memory, request rates, latency, etc.) to detect overload scenarios and sending alerts when thresholds are exceeded.
Defense in Depth: Implement multi-layered defense strategy to detect, mitigate, and protect customer workloads from malicious attacks, like blacklisting IP addresses or employing Geo-location filters, at the Edge Layer using CDN, Load Balancer, or API Gateway. Constrain network bandwidth and requests per second (RPS) for individual tenants at the Network Layer. Applying resource quota, prioritization and admission control at the Application Layer based on account information, request attributes and system metrics. Isolating tenants’ data in separate partitions at the Storage Layer. Each dependent service may use similar multi-layered defense to throttle based on the usage patterns and resource constraints.
Adaptive Scaling: Automatically scale resources up or down based on demand and multi-tenant fairness policies. Employ predictive auto-scaling or load-based scaling.
Fault Tolerance and Checkpointing: Incorporate fault tolerance mechanisms, redundant computation and checkpointing to ensure reliable and resilient task processing in the face of potential resource failures. The fault tolerance mechanisms can be used to handle potential failures or stragglers (slow or unresponsive devices).
Web Application Firewall (WAF): Inspects incoming traffic and blocks malicious requests, including DDoS attacks, based on predefined rules and patterns.
Load Balancing: By distributing incoming traffic across multiple servers or instances, load balancing helps prevent any single server from becoming overwhelmed.
Content Delivery Network (CDN): Distribute your content across multiple geographic locations, reducing the strain on your origin servers.
Cost-Aware Scaling: Implements a cost-aware scaling strategy like like cost modeling and performance prediction that considers the cost of different resource types.
Security Mechanisms: Incorporate various security mechanisms such as secure communication channels, code integrity verification, and runtime security monitoring to protect against potential vulnerabilities and attacks in multi-tenant environments.
SOPs and Run books: Develop well-defined procedures that outlines the steps for detecting traffic spikes, pinpointing source of malicious attack, analyzing the logs and monitoring metrics, mitigation strategies, engaging stakeholders, and recovery procedures.
5. Pitfalls with Use of Throttling and Load Shedding
Here are some potential challenges to consider when implementing throttling and load shedding:
Autoscaling Failures: If your throttling policies are too aggressive, they may prevent your application from generating enough load to trigger autoscaling policies. This can lead to under-provisioning of resources and performance degradation. Conversely, if your throttling policies are too lenient, your application may scale up unnecessarily, leading to overspending.
Load Balancer Health Checks: Some load balancers use synthetic health checks to determine the health of backend instances. If your throttling policies block these health checks, it can cause instances to be marked as unhealthy and removed from the load balancer, even though they are still capable of serving traffic.
Unhealthy Instance Overload: When instances are marked as unhealthy by a load balancer, the remaining healthy instances may become overloaded if throttling policies are not properly configured. This can lead to a cascading failure scenario where more and more instances are marked as unhealthy due to the increased load.
Sticky Sessions: If your application uses sticky sessions (session affinity) for user sessions, and your throttling policies are not consistently applied across all instances, it can lead to inconsistent user experiences or session loss.
Cache Invalidation: Aggressive throttling or load shedding policies can lead to more frequent cache invalidations, which can impact performance and increase the load on your backend systems.
Upstream Service Overload: If your application relies on upstream services or APIs, and your throttling policies are not properly coordinated with those services, you may end up overloading those systems and causing cascading failures.
Insufficient capacity of the Failover: The failover servers must possess adequate capacity to manage the entire expected traffic load from the primary servers.
Monitoring Challenges: Throttling and load shedding policies can make it more difficult to monitor and troubleshoot performance issues, as the metrics you’re observing may be skewed by the throttling mechanisms.
Delays in Updating Throttling Policies: The policy adjustments for throttling and load shedding should be capable of updating at runtime swiftly to adapt to various traffic patterns..
Balancing Load based on number of connections: When directing incoming traffic based on the host with the least number of connections, there’s a risk of unhealthy hosts will have fewer connections due to their quick error responses. Consequently, the load balancer may direct more traffic towards these hosts, resulting in a majority of requests failing. To counteract this, it’s essential to employ robust Layer 7 health checks that comprehensively assess the application’s functionality and dependencies. Layer 4 health checks, which are susceptible to false positives, should be avoided. The unhealthy host should be removed from the available pool as quickly as possible. Additionally, ensuring that error responses from the service have similar latency to successful responses can serve as another effective mitigation strategy.
To mitigate these issues, it’s essential to carefully coordinate your throttling and load shedding policies with the autoscaling, load balancing, caching, and monitoring strategies. This may involve tuning thresholds, implementing consistent policies across all components, and closely monitoring the interaction between these systems. Additionally, it’s crucial to thoroughly test your configurations under various load conditions to identify and address potential issues before they impact your production environment.
6. Monitoring Metrics and Notifications
Here are some common metrics and alarms to consider for throttling and load shedding:
6.1 Network Traffic Metrics:
Incoming/Outgoing Bandwidth: Monitor the total network bandwidth to detect abnormal traffic patterns.
Packets per Second (PPS): Track the number of packets processed per second to identify potential DDoS attacks or traffic bursts.
Connections per Second: Monitor the rate of new connections being established to detect potential connection exhaustion or DDoS attacks.
6.2 Application Metrics:
Request Rate: Track the number of requests per second to identify traffic spikes or bursts.
Error Rate: Monitor the rate of errors or failed requests, which can indicate overloading or application issues.
Response Time: Measure the application’s response time to detect performance degradation or latency issues.
Queue Saturation: Monitor the lengths of queues or buffers to identify potential bottlenecks or resource exhaustion.
6.3 System Metrics:
CPU Utilization: Monitor CPU usage to detect resource contention or overloading.
Memory Utilization: Track memory usage to identify potential memory leaks or resource exhaustion.
Disk I/O: Monitor disk read/write operations to detect storage bottlenecks or performance issues.
6.4 Load Balancer Metrics:
Active Connections: Monitor the number of active connections to the load balancer to identify potential connection exhaustion.
Unhealthy Hosts: Track the number of unhealthy or unresponsive hosts to ensure load balancing efficiency.
Request/Response Errors: Monitor errors related to requests or responses to identify issues with backend services.
6.5 Alarms and Notifications:
Set up alarms for critical metrics, such as high CPU utilization, memory exhaustion or excessive error rates. For example, send alarms when error rate > 5% or response code of 5XX for consecutive 5 seconds or data points.
Set up alarms for high latency, e.g., P90 latency exceeds 50ms for more than 30 seconds.
Establish fine-grained alarms for detecting breaches in customer service level agreements (SLAs). Configure the alarm thresholds to trigger below the customer SLAs and ensure they can identify the affected customers.
6.6 Autoscaling Policies:
CPU Utilization-based Scaling: Scale out or in based on CPU usage thresholds to handle traffic bursts or DDoS attacks.
Memory Utilization-based Scaling: Scale resources based on memory usage to prevent memory exhaustion.
Network Traffic-based Scaling: Scale resources based on incoming or outgoing network traffic patterns to handle traffic spikes.
Request Rate-based Scaling: Scale resources based on the rate of incoming requests to maintain optimal performance.
6.7 Throttling / Load Shedding Overhead:
Monitor the processing time for throttling and load shedding, accounting for any communication overhead if the target host is unhealthy. Keep track of the time to ascertain priority, identify delays in processing, and ensure that high delays only impact denied requests.
Monitor the system’s utilization and identify when it reaches its capacity.
Monitor the observed target throughput at the time of the request.
Monitor the time taken to determine if load shedding is necessary and track when the percentage of denied traffic exceeds X% of incoming traffic.
It’s essential to tailor these metrics and alarms to your specific application, infrastructure, and traffic patterns.
7. Summary
Throttling and Load Shedding offer effective means for managing traffic for online services to maintain high availability. Traffic patterns may vary in characteristics like rate of requests, concurrency, and flow patterns. Understanding these shapes, including normal, peak, off-peak, burst, and seasonal traffic, is crucial for scaling and ensuring high availability. Requests can be classified based on contextual factors, enabling appropriate measures such as throttling or load shedding.
Throttling manages traffic flow or resource usage to avoid overload, whereas load shedding prioritizes tasks during periods of high demand. These methods can complement other strategies such as admission control, request classification, backpressure management, and redundancy. However, their implementation requires careful monitoring, notification, and thorough testing to ensure effectiveness.
The architecture of Formicary, a distributed orchestration engine will be described, which is intended for the execution of background tasks, jobs, and workflows. The operation is based on a directed acyclic graph of tasks, where each task is seen as a unit of work. Execution of these tasks can be achieved through a variety of protocols, including Docker, Kubernetes, Shell, HTTP, and Messaging. The Leader-Follower model (comprising a queen-leader and ant-workers) is employed by Formicary. Tasks are scheduled by the queen-leader, and their execution is carried out by the ant-workers. The Pipes and Filter and SEDA patterns are supported, permitting the output from one task to serve as the input for another. Parallel execution and result aggregation of tasks are made possible by the Fork/Join pattern. Distribution of tasks is guided by tags, labels, and executor protocols. The following is a list of its significant features:
Declarative Task/Job Definitions: Tasks and Jobs are defined as DAGs using simple YAML configuration files, with support for GO-based templates for customization.
Authentication & Authorization: The access to Formicary is secured using OAuth and OIDC standards.
Persistence of Artifacts: Artifacts and outputs from tasks can be stored and used by subsequent tasks or as job inputs.
Extensible Execution Methods: Supports a variety of execution protocols, including Docker, Kubernetes, HTTP, and custom protocols.
Quota: Limit maximum allowed CPU, memory, and disk quota usage for each task.
Caching: Supports caching for dependencies such as npm, maven, gradle, and python.
Encryption: Secures confidential configurations in databases and during network communication.
Scheduling: Cron-based scheduling for periodic job execution.
Optional and Finalized Tasks: Supports optional tasks that may fail and finalized tasks that run regardless of job success or failure.
Child Jobs: Supports spawning of child jobs based on Fork/Join patterns.
Retry Mechanisms: Supports retrying of tasks or jobs based on error/exit codes.
Job Filtering and Priority: Allows job/task execution filtering and prioritization.
Job prioritization, job/task retries, and cancellation.
Resource based Routing: Supports constraint-based routing of workloads for computing resources based on tags, labels, execution protocols, etc.
Monitoring, Alarms and Notifications: Offers job execution reports, real-time log streaming, and email notifications.
Other: Graceful and abrupt shutdown capabilities. Reporting and statistics on job outcomes and resource usage.
2. Use-Cases
The Formicary is designed for efficient and flexible job and task execution, adaptable to various complex scenarios, and capable of scaling according to the user base and task demands. Following is a list of its major use cases:
Complex Workflow Orchestration: Formicary is specially designed to run a series of integration tests, code analysis, and deployment tasks that depend on various conditions and outputs of previous tasks. Formicary can orchestrate this complex workflow across multiple environments, such as staging and production, with tasks running in parallel or sequence based on conditions.
Image Processing Pipeline: Formicary supports artifacts management for uploading images to S3 compatible storage including Minio. It allows orchestrating a series of tasks for image resizing, watermarking, and metadata extraction, with the final output stored in an object store.
Automate Build, Test and Release Workflows: A DevOps team can use Formicary to trigger a workflow that builds the project, runs tests, creates a Release, uploads build artifacts to the release, and publishes the package to a registry like npm or PyPI.
Scheduled Data ETL Job: A data engineering team can use Formicary to manage scheduled ETL jobs that extract data from multiple sources, transform it, and load it into a data warehouse, with tasks to validate and clean the data at each step.
Machine Learning Pipeline: A data science team can use Formicary pipeline to preprocess datasets, train machine learning models, evaluate their performance, and, based on certain metrics, decide whether to retrain the models or adjust preprocessing steps.
3. Architecture
The Formicary architecture is a complex system designed for task orchestration and execution, based on the Leader-Follower, SEDA and Fork/Join patterns.
3.1 Design Patterns
Here are some common design patterns used in the Formicary architecture:
Microservices Architecture: Formicary architecture is decomposed into smaller, independent services that enhances scalability and facilitates independent deployment and updates.
Pipeline Pattern: It structures the processing of tasks in a linear sequence of processing steps (stages).
Distributed Task Queues: It manages task distribution among multiple worker nodes. This ensures load balancing and effective utilization of resources.
Event-Driven Architecture: Formicary components communicate with events, triggering actions based on event occurrence for handling asynchronous processes and integrating various services.
Load Balancer Pattern: It distributes incoming requests or tasks evenly across a pool of servers and prevents any single server from becoming a bottleneck.
Circuit Breaker Pattern: It prevents a system from repeatedly trying to execute an operation that’s likely to fail.
Retry Pattern: It automatically re-attempts failed operations a certain number of times before considering the operation failed.
Observer Pattern: Formicary uses observer pattern for monitoring, logging, and metrics collection.
Scheduler-Agent-Supervisor Pattern: The Formicary schedulers trigger tasks, agents to execute them, and supervisors to monitor task execution.
Immutable Infrastructure: It treats infrastructure entities as immutable, replacing them for each deployment instead of updating them.
Fork-Join Pattern: It decomposes a task into sub-tasks, processes them in parallel, and then combines the results.
Caching Pattern: It stores intermediate build artifacts such as npm/maven/gradle libraries in a readily accessible location to reduce latency and improves performance.
Back-Pressure Pattern: It controls the rate of task generation or data flow to prevent overwhelming the system.
Idempotent Operations: It ensures that an operation produces the same result even if it’s executed multiple times.
External Configuration Store Pattern: It manages job configuration and settings in a separate, external location, enabling easier changes and consistency across services.
Blue-Green Deployment Pattern: It manages deployment by switching between two identical environments, one running the current version (blue) and one running the new version (green).
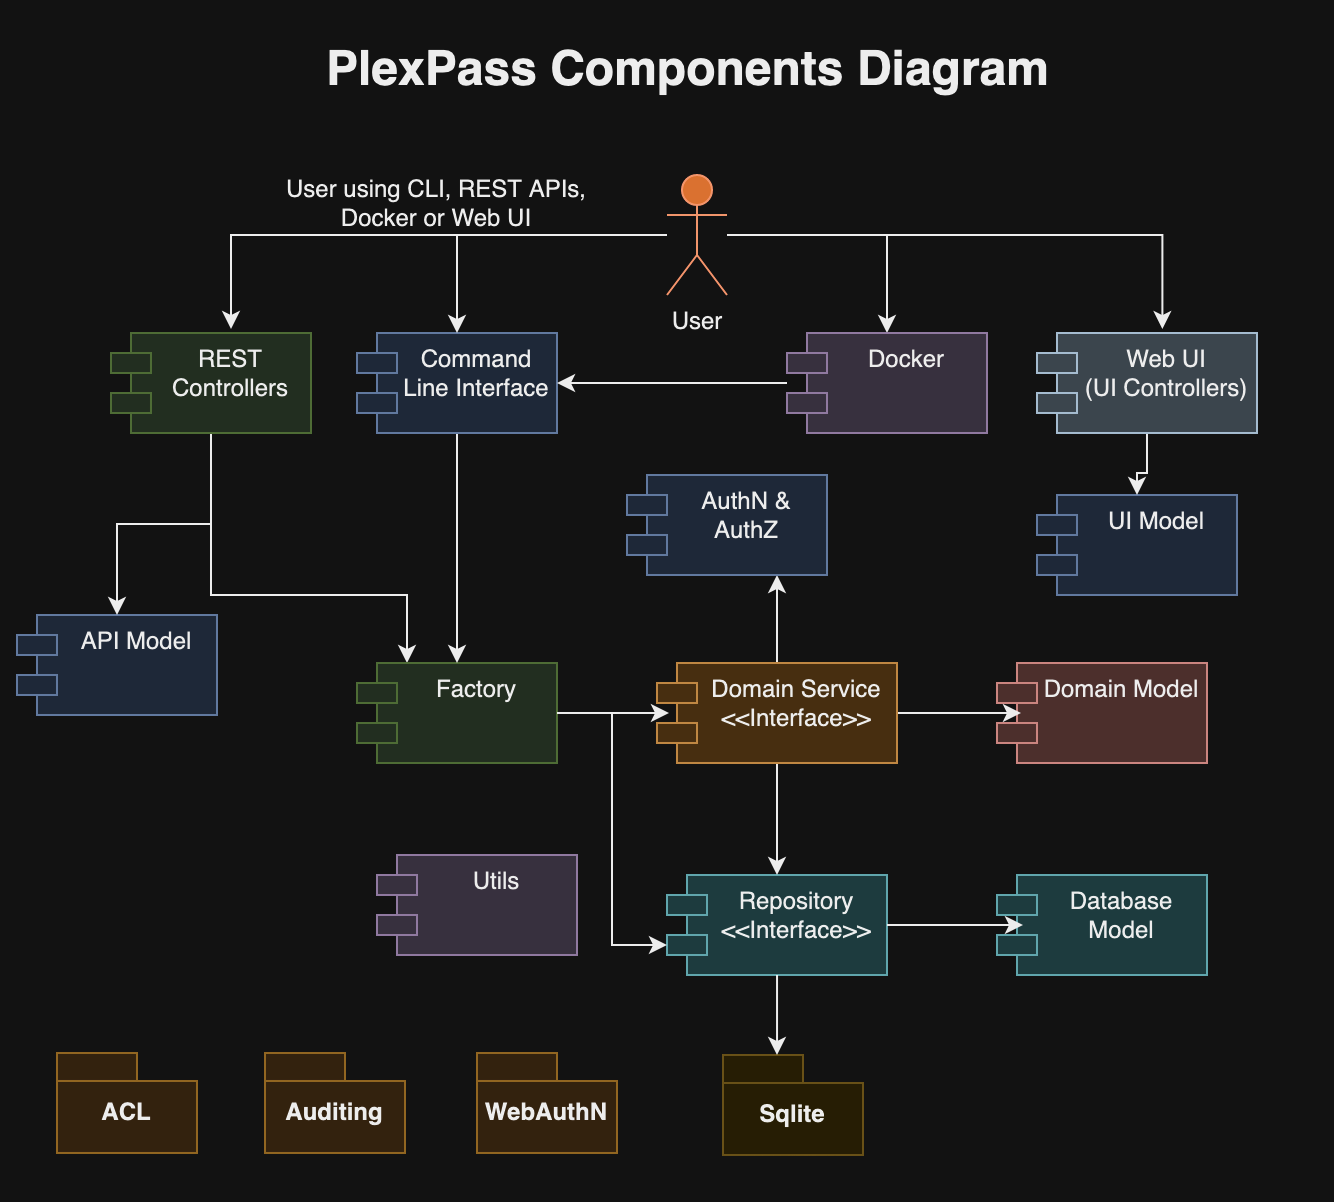
3.2 High-level Components
The architecture of Formicary is designed to manage and execute complex workflows where tasks are organized in a DAG structure. This architecture is inherently scalable and robust, catering to the needs of task scheduling, execution, and monitoring. Here’s an overview of its key functionalities and components:
components diagram
3.2.1 Functionalities
Job Processing: Formicary supports defining workflows as Job, where each node represents a task, and edges define dependencies. It ensures that tasks are executed in an order that respects their dependencies.
Task Distribution: Tasks, defined as units of work, are distributed among ant-workers based on tags and executor protocols (Kubernetes, Docker, Shell, HTTP, Websockets, etc.).
Scalability: Formicary scales to handle a large number of tasks and complex workflows. It supports horizontal scaling where more workers can be added to handle increased load.
Fault Tolerance and Reliability: It handles failures and retries of tasks.
Extensibility: It provides interfaces and plugins for extending its capabilities.
Resource Management: Efficiently allocates resources for task execution, optimizing for performance and cost.
Resource Quotas: It define maximum resource quotas for CPU, memory, disk space, and network usage for each job or task. This prevent any single job from over-consuming resources, ensuring fair resource allocation among all jobs.
Prioritization: It prioritize jobs based on criticality or predefined rules.
Job Throttling: It implement throttling mechanisms to control the rate at which jobs are fed into the system.
Kubernetes Clusters: Formicary allows for the creation of kubernetes clusters to supports auto-scaling and termination to optimize resource usage and cost.
Monitoring and Logging: It offers extensive monitoring and logging capabilities.
Authentication and Authorization: Formicary enforces strict authentication and authorization based on OAuth 2.0 and OIDC protocols before allowing access to the system.
Multitenancy: Formicary accommodates multiple tenants, allowing various organizations to sign up with one or more users, ensuring their data is safeguarded through robust authentication and authorization measures.
Common Plugins: Formicary allows the sharing of common plugins that function as sub-jobs for reusable features, which other users can then utilize.
3.2.2 Core Components
Following are core components of the Formicary system:
API Controller
The API controller defines an API that supports the following functions:
Checking the status of current, pending, or completed jobs
Submitting new jobs for execution
Looking up or modifying job specifications
Enrolling ant workers and overseeing resources for processing
Retrieving or uploading job-related artifacts
Handling settings, error codes, and resource allocation
Delivering both real-time and historical data reports
UI Controller
The UI controller offers the following features:
Displaying ongoing, queued, or completed jobs
Initiating new job submissions
Reviewing job specifications or introducing new ones
Supervising ant workers and execution units
Accessing or submitting artifacts
Configuring settings, error codes, and resource management
Providing access to both live and archived reports
Resource Manager
The resource manager enrolls ant workers and monitors the resources accessible for processing jobs. Ant workers regularly inform the resource manager about their available capacity and current workload. This continuous communication allows the resource manager to assess the maximum number of jobs that can run simultaneously without surpassing the capacity of the workers.
Job Scheduler
The job scheduler examines the queue for jobs awaiting execution and consults the resource manager to determine if a job can be allocated for execution. When sufficient resources are confirmed to be available, it dispatches a remote command to the Job-Launcher to initiate the job’s execution. Please note that the formicary architecture allows for multiple server instances, with the scheduler operating on the leader node. Meanwhile, other servers host the job-launcher and executor components, which are responsible for executing and orchestrating jobs.
Job Launcher
The job launcher remains attentive to incoming requests for job execution and initiates the process by engaging the Job-Supervisor. The Job-Supervisor then takes on the role of overseeing the execution of the job, ensuring its successful completion.
Job Supervisor
The job supervisor initiates a job in an asynchronous manner and manages the job’s execution. It oversees each task through the Task-Supervisor and determines the subsequent task to execute, guided by the status or exit code of the previously completed task.
Task Supervisor
The task supervisor initiates task execution by dispatching a remote instruction to the ant worker equipped to handle the specific task method, then stands by for a response. Upon receiving the outcome, the task supervisor records the results in the database for future reference and analysis.
Ant Workers
An ant worker registers with the queen server by specifying the types of tasks it can handle, using specific methods or tags for identification. Once registered, it remains vigilant for task requests, processing each one asynchronously according to the execution protocols defined for each task, and then relaying the results back to the server. Before starting on a task, the ant worker ensures all required artifacts are gathered and then uploads them once the task is completed. Moreover, the ant worker is responsible for managing the lifecycle of any external containers, such as those in Docker and Kubernetes systems, from initiation to termination.
To maintain system efficiency and prevent any single worker from becoming overwhelmed, the ant worker consistently updates the queen server with its current workload and capacity. This mechanism allows for a balanced distribution of tasks, ensuring that no worker is overloaded. The architecture is scalable, allowing for the addition of more ant workers to evenly spread the workload. These workers communicate with the queen server through messaging queues, enabling them to:
Regularly update the server on their workload and capacity.
Download necessary artifacts needed for task execution.
Execute tasks using the appropriate executors, such as Docker, HTTP, Kubernetes, Shell, or Websockets.
Upload the resulting artifacts upon completion of tasks.
Monitor and manage the lifecycle of Docker/Kubernetes containers, reporting back any significant events to the server.
Executors
The formicary system accommodates a range of executor methods, such as Kubernetes Pods, Docker containers, Shell commands, HTTP requests, and Messaging protocols, to abstract the runtime environment for executing tasks. The choice of executor within the formicary is defined through designated methods, with each method specifying a different execution environment.
Note: These execution methods can be easily extended to support other executor protocols to provide greater flexibility in how tasks are executed and integrated with different environments.
Database
The formicary system employs a relational database to systematically store and manage a wide array of data, including job requests, detailed job definitions, resource allocations, error codes, and various configurations.
Artifacts and Object Store
The formicary system utilizes an object storage solution to maintain the artifacts produced during task execution, those generated within the image cache, or those uploaded directly by users. This method ensures a scalable and secure way to keep large volumes of unstructured data, facilitating easy access and retrieval of these critical components for operational efficiency and user interaction.
Messaging
Messaging enables seamless interaction between the scheduler and the workers, guaranteeing dependable dissemination of tasks across distributed settings.
Notification System
The notification system dispatches alerts and updates regarding the pipeline status to users.
3.3 Data Model
Here’s an overview of its key data model in Formicary system:
Domain Classes
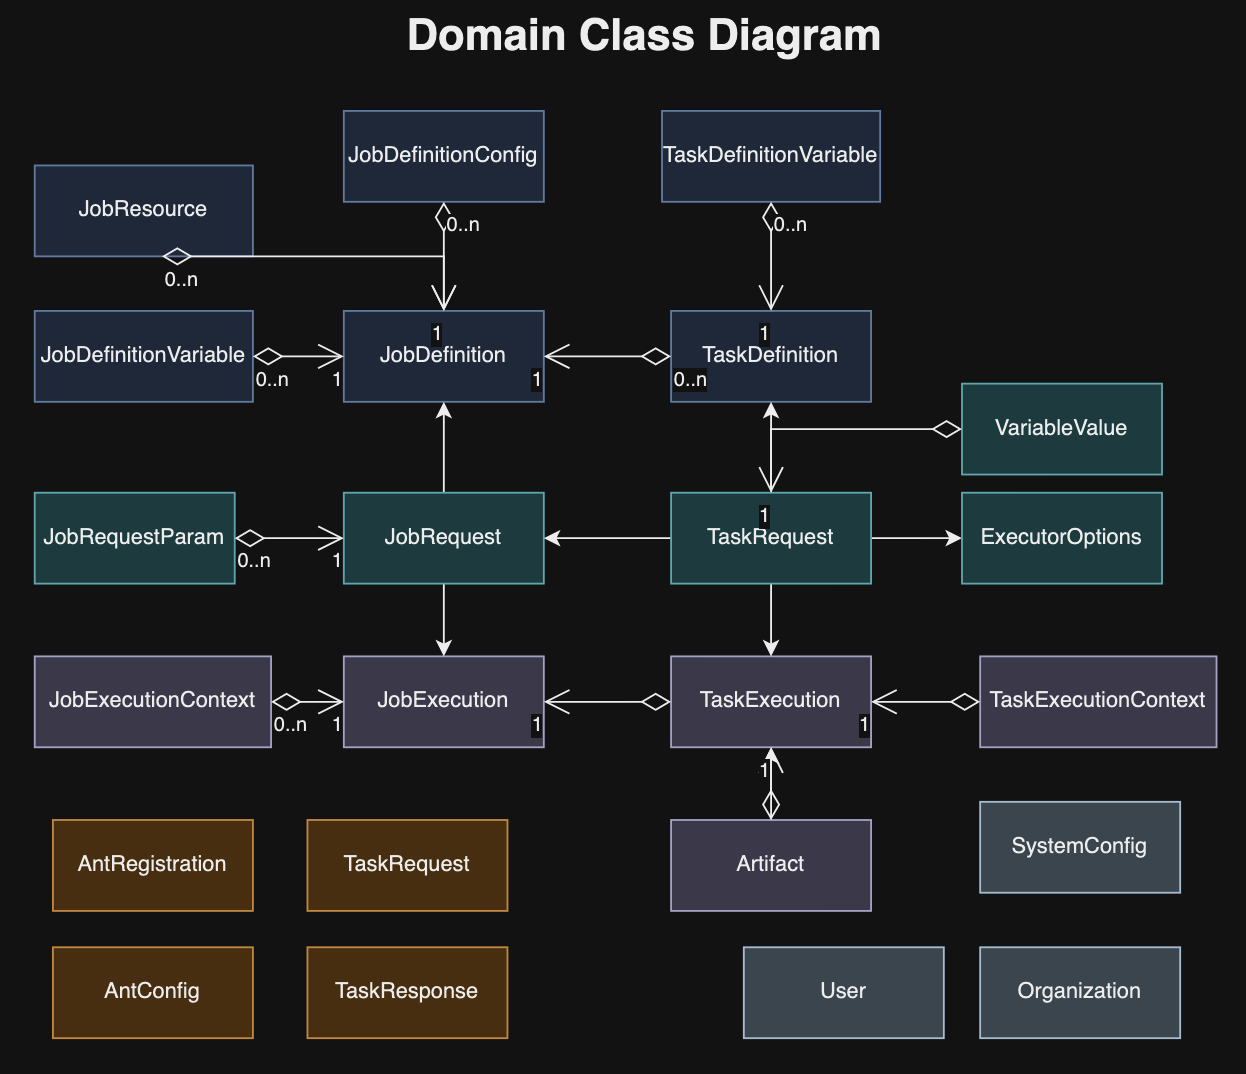
3.3.1 Job Definition
A JobDefinition outlines a set of tasks arranged in a Directed Acyclic Graph (DAG), executed by worker entities. The workflow progresses based on the exit codes of tasks, determining the subsequent task to execute. Each task definition encapsulates a job’s specifics, and upon receiving a new job request, an instance of this job is initiated through JobExecution.
type JobDefinition struct {
	// ID defines UUID for primary key
	ID string `yaml:"-" json:"id" gorm:"primary_key"`
	// JobType defines a unique type of job
	JobType string `yaml:"job_type" json:"job_type"`
	// Version defines internal version of the job-definition, which is updated when a job is updated. The database
	// stores each version as a separate row but only latest version is used for new jobs.
	Version int32 `yaml:"-" json:"-"`
	// SemVersion - semantic version is used for external version, which can be used for public plugins.
	SemVersion string `yaml:"sem_version" json:"sem_version"`
	// URL defines url for job
	URL string `json:"url"`
	// UserID defines user who updated the job
	UserID string `json:"user_id"`
	// OrganizationID defines org who submitted the job
	OrganizationID string `json:"organization_id"`
	// Description of job
	Description string `yaml:"description,omitempty" json:"description"`
	// Platform can be OS platform or target runtime and a job can be targeted for specific platform that can be used for filtering
	Platform string `yaml:"platform,omitempty" json:"platform"`
	// CronTrigger can be used to run the job periodically
	CronTrigger string `yaml:"cron_trigger,omitempty" json:"cron_trigger"`
	// Timeout defines max time a job should take, otherwise the job is aborted
	Timeout time.Duration `yaml:"timeout,omitempty" json:"timeout"`
	// Retry defines max number of tries a job can be retried where it re-runs failed job
	Retry int `yaml:"retry,omitempty" json:"retry"`
	// HardResetAfterRetries defines retry config when job is rerun and as opposed to re-running only failed tasks, all tasks are executed.
	HardResetAfterRetries int `yaml:"hard_reset_after_retries,omitempty" json:"hard_reset_after_retries"`
	// DelayBetweenRetries defines time between retry of job
	DelayBetweenRetries time.Duration `yaml:"delay_between_retries,omitempty" json:"delay_between_retries"`
	// MaxConcurrency defines max number of jobs that can be run concurrently
	MaxConcurrency int `yaml:"max_concurrency,omitempty" json:"max_concurrency"`
	// disabled is used to stop further processing of job, and it can be used during maintenance, upgrade or debugging.
	Disabled bool `yaml:"-" json:"disabled"`
	// PublicPlugin means job is public plugin
	PublicPlugin bool `yaml:"public_plugin,omitempty" json:"public_plugin"`
	// RequiredParams from job request (and plugin)
	RequiredParams []string `yaml:"required_params,omitempty" json:"required_params" gorm:"-"`
	// Tags are used to use specific followers that support the tags defined by ants.
	// Tags is aggregation of task tags
	Tags string `yaml:"tags,omitempty" json:"tags"`
	// Methods is aggregation of task methods
	Methods string `yaml:"methods,omitempty" json:"methods"`
	// Tasks defines one to many relationships between job and tasks, where a job defines
	// a directed acyclic graph of tasks that are executed for the job.
	Tasks []*TaskDefinition `yaml:"tasks" json:"tasks" gorm:"ForeignKey:JobDefinitionID" gorm:"auto_preload" gorm:"constraint:OnUpdate:CASCADE"`
	// Configs defines config properties of job that are used as parameters for the job template or task request when executing on a remote
	// ant follower. Both config and variables provide similar capabilities but config can be updated for all job versions and can store
	// sensitive data.
	Configs []*JobDefinitionConfig `yaml:"-" json:"-" gorm:"ForeignKey:JobDefinitionID" gorm:"auto_preload" gorm:"constraint:OnUpdate:CASCADE"`
	// Variables defines properties of job that are used as parameters for the job template or task request when executing on a remote
	// ant follower. Both config and variables provide similar capabilities but variables are part of the job yaml definition.
	Variables []*JobDefinitionVariable `yaml:"-" json:"-" gorm:"ForeignKey:JobDefinitionID" gorm:"auto_preload" gorm:"constraint:OnUpdate:CASCADE"`
	// CreatedAt job creation time
	CreatedAt time.Time `yaml:"-" json:"created_at"`
	// UpdatedAt job update time
	UpdatedAt time.Time `yaml:"-" json:"updated_at"`
}
3.3.2 Task Definition
A TaskDefinition outlines the work performed by worker entities. It specifies the task’s parameters and, upon a new job request, a TaskExecution instance is initiated to carry out the task. The task details, including its method and tags, guide the dispatch of task requests to a compatible remote worker. Upon task completion, the outcomes are recorded in the database for reference.
type TaskDefinition struct {
	// ID defines UUID for primary key
	ID string `yaml:"-" json:"id" gorm:"primary_key"`
	// JobDefinitionID defines foreign key for JobDefinition
	JobDefinitionID string `yaml:"-" json:"job_definition_id"`
	// TaskType defines type of task
	TaskType string `yaml:"task_type" json:"task_type"`
	// Method TaskMethod defines method of communication
	Method common.TaskMethod `yaml:"method" json:"method"`
	// Description of task
	Description string `yaml:"description,omitempty" json:"description"`
	// HostNetwork defines kubernetes/docker config for host_network
	HostNetwork string `json:"host_network,omitempty" yaml:"host_network,omitempty" gorm:"-"`
	// AllowFailure means the task is optional and can fail without failing entire job
	AllowFailure bool `yaml:"allow_failure,omitempty" json:"allow_failure"`
	// AllowStartIfCompleted  means the task is always run on retry even if it was completed successfully
	AllowStartIfCompleted bool `yaml:"allow_start_if_completed,omitempty" json:"allow_start_if_completed"`
	// AlwaysRun means the task is always run on execution even if the job fails. For example, a required task fails (without
	// AllowFailure), the job is aborted and remaining tasks are skipped but a task defined as `AlwaysRun` is run even if the job fails.
	AlwaysRun bool `yaml:"always_run,omitempty" json:"always_run"`
	// Timeout defines max time a task should take, otherwise the job is aborted
	Timeout time.Duration `yaml:"timeout,omitempty" json:"timeout"`
	// Retry defines max number of tries a task can be retried where it re-runs failed tasks
	Retry int `yaml:"retry,omitempty" json:"retry"`
	// DelayBetweenRetries defines time between retry of task
	DelayBetweenRetries time.Duration `yaml:"delay_between_retries,omitempty" json:"delay_between_retries"`
	// Webhook config
	Webhook *common.Webhook `yaml:"webhook,omitempty" json:"webhook" gorm:"-"`
	// OnExitCodeSerialized defines next task to execute
	OnExitCodeSerialized string `yaml:"-" json:"-"`
	// OnExitCode defines next task to run based on exit code
	OnExitCode map[common.RequestState]string `yaml:"on_exit_code,omitempty" json:"on_exit_code" gorm:"-"`
	// OnCompleted defines next task to run based on completion
	OnCompleted string `yaml:"on_completed,omitempty" json:"on_completed" gorm:"on_completed"`
	// OnFailed defines next task to run based on failure
	OnFailed string `yaml:"on_failed,omitempty" json:"on_failed" gorm:"on_failed"`
	// Variables defines properties of task
	Variables []*TaskDefinitionVariable `yaml:"-" json:"-" gorm:"ForeignKey:TaskDefinitionID" gorm:"auto_preload" gorm:"constraint:OnUpdate:CASCADE"`
	TaskOrder int       `yaml:"-" json:"-" gorm:"task_order"`
	// ReportStdout is used to send stdout as a report
	ReportStdout bool `yaml:"report_stdout,omitempty" json:"report_stdout"`
	// Transient properties -- these are populated when AfterLoad or Validate is called
	NameValueVariables interface{} `yaml:"variables,omitempty" json:"variables" gorm:"-"`
	// Header defines HTTP headers
	Headers map[string]string `yaml:"headers,omitempty" json:"headers" gorm:"-"`
	// BeforeScript defines list of commands that are executed before main script
	BeforeScript []string `yaml:"before_script,omitempty" json:"before_script" gorm:"-"`
	// AfterScript defines list of commands that are executed after main script for cleanup
	AfterScript []string `yaml:"after_script,omitempty" json:"after_script" gorm:"-"`
	// Script defines list of commands to execute in container
	Script []string `yaml:"script,omitempty" json:"script" gorm:"-"`
	// Resources defines resources required by the task
	Resources BasicResource `yaml:"resources,omitempty" json:"resources" gorm:"-"`
	// Tags are used to use specific followers that support the tags defined by ants.
	// For example, you may start a follower that processes payments and the task will be routed to that follower
	Tags []string `yaml:"tags,omitempty" json:"tags" gorm:"-"`
	// Except is used to filter task execution based on certain condition
	Except string `yaml:"except,omitempty" json:"except" gorm:"-"`
	// JobVersion defines job version
	JobVersion string `yaml:"job_version,omitempty" json:"job_version" gorm:"-"`
	// Dependencies defines dependent tasks for downloading artifacts
	Dependencies []string `json:"dependencies,omitempty" yaml:"dependencies,omitempty" gorm:"-"`
	// ArtifactIDs defines id of artifacts that are automatically downloaded for job-execution
	ArtifactIDs []string `json:"artifact_ids,omitempty" yaml:"artifact_ids,omitempty" gorm:"-"`
	// ForkJobType defines type of job to work
	ForkJobType string `json:"fork_job_type,omitempty" yaml:"fork_job_type,omitempty" gorm:"-"`
	// URL to use
	URL string `json:"url,omitempty" yaml:"url,omitempty" gorm:"-"`
	// AwaitForkedTasks defines list of jobs to wait for completion
	AwaitForkedTasks      []string `json:"await_forked_tasks,omitempty" yaml:"await_forked_tasks,omitempty" gorm:"-"`
	MessagingRequestQueue string   `json:"messaging_request_queue,omitempty" yaml:"messaging_request_queue,omitempty" gorm:"-"`
	MessagingReplyQueue   string   `json:"messaging_reply_queue,omitempty" yaml:"messaging_reply_queue,omitempty" gorm:"-"`
	// CreatedAt job creation time
	CreatedAt time.Time `yaml:"-" json:"created_at"`
	// UpdatedAt job update time
	UpdatedAt time.Time `yaml:"-" json:"updated_at"`
}
3.3.3 JobExecution
JobExecution refers to a specific instance of a job-definition that gets activated upon the submission of a job-request. When a job is initiated by the job-launcher, this triggers the creation of a job-execution instance, which is also recorded in the database. Following this initiation, the job-launcher transfers responsibility for the job to the job-supervisor, which then commences execution, updating the status of both the job request and execution to EXECUTING. The job supervisor manages the execution process, ultimately altering the status to COMPLETED or FAILED upon completion. Throughout this process, the formicary system emits job lifecycle events to reflect these status changes, which can be monitored by UI or API clients.
For every task outlined within the task-definition associated with the JobExecution, a corresponding TaskExecution instance is generated. This setup tracks the progress and state of both job and task executions within a database, and any outputs generated during the job execution process are preserved in object storage.
type JobExecution struct {
	// ID defines UUID for primary key
	ID string `json:"id" gorm:"primary_key"`
	// JobRequestID defines foreign key for job request
	JobRequestID uint64 `json:"job_request_id"`
	// JobType defines type for the job
	JobType    string `json:"job_type"`
	JobVersion string `json:"job_version"`
	// JobState defines state of job that is maintained throughout the lifecycle of a job
	JobState types.RequestState `json:"job_state"`
	// OrganizationID defines org who submitted the job
	OrganizationID string `json:"organization_id"`
	// UserID defines user who submitted the job
	UserID string `json:"user_id"`
	// ExitCode defines exit status from the job execution
	ExitCode string `json:"exit_code"`
	// ExitMessage defines exit message from the job execution
	ExitMessage string `json:"exit_message"`
	// ErrorCode captures error code at the end of job execution if it fails
	ErrorCode string `json:"error_code"`
	// ErrorMessage captures error message at the end of job execution if it fails
	ErrorMessage string `json:"error_message"`
	// Contexts defines context variables of job
	Contexts []*JobExecutionContext `json:"contexts" gorm:"ForeignKey:JobExecutionID" gorm:"auto_preload"`
	// Tasks defines list of tasks that are executed for the job
	Tasks []*TaskExecution `json:"tasks" gorm:"ForeignKey:JobExecutionID" gorm:"auto_preload"`
	// StartedAt job execution start time
	StartedAt time.Time `json:"started_at"`
	// EndedAt job execution end time
	EndedAt *time.Time `json:"ended_at"`
	// UpdatedAt job execution last update time
	UpdatedAt time.Time `json:"updated_at"`
	// CPUSecs execution time
	CPUSecs int64 `json:"cpu_secs"`
}
The state of job execution includes: PENDING, READY, COMPLETED, FAILED, EXECUTING, STARTED, PAUSED, and CANCELLED.
3.3.4 TaskExecution
TaskExecution records the execution of a task or a unit of work, carried out by ant-workers in accordance with the specifications of the task-definition. It captures the status and the outputs produced by the task execution, storing them in the database and the object-store. When a task begins, it is represented by a task-execution instance, initiated by the task supervisor. This instance is stored in the database by the task supervisor, which then assembles a task request to dispatch to a remote ant worker. The task supervisor awaits the worker’s response before updating the database with the outcome. Task execution concludes with either a COMPLETED or FAILED status, and it also accommodates an exit code provided by the worker. Based on the final status or exit code, orchestration rules determine the subsequent task to execute.
type TaskExecution struct {
	// ID defines UUID for primary key
	ID string `json:"id" gorm:"primary_key"`
	// JobExecutionID defines foreign key for JobExecution
	JobExecutionID string `json:"job_execution_id"`
	// TaskType defines type of task
	TaskType string `json:"task_type"`
	// Method defines method of communication
	Method types.TaskMethod `yaml:"method" json:"method"`
	// TaskState defines state of task that is maintained throughout the lifecycle of a task
	TaskState types.RequestState `json:"task_state"`
	// AllowFailure means the task is optional and can fail without failing entire job
	AllowFailure bool `json:"allow_failure"`
	// ExitCode defines exit status from the job execution
	ExitCode string `json:"exit_code"`
	// ExitMessage defines exit message from the job execution
	ExitMessage string `json:"exit_message"`
	// ErrorCode captures error code at the end of job execution if it fails
	ErrorCode string `json:"error_code"`
	// ErrorMessage captures error message at the end of job execution if it fails
	ErrorMessage string `json:"error_message"`
	// FailedCommand captures command that failed
	FailedCommand string `json:"failed_command"`
	// AntID - id of ant with version
	AntID string `json:"ant_id"`
	// AntHost - host where ant ran the task
	AntHost string `json:"ant_host"`
	// Retried keeps track of retry attempts
	Retried int `json:"retried"`
	// Contexts defines context variables of task
	Contexts []*TaskExecutionContext `json:"contexts" gorm:"ForeignKey:TaskExecutionID" gorm:"auto_preload"`
	// Artifacts defines list of artifacts that are generated for the task
	Artifacts []*types.Artifact `json:"artifacts" gorm:"ForeignKey:TaskExecutionID"`
	// TaskOrder
	TaskOrder int `json:"task_order"`
	// CountServices
	CountServices int `json:"count_services"`
	// CostFactor
	CostFactor float64 `json:"cost_factor"`
  	Stdout []string `json:"stdout" gorm:"-"`
	// StartedAt job creation time
	StartedAt time.Time `json:"started_at"`
	// EndedAt job update time
	EndedAt *time.Time `json:"ended_at"`
	// UpdatedAt job execution last update time
	UpdatedAt time.Time `json:"updated_at"`
}
The state of TaskExecution includes READY, STARTED, EXECUTING, COMPLETED, and FAILED.
3.3.5 JobRequest
JobRequest outlines a user’s request to execute a job as per its job-definition. Upon submission, a job-request is marked as PENDING in the database and later, it is asynchronously scheduled for execution by the job scheduler, depending on resource availability. It’s important to note that users have the option to schedule a job for a future date to avoid immediate execution. Additionally, a job definition can include a cron property, which automatically generates job requests at predetermined times for execution. Besides user-initiated requests, a job request might also be issued by a parent job to execute a child job in a fork/join manner.
type JobRequest struct {
	//gorm.Model
	// ID defines UUID for primary key
	ID uint64 `json:"id" gorm:"primary_key"`
	// ParentID defines id for parent job
	ParentID uint64 `json:"parent_id"`
	// UserKey defines user-defined UUID and can be used to detect duplicate jobs
	UserKey string `json:"user_key"`
	// JobDefinitionID points to the job-definition version
	JobDefinitionID string `json:"job_definition_id"`
	// JobExecutionID defines foreign key for JobExecution
	JobExecutionID string `json:"job_execution_id"`
	// LastJobExecutionID defines foreign key for JobExecution
	LastJobExecutionID string `json:"last_job_execution_id"`
	// OrganizationID defines org who submitted the job
	OrganizationID string `json:"organization_id"`
	// UserID defines user who submitted the job
	UserID string `json:"user_id"`
	// Permissions provides who can access this request 0 - all, 1 - Org must match, 2 - UserID must match from authentication
	Permissions int `json:"permissions"`
	// Description of the request
	Description string `json:"description"`
	// Platform overrides platform property for targeting job to a specific follower
	Platform string `json:"platform"`
	// JobType defines type for the job
	JobType    string `json:"job_type"`
	JobVersion string `json:"job_version"`
	// JobState defines state of job that is maintained throughout the lifecycle of a job
	JobState types.RequestState `json:"job_state"`
	// JobGroup defines a property for grouping related job
	JobGroup string `json:"job_group"`
	// JobPriority defines priority of the job
	JobPriority int `json:"job_priority"`
	// Timeout defines max time a job should take, otherwise the job is aborted
	Timeout time.Duration `yaml:"timeout,omitempty" json:"timeout"`
	// ScheduleAttempts defines attempts of schedule
	ScheduleAttempts int `json:"schedule_attempts" gorm:"schedule_attempts"`
	// Retried keeps track of retry attempts
	Retried int `json:"retried"`
	// CronTriggered is true if request was triggered by cron
	CronTriggered bool `json:"cron_triggered"`
	// QuickSearch provides quick search to search a request by params
	QuickSearch string `json:"quick_search"`
	// ErrorCode captures error code at the end of job execution if it fails
	ErrorCode string `json:"error_code"`
	// ErrorMessage captures error message at the end of job execution if it fails
	ErrorMessage string `json:"error_message"`
	// Params are passed with job request
	Params []*JobRequestParam `yaml:"-" json:"-" gorm:"ForeignKey:JobRequestID" gorm:"auto_preload" gorm:"constraint:OnUpdate:CASCADE"`
	// Execution refers to job-Execution
	Execution       *JobExecution          `yaml:"-" json:"execution" gorm:"-"`
	Errors          map[string]string      `yaml:"-" json:"-" gorm:"-"`
	// ScheduledAt defines schedule time when job will be submitted so that you can submit a job
	// that will be executed later
	ScheduledAt time.Time `json:"scheduled_at"`
	// CreatedAt job creation time
	CreatedAt time.Time `json:"created_at"`
	// UpdatedAt job update time
	UpdatedAt time.Time `json:"updated_at" gorm:"updated_at"`
}
3.3.6 TaskRequest
TaskRequest specifies the parameters for a task that is dispatched to a remote ant-worker for execution. This request is transmitted through a messaging middleware to the most appropriate ant-worker, selected based on its resource availability and capacity to handle the task efficiently.
ExecutorOptions specify the settings for the underlying executor, including Docker, Kubernetes, Shell, HTTP, etc., ensuring tasks are carried out using the suitable computational resources.
Here’s a summary of the principal events model within the Formicary system, which facilitates communication among the main components:
Formicary Events
In above diagram, the lifecycle events are published upon start and completion of a job-request, job-execution, task-execution, and containers. Other events are propagated upon health errors, logging and leader election for the job scheduler.
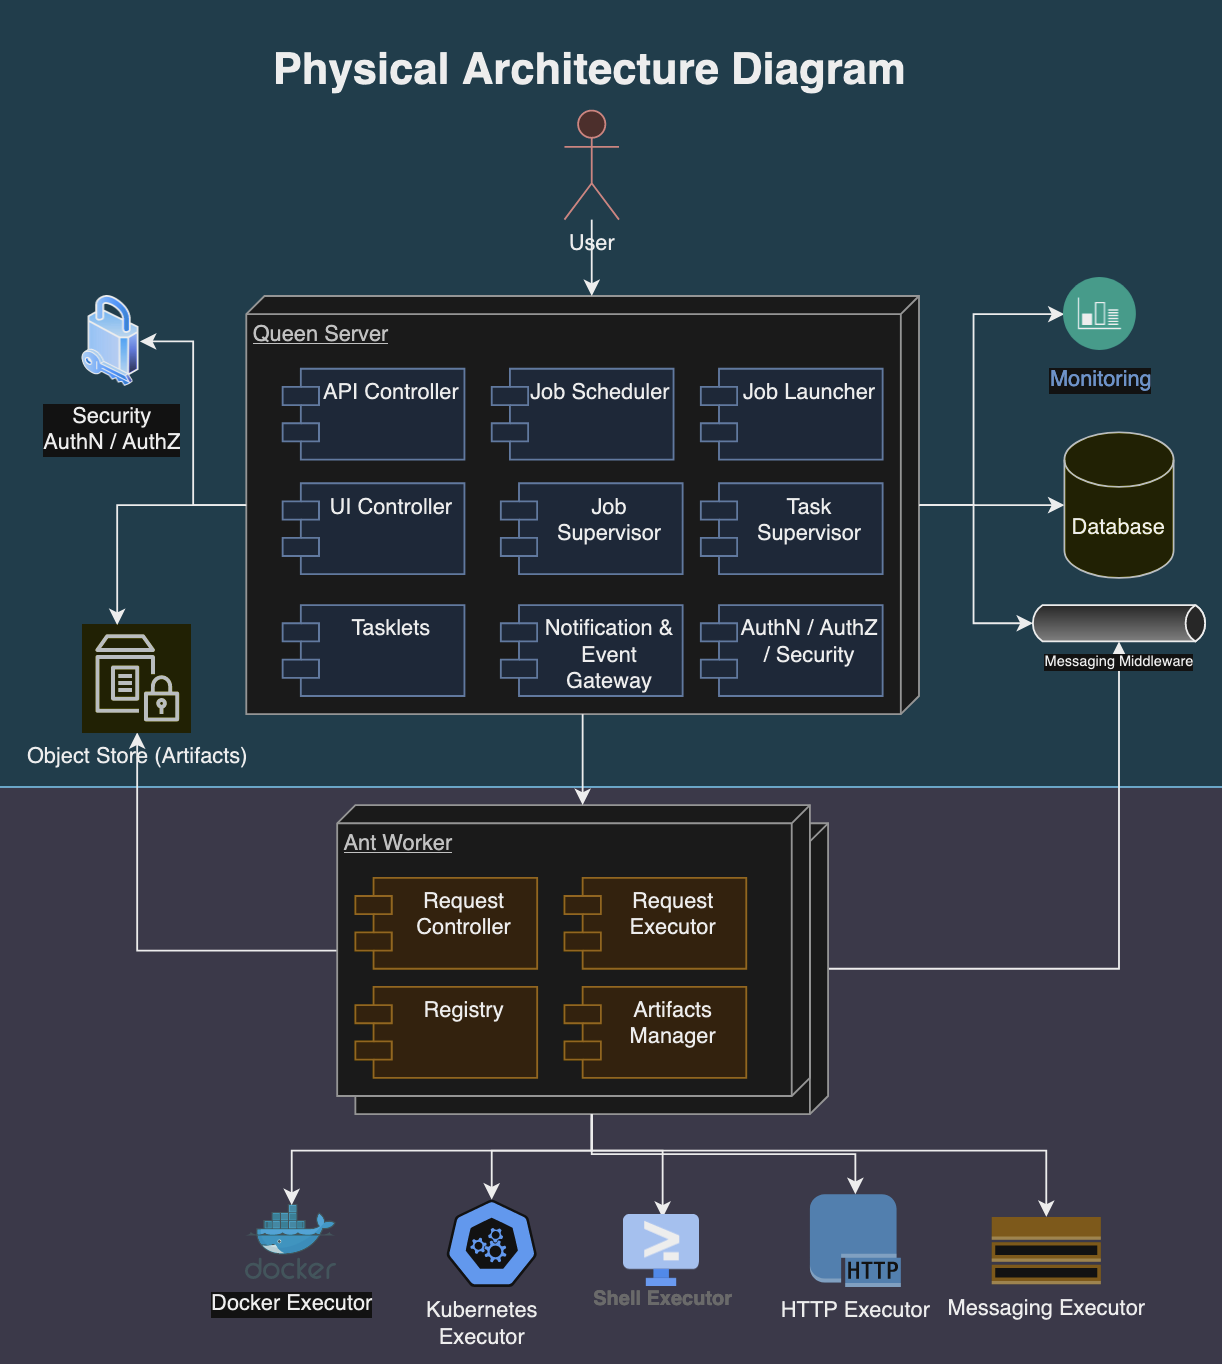
3.5 Physical Architecture
Following diagram depicts the physical architecture of the Formicary system:
physical architecture
The physical architecture of a Formicary system is structured as follows:
Queen Server: It manages task scheduling, resource allocation, and system monitoring. The job requests, definitions, user data, and configuration settings are maintained in the database.
Ant Workers: These are distributed computing resources that execute the tasks assigned by the central server. Each ant worker is equipped with the necessary software to perform various tasks, such as processing data, running applications, or handling web requests. Worker nodes report their status, capacity, and workload back to the central server to facilitate efficient task distribution.
Storage Systems: Relational databases are used to store structured data such as job definitions, user accounts, and system configurations. Object storage systems hold unstructured data, including task artifacts, logs, and binary data.
Messaging Middleware: Messaging queues and APIs facilitate asynchronous communication and integration with other systems.
Execution Environments: Consist of container orchestration systems like Kubernetes and Docker for isolating and managing task executions. They provide scalable and flexible environments that support various execution methods, including shell scripts, HTTP requests, and custom executables.
Monitoring and Alerting Tools:Formicary system integrates with Prometheus for monitoring solutions to track the health, performance, and resource usage of both the central server and worker nodes. Alerting mechanisms notify administrators and users about system events, performance bottlenecks, and potential issues.
Security Infrastructure: Authentication and authorization mechanisms control access to resources and tasks based on user roles and permissions.
This architecture allows the Formicary system to scale horizontally by adding more worker nodes as needed to handle increased workloads, and vertically by enhancing the capabilities of the central server and worker nodes. The system’s design emphasizes reliability, scalability, and efficiency, making it suitable for a wide range of applications, from data processing and analysis to web hosting and content delivery.
4. API Overview
The Formicary API is a comprehensive orchestration engine designed for executing complex job workflows, represented as a directed acyclic graph (DAG) of tasks. It’s built on design principles such as Leader-Follower, Pipes-Filter, Fork-Join, and SEDA, catering to a range of execution strategies. The API supports task unit management, job definition, and workflow configurations, including conditional logic and parameterization. The API defines a range of models for different entities such as AntRegistration, Artifact, JobDefinition, JobRequest, and many more, providing a structured approach to orchestration. Key functionalities of the Formicary API include:
4.1 Ant Registration
Management of ant registrations, enabling queries and retrievals by ID such as:
GET /api/ants: Queries ant registration.
GET /api/ants/{id}: Retrieves ant-registration by its id.
4.2 Artifacts
Handling of artifacts, allowing for querying, uploading, and managing artifact data, including downloading and log retrieval.
GET /api/artifacts: Queries artifacts by name, task-type, etc.
POST /api/artifacts: Uploads artifact data from the request body and returns metadata for the uploaded data.
DELETE /api/artifacts:/{id}: Deletes an artifact by its ID.
GET /api/artifacts:/{id}: Retrieves an artifact by its ID.
4.3 System Configs
Creation, deletion, updating, and querying of system configurations.
GET /api/configs: Retrieves system configs.
POST /api/configs: Creates new system config based on request body.
DELETE /api/configs/{id}: Deletes an existing system config based on id.
GET /api/configs/{id}: Finds an existing system config based on id.
PUT /api/configs/{id}: Updates an existing system config based on request body.
4.4 Error Codes
Management of error codes, including creation, updating, deletion, and querying by type or regex.
GET /api/errors: Queries error-codes by type, regex.
POST /api/errors: Creates new error code based on request body.
PUT /api/errors: Updates new error code based on request body.
DELETE /api/errors/{id}: Deletes error code by id.
GET /api/errors/{id}: Finds error code by id.
4.5 Container Execution
Querying of container executions and management of container executors.
GET /api/executors: Queries container executions.
GET /api/executors/{id}: Deletes container-executor by its id.
4.6 Job Definitions
Comprehensive job definition management, including creation, deletion, querying, concurrency updates, enabling/disabling, and graphical representation (DOT format).
GET /api/jobs/definitions: Queries job definitions by criteria such as type, platform, etc.
POST /api/jobs/definitions: Uploads job definitions using JSON or YAML body based on content-type header.
DELETE /api/jobs/definitions/{id}: Deletes the job-definition by id.
GET /api/jobs/definitions/{id}: Finds the job-definition by id.
PUT /api/jobs/definitions/{id}/concurrency: Updates the concurrency for job-definition by id to limit the maximum jobs that can be executed at the same time.
POST /api/jobs/definitions/{id}/disable: disables job-definition so that no new requests are executed while in-progress jobs are allowed to complete.
GET /api/jobs/definitions/{id}/dot: Returns Graphviz DOT definition for the graph of tasks defined in the job.
GET /api/jobs/definitions/{id}/stats: Returns Real-time statistics of jobs running.
POST /api/jobs/definitions/{id}/enable: Enables job-definition so that new requests can start processing.
GET /api/jobs/definitions/{type}/yaml: Finds job-definition by type and returns response YAML format.
GET /api/jobs/plugins: Queries job definitions by criteria such as type, platform, etc.
4.7 Job Configs
Configuration management for jobs, including adding, deleting, finding, and updating configs.
GET /api/jobs/definitions/{jobId}/configs: Queries job configs by criteria such as name, type, etc.
POST /api/jobs/definitions/{jobId}/configs: Adds a config for the job.
DELETE /api/jobs/definitions/{jobId}/configs/{id}: Deletes a config for the job by id.
GET /api/jobs/definitions/{jobId}/configs/{id}: Finds a config for the job by id.
PUT /api/jobs/definitions/{jobId}/configs/{id}: Updates a config for the job.
4.8 Job Requests
Handling of job requests, including submission, querying, cancellation, restart, triggering, and wait time calculations.
GET /api/jobs/requests: Queries job requests by criteria such as type, platform, etc.
POST /api/jobs/requests: Submits a job-request for processing, which is saved in the database and is then scheduled for execution.
GET /api/jobs/requests/{id}: Finds the job-request by id.
POST /api/jobs/requests/{id}/cancel: Cancels a job-request that is pending for execution or already executing.
POST /api/jobs/requests/{id}/pause: Pauses a job-request that is pending for execution or already executing.
GET /api/jobs/requests/{id}/dot: Returns Graphviz DOT request for the graph of tasks defined in the job request.
GET /api/jobs/requests/{id}/dot.png: Returns Graphviz DOT image for the graph of tasks defined in the job.
POST /api/jobs/requests/{id}/restart: Restarts a previously failed job so that it can re-execute.
POST /api/jobs/requests/{id}/trigger: Triggers a scheduled job.
GET /api/jobs/requests/{id}/wait_time: Returns wait time for the job-request.
GET /api/jobs/requests/dead_ids: Returns job-request ids for recently completed jobs.
GET /api/jobs/requests/stats: Returns statistics for the job-request such as success rate, latency, etc.
4.9 Job Resources
Management of job resources, including adding, finding, updating, and configuring resources.
GET /api/jobs/resources: Queries job resources by criteria such as type, platform, etc.
POST /api/jobs/resources: Adds a job-resource that can be used for managing internal or external constraints.
GET /api/jobs/resources/{id}: Finds the job-resource by id.
PUT /api/jobs/resources/{id}: Updates a job-resource that can be used for managing internal or external constraints.
POST /api/jobs/resources/{id}/configs: Saves the configuration of a job-resource.
DELETE /api/jobs/resources/{id}/configs/{configId}: Deletes the configuration of a job-resource.
POST /api/jobs/resources/{id}/disable: Disables the job-resource so that any jobs requiring it will not be able to execute.
4.10 Organizations
Organization management, including creation, deletion, updating, and querying.
GET /api/orgs: Queries organizations by criteria such as org-unit, bundle, etc.
POST /api/orgs: Creates new organization.
DELETE /api/orgs/{id}: Deletes the organization by its id.
GET /api/orgs/{id}: Finds the organization by its id.
PUT /api/orgs/{id}: Updates the organization profile.
POST /api/orgs/{id}/invite: Invites a user to an organization.
POST /api/orgs/usage_report: Generates usage report for the organization.
4.11 Organization Configs
Management of organization-specific configs.
GET /api/orgs/{orgId}/configs: Queries organization configs by criteria such as name, type, etc.
POST /api/orgs/{orgId}/configs: Adds a config for the organization.
DELETE /api/orgs/{orgId}/configs/{id}: Deletes a config for the organization by id.
GET /api/orgs/{orgId}/configs/{id}: Finds a config for the organization by id.
PUT /api/orgs/{orgId}/configs/{id}: Updates a config for the organization.
4.12 Subscriptions
Management of system subscriptions.
GET /api/subscriptions: Finds an existing system subscription based on id.
POST /api/subscriptions: Creates new system subscription based on request body.
DELETE /api/subscriptions/{id}: Deletes an existing system subscription based on id.
GET /api/subscriptions/{id}: Finds an existing system subscription based on id.
PUT /api/subscriptions/{id}: Updates an existing system subscription based on request body.
4.13 Users
User management within an organization, including creation, deletion, and profile updates.
GET /api/users: Queries users within the organization that is allowed.
POST /api/users: Creates new user.
DELETE /api/users/{id}: Deletes the user profile by its id.
GET /api/users/{id}: Finds user profile by its id.
PUT /api/users/{id}: Updates user profile.
PUT /api/users/{id}/notify: Updates user notification.
4.14 User Tokens
Management of user tokens for API access.
GET /api/users/{userId}/tokens: Queries user-tokens for the API access.
POST /api/users/{userId}/tokens: Creates new user-token for the API access.
DELETE /api/users/{userId}/tokens/{id}: Deletes user-token by its id so that it cannot be used for the API access.
The API documentation is accessible at a URL and includes a Swagger YAML file for detailed API specifications. The API emphasizes support and extensibility, offering various endpoints for managing jobs, configurations, resources, and user interactions within the orchestration platform.
5. Getting Started
5.1 Declarative Job & Task Declaration
In the Formicary system, a job is structured as a declarative directed acyclic graph (DAG). This setup dictates the execution sequence, where the transition from one task to another is contingent upon the exit code or status of the preceding node or task.
5.1.1 Job Configuration
A job is described as a series of tasks arranged in a directed acyclic graph (DAG), with each task detailing the required environment, commands/APIs, and configuration parameters necessary for execution. The definition of a job encompasses the following attributes:
job_type: defines a short unique name of the job and as Formicary is a multi-tenant system, it’s only needs to be unique within an organization. For example: job_type: my_test_job
job_variables: defines variables for job context that are available for all tasks, e.g. job_variables: OSVersion: 10.1 Architecture: ARM64
description: is an optional property to specify details about the job, e.g., description: A test job for building a node application.
max_concurrency: defines max number of jobs that can be run concurrently, e.g. max_concurrency: 5
required_params: specifies list of parameter names that must be defined when submitting a job request, e.g., required_params: Name Age
cron_trigger: uses cron syntax to schedule the job at regular intervals, for example, the following job is set to run every minute: cron_trigger: 0 * * * * * *
skip_if: allows a job to skip execution based on a conditional logic using GO template, e.g. following condition will skip processing if git branch name is not main: skip_if: {{if ne .GitBranch "main"}} true {{end}}
retry: A job may be configured to attempt retries a certain number of times. For example, retry: 3
delay_between_retries: specifies the pause duration between each attempt. For instance, following setting specifies delay of 10 seconds between each retry: delay_between_retries: 10s
hard_reset_after_retries: When a job fails, only the failed tasks are executed. However, you can use hard_reset_after_retries so that all tasks are executed due to persisted failure, e.g.: hard_reset_after_retries: 3
timeout: defines the maximum time that a job can take for the execution and if the job takes longer, then it’s aborted, e.g., timeout: 5m
public_plugin: indicates the job is a public plugin so it can be shared by any other user in the system, e.g., public_plugin: true
sem_version: specifies a semantic version of the public plugin, e.g., sem_version: 1.2.5
tasks: defines an array of task definitions. The order of tasks is not important as formicary creates a graph based on dependencies between the tasks for execution.
5.1.2 Task Configuration
A task serves as a work segment carried out by an ant worker, encompassing the following attributes within its definition:
task_type: defines type or name of the task, e.g.: - task_type: lint-task
description: specifies details about the task, e.g.: description: This task verifies code quality with the lint tool.
method: defines executor to use for the task such as
DOCKER
KUBERNETES
SHELL
HTTP_GET
HTTP_POST_FORM
HTTP_POST_JSON
HTTP_PUT_FORM
HTTP_PUT_JSON
HTTP_DELETE
WEBSOCKET
MESSAGING
FORK_JOB
AWAIT_FORKED_JOB
EXPIRE_ARTIFACTS
on_completed: defines next task to run if task completes successfully, e.g.,: on_completed: build
on_failed: defines the next task to run if task fails, e.g.,: on_failed: cleanup
on_exit: is used to run the next task based on exit-code returned by the task, e.g., on_exit_code: 101: cleanup COMPLETED: deploy
environment: defines environment variables that will be available for commands that are executed, e.g.: environment: AWS_REGION: us-east-1
variables: define context property that can be used for scripts as template parameters or pass to the executors, e.g., variables: max-string-len: 50 service-name: myservice
after_script: is used to list commands that are executed after the main script regardless the main script succeeds or fails, e.g.: after_script: - echo cleaning up
before_script: is used to list commands that are executed before the main script, e.g.: before_script: - git clone https://{{.GithubToken}}@github.com/bhatti/go-cicd.git . - go mod vendor
timeout: defines the maximum time that a task can take for the execution otherwise it’s aborted, e.g.,: timeout: 5m
cache: allows caching for directories that store 3rd party dependencies, e.g., following example shows caching of pip dependencies so that they are not downloaded upon each execution: cache: key: cache-key paths: - .cache/pip - venv
retry: defines maximum attempts to execute a task if it fails, e.g.,: retry: 3
delay_between_retries: defines delay between a task retries, e.g.,: delay_between_retries: 10s
url: specifies URL to invoke for HTTP executor, e.g.,: method: HTTP_GET url: https://jsonplaceholder.typicode.com/todos/1
artifacts: defines list of files or directories that are persisted in the artifacts store and are available for dependent tasks or user download, e.g., artifacts: paths: - output.json
except: is used to skip task execution based on certain condition, e.g.: except: {{if ne .GitBranch "main" }} true {{end}}
allow_failure: defines the task is optional and can fail without failing entire job, e.g., allow_failure: true
allow_start_if_completed: Upon retry, only failed tasks are re-executed, but you can mark certain tasks to rerun previously completed task, e.g. allow_start_if_completed: true
always_run: A task can be marked as always_run so that they are run even when the job fails for cleanup purpose, e.g., always_run: true
tags: is used to route the task to a specific ant worker that supports given tags, e.g.,: tags: - Mac
webhook: configures a job to call an external webhook API upon completion of a job or task, e.g.: webhook: url: {{.WebhookURL}} headers: Authorization: Bearer {{.WebhookAuth}} query: task_key: task_value
services: allows starting sidecar container(s) with the given image, e.g.,: services: – name: redis image: redis:6.2.2-alpine ports: – number: 6379
notify: configure job to receive email or slack notifications when a job completes successfully or with failure, e.g., (Note: when parameter can take always, onSuccess, onFailure or never values): notify: email: recipients: – myemail@mydomain.cc when: always
fork_job_type / await_forked_tasks: allows spawning other related jobs or marketplace plugins from a job, which are run concurrently, e.g.: - task_type: fork-task method: FORK_JOB fork_job_type: child-job on_completed: fork-wait - task_type: fork-wait method: AWAIT_FORKED_JOB await_forked_tasks: - fork-task
EXPIRE_ARTIFACTS: method can be used to expire old artifacts, e.g.: - task_type: expire method: EXPIRE_ARTIFACTS
MESSAGING: implements a customized executor by subscribing to the messaging queue, e.g., - task_type: trigger method: MESSAGING messaging_request_queue: formicary-message-ant-request messaging_reply_queue: formicary-message-ant-response
5.1.3 GO Templates
The job and task definition supports GO templates, and you can use variables that are passed by job-request or task definitions, e.g.
Note: The configuration above supports OAuth 2.0 based authentication and allows enabling of the allocation of computing resource quotas per user. Furthermore, it supports setting up notifications through email and Slack.
You can then launch the server as follows:
docker-compose up
Once, the Formicary system starts up, you can use dashboard UI or API for managing jobs at the specified host and port.
5.2.3 Launching Ant Worker(s)
Here is an example docker-compose file designed to launch the ant-worker:
Above config shares config for the redis and minio so that ant workers can access queen server and store artifacts directly in the object-store. Here is a sample configuration for the ant worker:
Above kubernetes configuration assumes that you are running your kubernetes cluster at 192.168.1.120 and you can change it accordingly. You can then launch the worker as follows:
docker-compose -f ant-docker-compose.yaml up
6. Usage with Examples
The Formicary system can be utilized for running batch jobs, orchestrating workflows, or managing CI/CD pipelines. In this system, the execution parameters are detailed in a job configuration file. Each job outlines a Directed Acyclic Graph (DAG) that represents the sequence in which tasks should be executed, essentially mapping out the workflow or the execution trajectory for the tasks. Each task is defined as a discrete unit of work, capable of being executed through various executors such as DOCKER, KUBERNETES, HTTP, WEBSOCKET, SHELL, MESSAGING, among others.
6.1 Workload & Pipeline Processing
A pipeline encapsulates various stages of data processing, adaptable to numerous scenarios such as CI/CD pipelines in software development, ETL processes for data import/export, or other types of batch processing. The formicary facilitates these pipelines through the concept of tasks and jobs, where a task represents a single unit of work, and a job is a collection of tasks organized in a DAG. Tasks within a job are executed in sequence, with the execution order of subsequent tasks contingent on the exit status of the preceding task.
The following example illustrates a job definition for a straightforward pipeline where a video pipeline first validates input, downloads a mock video and then mock encodes it:
The above example kicks off video-encoding job and passes URL, InputEncoding, and OutputEncoding as parameters. You can then view status of the job using dashboard UI, e.g.,
video pipeline
Above UI also allows users to download artifacts generated by various tasks.
6.2 Parallel Workload & Pipeline Processing
You can then enhance workload & pipelines by adding multiple jobs that originate from the parent job and run concurrently in the background. For instance, a video-encoding job can achieve parallel video encoding by initiating multiple jobs as illustrated below:
Above definition defines validate and download tasks as before but split task splits video file into smaller video files that can be encoded in parallel. It then defines fork-encode1 and fork-encode2 tasks to fork child video-encoding job that was defined earlier and then wait for their completion in fork-await task. Finally, it combines output files into a single file. Following graph diagram shows the execution flow:
parallel video encoding
6.2.1 Fork Task
The task method with value of FORK_JOB spawns a child job where fork_job_type defines type of the job and variables define the input parameters to the job.
6.2.2 Waiting for completion of child jobs
The task method with value of AWAIT_FORKED_JOB waits for completion of child jobs where await_forked_tasks defines list of jobs to wait.
6.2.3 Uploading Job Definition
You can upload above pipeline job using API as follows:
The above example kicks off parallel-video-encoding job and passes URL, InputEncoding, and OutputEncoding as parameters.
6.3 CI/CD Pipelines
To implement CI/CD, you can create a job configuration and upload it to the server. The various stages of the build process, such as compilation, testing, and deployment, are represented by tasks within this job configuration. Organizations can use continuous integration to regularly integrating code changes into a shared repository where each integration is automatically built and tested, facilitating early detection of bugs and integration issues. Further continuous delivery and deployment automates the release of software to production, moving away from manual approvals and deployments. Here is a list of major features for supporting CI/CD pipelines in the Formicary system:
Artifacts management for any packages and binaries produced during the CI/CD pipeline or software deployment.
Job Parameters and Variables: Refer to the documentation on Variables and Request Parameters to set up job configuration variables and request parameters.
Environment Variables: Consult the section on Environment Variables to configure and access environment variables within your container.
Job / Organization Configs: For secure configurations at the job and organization level, see the Job / Organization Configs section.
Access Tokens for Source Code Repositories: Instructions for accessing source code repositories can be found in the relevant documentation.
Starting Jobs Manually: For manual job initiation, see the guide on Scheduling Jobs Manually. Jobs can be submitted as outlined there.
Scheduling Jobs for the Future: To schedule a job for a future time, refer to the Job Scheduling documentation.
Regular Interval Job Scheduling: For setting up jobs to run at regular intervals, see the Periodic Job Scheduling section.
GitHub Webhooks: Utilize GitHub webhooks for job scheduling as described in the GitHub-Webhooks documentation.
Post-Commit Hooks: For job scheduling using git post-commit hooks, consult the Post-commit hooks section.
Skipping Job Requests: To skip scheduled jobs, refer to the Job Skip documentation.
Following is an example of CI/CD pipeline for a simple GO project:
job_type: go-build-ci
max_concurrency: 1
# only run on main branch
skip_if: {{if ne .GitBranch "main"}} true {{end}}
tasks:
- task_type: build
method: DOCKER
working_dir: /sample
container:
image: golang:1.16-buster
before_script:
- git clone https://{{.GithubToken}}@github.com/bhatti/go-cicd.git .
- git checkout -t origin/{{.GitBranch}} || git checkout {{.GitBranch}}
- go mod download
- go mod vendor
script:
- echo branch {{.GitBranch}}, Commit {{.GitCommitID}}
- make build
after_script:
- ls -l
cache:
key_paths:
- go.mod
paths:
- vendor
on_completed: test
- task_type: test
method: DOCKER
container:
image: golang:1.16-buster
working_dir: /sample
environment:
GO111MODULE: on
CGO_ENABLED: 0
before_script:
- git clone https://{{.GithubToken}}@github.com/bhatti/go-cicd.git .
- git checkout -t origin/{{.GitBranch}} || git checkout {{.GitBranch}}
script:
- make test-coverage
after_script:
- ls -l
dependencies:
- build
on_completed: deploy
- task_type: deploy
method: DOCKER
container:
image: golang:1.16-buster
working_dir: /sample
before_script:
- git clone https://{{.GithubToken}}@github.com/bhatti/go-cicd.git .
- git checkout -t origin/{{.GitBranch}} || git checkout {{.GitBranch}}
script:
- make build
dependencies:
- test
Above job configuration demonstrates how different stages of build, test and deployment process can be defined with artifacts and vendor-cachings support.
6.3.1 Uploading Job Definition
You can upload above pipeline job using API as follows:
The above example kicks off go-build-ci job and passes GitCommitID, GitBranch, and GitMessage as parameters.
6.3.4 Github-Webhooks
See Github-Webhooks for scheduling above job with GitHub webhooks support.
6.3.5 PostCommit Hooks
See Post-commit hooks for scheduling above job using Git post-commit hooks.
6.4 ETL Jobs
Here is a sample ETL (Extract, Transform, Load) job that retrieves stock data, processes and extracts pricing information, and conducts calculations on the obtained data:
The above example kicks off etl-stock-job and passes Symbol as a parameter. You can then download results after the job execution.
6.5 Scanning Containers
6.5.1 Trivy
Trivy is a simple and comprehensive vulnerability/misconfiguration scanner for containers and other artifacts. Following example shows scanning a docker in docker (dind) using Trivy:
You can set up a job to automatically retry a failed task or the entire job up to a specified number of maximum attempts, incorporating a delay between each retry attempt as described below:
You can configure a job to timeout if it does not complete with the allowed duration as shown below:
job_type: test-job
timeout: 5m
...
6.6.7 On-Exit Task
Besides determining the subsequent task through on_completed or on_failed, you can employ on_exit to initiate the next task according to the exit code produced by the task. This exit code, distinct from the task’s status, is generated by the command specified in the script. It’s important to note that on_exit assigns specific exit codes for COMPLETED and FAILED, allowing you to consolidate all exit conditions in a single location, for example:
Following example shows how exit_codes with EXECUTING state can be used for polling tasks:
job_type: sensor-job
tasks:
- task_type: first
method: HTTP_GET
environment:
OLD_ENV_VAR: ijk
allow_failure: true
timeout: 15s
delay_between_retries: 5s
script:
{{ if lt .JobElapsedSecs 3 }}
- https://jsonplaceholder.typicode.com/blaaaaahtodos/1
{{ else }}
- https://jsonplaceholder.typicode.com/todos/1
{{ end }}
on_completed: second
on_exit_code:
404: EXECUTING
- task_type: second
container:
image: alpine
script:
- echo nonce {{.Nonce}}
- exit {{ Random 0 5 }}
on_exit_code:
1: FAILED
2: RESTART_JOB
3: COMPLETED
4: ERR_BLAH
5: RESTART_TASK
on_completed: third
- task_type: third
container:
image: alpine
environment:
OLD_ENV_VAR: ijk
script:
- date > date.txt
- env NEW_ENV_VAR=xyz
- echo variable value is $NEW_ENV_VAR
artifacts:
paths:
- date.txt
6.6.10 Formicary Plugins
A plugin represents a publicly accessible job definition that other jobs can utilize. It can encompass a range of functions, from security assessments to data evaluation and beyond. While any member within an organization can share a job definition, a public plugin enables the creation of a job that’s accessible to all users. Organizations can publish a plugin by creating a job definition that starts with the organization’s bundle prefix and includes a semantic version number, like 1.0 or 1.2.1, indicating its version. Here is an example plugin:
In Formicary, an executor abstracts the runtime environment needed for executing a task. The type of executor is specified through the use of a method. Formicary natively supports the following executor methods:
7.1 Shell Executor
The shell executor forks a shell process from the ant worker to run commands specified in the script section. This executor doesn’t need extra configuration; however, assigning a unique user with appropriate permissions to the ant worker is advisable to ensure security.
7.2 REST APIs
The REST API Executor triggers external HTTP APIs through actions such as GET, POST, PUT, or DELETE, for example:
job_type: http-job
tasks:
- task_type: get
method: HTTP_GET
url: https://jsonplaceholder.typicode.com/todos/1
on_completed: post
- task_type: post
method: HTTP_POST_JSON
url: https://jsonplaceholder.typicode.com/todos
on_completed: put
- task_type: put
method: HTTP_PUT_JSON
url: https://jsonplaceholder.typicode.com/todos/1
on_completed: delete
- task_type: delete
method: HTTP_DELETE
url: https://jsonplaceholder.typicode.com/todos/1
7.3 Websockets
The Websockets method enables browser-based or ant workers written in Python, Go, Java, and other languages to connect and carry out tasks, for example:
job_type: web-job
tasks:
- task_type: process
  method: WEBSOCKET
  tags:
    - web
    - js
The web or client uses websocket clients register with the server, e.g.
The Docker executor initiates a primary container, named after the job or task, to run the specified script, along with a secondary ‘helper’ container, designated by a ‘-helper’ suffix, to handle artifact management, e.g.,
The Kubernetes executor launches a primary container, which executes the script and is named according to the job or task, along with an auxiliary ‘helper’ container, identified by a ‘-helper’ suffix, for artifact management. Tasks can specify dependent services that are initiated with a ‘svc-‘ prefix, e.g.:
The Formicary is specially designed for executing background tasks, jobs, DAGs, and workflows in a complex, scalable environment. Each task represents a discrete unit of work that can be executed using a variety of protocols such as Docker, Kubernetes, Shell, HTTP, and Messaging. Its architecture employs a Leader-Follower model with a queen-leader that schedules tasks and ant-workers that execute them. It supports advanced patterns like Pipes and Filters, SEDA, and Fork/Join, enabling tasks to be interconnected, parallelized, and aggregated. Formicary distinguishes itself from other similar frameworks by supporting declarative job definitions, extensible execution, AuthN/AuthZ, artifacts management, quota management, caching and encryption, and advanced scheduling options including cron-based scheduling, task retries, and job prioritization, offer significant control over job execution. The resource management capabilities especially the dynamic allocation and monitoring of resources help to optimize task execution without overloading the system
Formicary‘s architecture supports a wide range of use cases from complex workflow orchestration across various environments to specific tasks like image processing pipelines, automated build/test/release workflows, scheduled data ETL jobs, and machine learning pipelines. Formicary supports advanced error handling and retry capabilities, essential for long-running and complex tasks. Its ability to handle complex, conditional workflows and scale according to demand makes it suitable for organizations with intricate processing requirements.
Multi-Factor Authentication (MFA) or 2FA allows multiple method of authentication to verify the user’s identity. The authentication factors generally include something the user has such as security token, something the user knows such as password/PIN/OTP, and something the user is such as biometrics. There are many means for MFA including:
SMS-Based Verification: delivers one-time password (OTP) via text message but it is vulnerable to SIM swapping, interception, and phishing attacks.
Push Notifications: provides more convenience but it is vulnerable for users to mistakenly approve malicious requests.
Hardware Security Keys (FIDO/U2F): offers more secure; resistant to phishing and man-in-the-middle attacks but requires carrying an additional device.
Biometrics: provides more convenient and secure authentication but can result in privacy and data security violations if implemented incorrectly.
In our implementation, we will use the FIDO (Fast Identity Online) standards, along with CTAP (Client to Authenticator Protocol) and WebAuthn (Web Authentication). FIDO includes specifications like UAF (Universal Authentication Framework) for passwordless authentication and U2F (Universal 2nd Factor) for second-factor authentication. FIDO2 is an extension of the original FIDO standards that includes the CTAP (Client to Authenticator Protocol) and WebAuthn (Web Authentication). CTAP allows external devices to act as authenticators and WebAuthn is a web standard developed by the W3C for secure and passwordless authentication on the web. FIDO/CTAP/WebAuthn uses public key cryptography where the private key never leaves the user’s device and only the public key is stored on the server. This greatly reduces the risk of private key compromise or maintaining shared secrets, which is a common vulnerability in traditional password-based systems. This approach further protects against common attack vectors such as phishing, man-in-the-middle attacks, and data breaches where password databases are compromised. The FIDO/CTAP/WebAuthn uses unique assertions for each login session and device attestation that makes it extremely difficult for attackers to use stolen credentials or to replay an intercepted authentication session. In short, FIDO and WebAuthn provides better security based on public key cryptography, more resistant to phishing attacks, and offers better user experience with cross-platform compatibility compared to other forms of multi-factor authentication.
Registering key with FIDO/WebAuthnMulti-factor Authenticating with FIDO/WebAuthn
Building Services and Web Client for Multi-Factor Authentication
Following implementation is based on my experience with building multi-factor authentication for PlexPass, which is an open source password manager. The PlexPass is built in Rust and provides web based UI along with CLI and REST APIs. In this implementation, the WebAuthn protocol is implemented using webauthn-rs library for multi-factor authentication. Here’s a general overview of how webauthn-rs can be added to a Rust application:
Add the Dependency:
First, you need to add webauthn-rs to your project’s Cargo.toml file:
[dependencies]
webauthn-rs = { version = "0.4", features = ["danger-allow-state-serialisation"] }
Configure the WebAuthn Environment:
You can then set up the WebAuthn environment with your application’s details, which includes the origin (the URL of your website), relying party name (your site’s name), and other configuration details as follows:
use webauthn_rs::prelude::*;

fn create_webauthn_config() -> WebauthnConfig {
    WebauthnConfigBuilder::new()
        .rp_name("My App".to_string())
        .rp_id("localhost") // Change for production
        .origin("https://localhost:8443") // Change for production
        .build()
        .unwrap()
}

let config = create_webauthn_config();
let webauthn = Webauthn::new(config);
WebAuthn should be integrated with your user account system and WebAuthn credentials should be associated user accounts upon registration and authentication. For example, here is a User object used by the PlexPass password manager:
pub struct User {
    // id of the user.
    pub user_id: String,
    // The username of user.
    pub username: String,
    ...

    // hardware keys for MFA via UI.
    pub hardware_keys: Option<HashMap<String, HardwareSecurityKey>>,
    // otp secret for MFA via REST API/CLI.
    pub otp_secret: String,

    // The attributes of user.
    pub attributes: Option<Vec<NameValue>>,
    pub created_at: Option<NaiveDateTime>,
    pub updated_at: Option<NaiveDateTime>,
}
Implementing Registration
When a user registers their device, first it will be registered and then associated with user account. Here is how PlexPass defines registration start method on the server side:
// Start MFA registration
async fn start_register_key(&self,
ctx: &UserContext,
) -> PassResult<CreationChallengeResponse> {
let user = self.user_repository.get(ctx, &ctx.user_id).await?;
// clear reg-state
self.hsm_store.set_property(&ctx.username, WEBAUTHN_REG_STATE, "")?;
// If the user has any other credentials, we exclude these here so they
// can't be duplicate registered.
// It also hints to the browser that only new credentials should be
// "blinked" for interaction.
let exclude_credentials = user.hardware_key_ids();
let (ccr, reg_state) = self.webauthn.start_passkey_registration(
Uuid::parse_str(&ctx.user_id)?, // user-id as UUID
&ctx.username, // internal username
&ctx.username, // display username
exclude_credentials)?;
// NOTE: We shouldn't sore reg_state in session because we are using cookies store.
// Instead, we will store HSM for safe storage.
let json_reg_state = serde_json::to_string(®_state)?;
self.hsm_store.set_property(&ctx.username, WEBAUTHN_REG_STATE, &json_reg_state)?;
Ok(ccr)
}
The above implementation first loads user object from the database and clears any previous state of device registration. The PlexPass uses secure storage such as Keychain on Mac for storing registration state and though you may store registration state in the session but you shouldn’t use it if the session is actually stored in a cookie as that will be exposed to remote clients. In addition, the registration method finds device-ids of all existing devices so that we don’t register same device more than once. It then returns CreationChallengeResponse, which is used by the Web UI to prompt user to insert the security key. Here is example response from the above registration challenge:
For example, here is how PlexPass registers MFA key on the client side:
async function registerMFAKey() {
    try {
        let response = await fetch('/ui/webauthn/register_start');
        let options = await response.json();

        // Convert challenge from Base64URL to Base64, then to Uint8Array
        const challengeBase64 = base64UrlToBase64(options.publicKey.challenge);
        options.publicKey.challenge = Uint8Array.from(atob(challengeBase64), c => c.charCodeAt(0));

        // Convert user ID from Base64URL to Base64, then to Uint8Array
        const userIdBase64 = base64UrlToBase64(options.publicKey.user.id);
        options.publicKey.user.id = Uint8Array.from(atob(userIdBase64), c => c.charCodeAt(0));

        // Convert each excludeCredentials id from Base64URL to ArrayBuffer
        if (options.publicKey.excludeCredentials) {
            for (let cred of options.publicKey.excludeCredentials) {
                cred.id = base64UrlToArrayBuffer(cred.id);
            }
        }

        // Create a new credential
        const newCredential = await navigator.credentials.create(options);

        // Prepare data to be sent to the server
        const credentialForServer = {
            id: newCredential.id,
            rawId: arrayBufferToBase64(newCredential.rawId),
            response: {
                attestationObject: arrayBufferToBase64(newCredential.response.attestationObject),
                clientDataJSON: arrayBufferToBase64(newCredential.response.clientDataJSON)
            },
            type: newCredential.type
        };

        // Send the new credential to the server for verification and storage
        response = await fetch('/ui/webauthn/register_finish', {
            method: 'POST',
            headers: {'Content-Type': 'application/json'},
            body: JSON.stringify(credentialForServer)
        });
        let savedKey = await response.json();
        ...
    } catch (err) {
        console.error('Error during registration:', err);
    }
}
Note: The webauthn-rs library sends data in the Base64-URL format instead of Base64 so the javascript code provides conversion. Here is an example of the transformation logic:
function arrayBufferToBase64(buffer) {
    let binary = '';
    let bytes = new Uint8Array(buffer);
    let len = bytes.byteLength;
    for (let i = 0; i < len; i++) {
        binary += String.fromCharCode(bytes[i]);
    }
    return window.btoa(binary);
}

function base64UrlToBase64(base64Url) {
    // Replace "-" with "+" and "_" with "/"
    let base64 = base64Url.replace(/-/g, '+').replace(/_/g, '/');
    // Pad with "=" to make the length a multiple of 4 if necessary
    while (base64.length % 4) {
        base64 += '=';
    }
    return base64;
}

function base64UrlToArrayBuffer(base64url) {
    var padding = '='.repeat((4 - base64url.length % 4) % 4);
    var base64 = (base64url + padding)
        .replace(/\-/g, '+')
        .replace(/_/g, '/');

    var rawData = window.atob(base64);
    var outputArray = new Uint8Array(rawData.length);

    for (var i = 0; i < rawData.length; ++i) {
        outputArray[i] = rawData.charCodeAt(i);
    }
    return outputArray.buffer;
}
The Web client in above example asks user to insert the security key and then sends attestation to the server. For example, here is screenshot in PlexPass application for prompting user to add security key:
The server side then verifies attestation and then adds security key so that user can be prompted to insert security key upon authentication. Here is how PlexPass defines registration finish method on the server side:
// Finish MFA registration ad returns user
async fn finish_register_key(&self,
ctx: &UserContext,
key_name: &str,
req: &RegisterPublicKeyCredential,
) -> PassResult<HardwareSecurityKey> {
let reg_state_str = self.hsm_store.get_property(&ctx.username, WEBAUTHN_REG_STATE)?;
if reg_state_str.is_empty() {
return Err(PassError::authentication("could not find webauthn registration key"));
}
let reg_state: PasskeyRegistration = serde_json::from_str(®_state_str)?;
self.hsm_store.set_property(&ctx.username, WEBAUTHN_REG_STATE, "")?;
let sk = self.webauthn.finish_passkey_registration(req, ®_state)?;
let mut user = self.user_repository.get(ctx, &ctx.user_id).await?;
let hardware_key = user.add_security_key(key_name, &sk);
self.user_repository.update(ctx, &user).await?;
Ok(hardware_key)
}
In above example, the server side extracts registration state from Keychain and then invokes finish_passkey_registration of webauthn-rs library using registration state and client side attestation. The hardware keys are then added to the user object and saved in the database. PlexPass encrypts user object in the database based on user’s password so all security keys are safeguarded against unauthorized access.
Fallback Mechanisms
When registering security keys for multi-factor authentication, it’s recommended to implement fallback authentication methods for scenarios where the user’s security key is unavailable. For example, PlexPass generates a recovery code that can be used to reset multi-factor authentication in case the security key is lost as displayed below:
Implementing Authentication
When a user attempts to log in, the server side recognizes that user has configured multi-facor authentication, generate an authentication challenge and then directed to a web page to prompt user to insert the security key. Here is how PlexPass defines authentication start authentication method on the server side:
    // Start authentication with MFA
    async fn start_key_authentication(&self,
                                      ctx: &UserContext,
    ) -> PassResult<RequestChallengeResponse> {
        // clear reg-state
        self.hsm_store.set_property(&ctx.username, WEBAUTHN_AUTH_STATE, "")?;
        let user = self.user_repository.get(ctx, &ctx.user_id).await?;

        let allow_credentials = user.get_security_keys();
        if allow_credentials.is_empty() {
            return Err(PassError::authentication("could not find webauthn keys"));
        }

        let (rcr, auth_state) = self.webauthn
            .start_passkey_authentication(&allow_credentials)?;

        // Note: We will store auth-state in HSM as we use cookie-store for session.
        let json_auth_state = serde_json::to_string(&auth_state)?;
        self.hsm_store.set_property(&ctx.username, WEBAUTHN_AUTH_STATE, &json_auth_state)?;

        Ok(rcr)
    }
In above example, the server side loads user object from the database, extracts security keys, and uses start_passkey_authentication method of webauthn-rs library to create authentication challenge.
Note: The server side saves authentication state in secure storage similar to the registration state so that it’s safeguarded against unauthorized access.
Client-Side Authentication
The client side prompts user to insert the key with following Javascript code:
async function signinMFA(options) {
    try {
        // Convert challenge from Base64URL to ArrayBuffer
        options.publicKey.challenge = base64UrlToArrayBuffer(options.publicKey.challenge);

        // Convert id from Base64URL to ArrayBuffer for each allowed credential
        if (options.publicKey.allowCredentials) {
            for (let cred of options.publicKey.allowCredentials) {
                cred.id = base64UrlToArrayBuffer(cred.id);
            }
        }

        // Request an assertion
        const assertion = await navigator.credentials.get(options);

        console.log(JSON.stringify(assertion))
        // Send the assertion to the server for verification
        let response = await doFetch('/ui/webauthn/login_finish', {
            method: 'POST',
            headers: {'Content-Type': 'application/json'},
            body: JSON.stringify(assertion)
        });
      ...
    } catch (err) {
        console.error('Error during authentication:', err);
    }
}
The authentication options from the server looks like:
The server then verifies signed challenge to authenticate the user. Here is an example of authentication business logic based on PlexPass application:
    // Finish MFA authentication
    async fn finish_key_authentication(&self,
                                       ctx: &UserContext,
                                       session_id: &str,
                                       auth: &PublicKeyCredential) -> PassResult<()> {
        let auth_state_str = self.hsm_store.get_property(&ctx.username, WEBAUTHN_AUTH_STATE)?;
        if auth_state_str.is_empty() {
            return Err(PassError::authentication("could not find webauthn auth key"));
        }
        self.hsm_store.set_property(&ctx.username, WEBAUTHN_AUTH_STATE, "")?;
        let auth_state: PasskeyAuthentication = serde_json::from_str(&auth_state_str)?;

        let auth_result = self.webauthn.finish_passkey_authentication(auth, &auth_state)?;
        let mut user = self.user_repository.get(ctx, &ctx.user_id).await?;

        user.update_security_keys(&auth_result);
        self.user_repository.update(ctx, &user).await?;
        let _session = self.login_session_repository.mfa_succeeded(&ctx.user_id, session_id)?;
        Ok(())
    }
The server side loads authentication state from secure storage and user object from the database. It then uses finish_passkey_authentication method of webauthn-rs library to validate signed challenge and updates user object and user-session so that user can proceed with full access to the application.
Multi-Factor Authentication with Command-Line and REST APIs
The PlexPass password manager uses Time-based One-Time Passwords (TOTP) for adding multi-factor authentication to the command-line access and REST APIs. This also means that users can reset security keys using CLI and APIs with the recovery code. A base32 based TOTP code is automatically generated when a user registers, which is accessible via WebUI, CLI or REST APIs. Here is an example of using multi-factor authentication with CLI:
In summary, FIDO, CTAP, and WebAuthn represent a major leap forward in Multi-Factor Authentication (MFA), effectively addressing several vulnerabilities of traditional authentication methods. These protocols bolster security using cryptographic techniques and minimize the reliance on shared secrets, enhancing both security and user experience. However, a notable gap exists in readily available resources and comprehensive examples, particularly in integrating these standards. This gap was evident when I incorporated MFA into the PlexPass password manager using the webauthn-rs Rust library. While it offered server-side sample code, the absence of corresponding client-side JavaScript examples posed a lot of challenges for me. By sharing my experiences and learnings, I hope to facilitate wider adoption of FIDO/CTAP/WebAuthn standards, given their superior security capabilities.
Caching is often considered a “silver bullet” in software development due to its immediate and significant impact on the performance and scalability of applications. The benefits of caching include:
Immediate Performance Gains: Caching can drastically reduce response times by storing frequently accessed data in memory, avoiding the need for slower database queries.
Reduced Load on Backend Systems: By serving data from the cache particularly during traffic spikes, the load on backend services and databases is reduced, leading to better performance and potentially lower costs.
Improved User Experience: Faster data retrieval leads to a smoother and more responsive user experience, which is crucial for customer satisfaction and retention.
Scalability: Caching can help an application scale by handling increased load by distributing it across multiple cache instances without a proportional increase in backend resources.
Availability: In cases of temporary outages or network issues, a cache can serve stale data, enhancing system availability.
However, implementing cache properly requires understanding many aspects such as caching strategies, caching locality, eviction policies and other challenges that are described below:
1. Caching Strategies
Following is a list of common caching strategies:
1.1 Cache Aside (Lazy Loading)
In a cache-aside strategy, data is loaded into the cache only when needed, in a lazy manner. Initially, the application checks the cache for the required data. In the event of a cache miss, it retrieves the data from the database or another data source and subsequently fills the cache with the response from the data server. This approach is relatively straightforward to implement and prevents unnecessary cache population. However, it places the responsibility of maintaining cache consistency on the application and results in increased latencies and cache misses during the initial access.
cache-aside
use std::collections::HashMap;

let mut cache = HashMap::new();
let key = "data_key";

if !cache.contains_key(key) {
    let data = load_data_from_db(key); // Function to load data from the database
    cache.insert(key, data);
}

let result = cache.get(key);
1.2 Read-Through Cache
In this strategy, the cache sits between the application and the data store. When a read occurs, if the data is not in the cache, it is retrieved from the data store and then returned to the application while also being stored in the cache. This approach simplifies application logic for cache management and cache consistency. However, initial reads may lead to higher latencies due to cache misses and cache may store unused data.
read-through cache
fn get_data(key: &str, cache: &mut HashMap<String, String>) -> String {
    cache.entry(key.to_string()).or_insert_with(|| {
        load_data_from_db(key) // Load from DB if not in cache
    }).clone()
}
1.3 Write-Through Cache
In this strategy, data is written into the cache, which then updates the data store simultaneously. This ensures data consistency and provides higher efficiency for write-intensive applications. However, it may cause higher latency due to synchronously writing to both cache and the data store.
write-through cache
fn write_data(key: &str, value: &str, cache: &mut HashMap<String, String>) {
    cache.insert(key.to_string(), value.to_string());
    write_data_to_db(key, value); // Simultaneously write to DB
}
1.4 Write-Around Cache
In this strategy, data is written directly to the data store, bypassing the cache. This approach is used to prevent the cache from being flooded with write-intensive operations and provides higher performance for applications that require less frequent reads. However, it may result in higher read latencies due to cache misses.
In this approach, data is first written to the cache and then, after a certain interval or condition, written to the data store. This reduces the latency of write operations and load on the data store. However, it may result in data loss if cache fails before the data is persisted in the data store. In addition, it adds more complexity to ensure data consistency and durability.
write-behind cache
use std::collections::HashMap;
use std::thread;
use std::time::Duration;

fn write_data(key: &str, value: &str, cache: &mut HashMap<String, String>) {
    cache.insert(key.to_string(), value.to_string());

    // An example of asynchronous write to data store.
    thread::spawn(move || {
        thread::sleep(Duration::from_secs(5)); // Simulate delayed write
        write_data_to_db(key, value);
    });
}
1.6 Comparison of Caching Strategies
Following is comparison summary of above caching strategies:
Performance: Write-back and write-through provide good performance for write operations but at the risk of data consistency (write-back) or increased latency (write-through). Cache-aside and read-through are generally better for read operations.
Data Consistency: Read-through and write-through are strong in maintaining data consistency, as they ensure synchronization between the cache and the data store.
Complexity: Cache-aside requires more application-level management, while read-through and write-through can simplify application logic but may require more sophisticated cache solutions.
Use Case Suitability: The choosing right caching generally depends on the specific needs of the application, such as whether it is read or write-intensive, and the tolerance of data consistency versus performance.
2. Cache Eviction Strategies
Cache eviction strategies are crucial for managing cache memory, especially when the cache is full and new data needs to be stored. Here are some common cache eviction strategies:
2.1 Least Recently Used (LRU)
LRU removes the least recently accessed items first with assumption that items accessed recently are more likely to be accessed again. This is fairly simple and effective strategy but requires tracking access times and may not be suitable for some use-cases.
2.2 First In, First Out (FIFO)
FIFO evicts the oldest items first, based on when they were added to the cache. This strategy is easy to implement and offers a fair strategy by assigning same lifetime to each item. However, it does not account for frequency or recency of the item in cache so it may lead to lower cache hit rate.2.3
2.3 Least Frequently Used (LFU)
LFU removes items that are used least frequently by counting how often an item is accessed. It is useful for use-cases where some items are accessed more frequently but requires tracking frequency of access.
2.4 Random Replacement (RR)
RR randomly selects a cache item to evict. This method is straightforward to implement but it may remove important frequently or recently used items, leading to a lower hit rate and unpredictability of cache performance.
2.5 Time To Live (TTL)
In this strategy, items are evicted based on a predetermined time-to-live. After an item has been in the cache for the specified duration, it is automatically evicted. It is useful for data that becomes stale after a certain period but it does not consider item’s access frequency or recency.
2.6 Most Recently Used (MRU)
It is opposite of LRU and evicts the most recently used items. It may be effective for certain use-cases but leads to poor performance for most common use-cases.
and does not require keeping track of access patterns.
2.7 Comparison of Cache Eviction Strategies
Adaptability: LRU and LFU are generally more adaptable to different access patterns compared to FIFO or RR.
Complexity vs. Performance: LFU and LRU tend to offer better cache performance but are more complex to implement. RR and FIFO are simpler but might not offer optimal performance.
Specific Scenarios: The choosing right eviction strategy generally depends on the specific access patterns of the application.
3. Cache Consistency
Cache consistency refers to ensuring that all copies of data in various caches are the same as the source of truth. Keeping data consistent across all caches can incur significant overhead, especially in distributed environments.There is often a trade-off between consistency and latency; stronger consistency can lead to higher latency. Here is list of other concepts related to cache consistency:
3.1 Cache Coherence
Cache coherence is related to consistency but usually refers to maintaining a uniform state of cached data in a distributed system. Maintaining cache coherence can be complex and resource-intensive due to communication between nodes and requires proper concurrency control to handle concurrent read/write operations.
3.2 Cache Invalidation
Cache invalidation involves removing or marking data in the cache as outdated when the corresponding data in the source changes. Invalidation can become complicated if cached objects have dependencies or relationships. Other tradeoffs include deciding whether to invalidate cache entries that may lead to cache misses or update them in place, which may be more complex.
3.3 Managing Stale Data
Stale data occurs when cached data is out of sync with the source. Managing stale data involves strategies to minimize the time window during which stale data might be served. Different data might have different rates of change, requiring varied approaches to managing staleness.
3.4 Thundering Herd Problem
The thundering herd problem occurs when many clients try to access a cache item that has just expired or been invalidated, causing all of them to hit the backend system simultaneously. A variant of this problem is the cache stampede, where multiple processes attempt to regenerate the cache concurrently after a cache miss.
3.5 Comparison of Cache Consistency Approaches
Write Strategies: Write-through vs. write-back caching impact consistency and performance differently. Write-through improves consistency but can be slower, while write-back is faster but risks data loss and consistency issues.
TTL and Eviction Policies: Time-to-live (TTL) settings and eviction policies can help manage stale data but require careful tuning based on data access patterns.
Distributed Caching Solutions: Technologies like distributed cache systems (e.g., Redis, Memcached) offer features to handle these challenges but come with their own complexities.
Event-Driven Invalidation: Using event-driven architectures to trigger cache invalidation can be effective but requires a well-designed message system.
4. Cache Locality
Cache locality refers to how data is organized and accessed in a cache system, which can significantly impact the performance and scalability of applications. There are several types of cache locality, each with its own set of tradeoffs and considerations:
4.1 Local/On-Server Caching
Local caching refers to storing data in memory on the same server or process that is running the application. It allows fast access to data as it doesn’t involve network calls or external dependencies. However, the cache size is limited by the server’s memory capacity and it is difficult to maintain consistency in distributed systems since each instance has its own cache without shared state. Other drawbacks include coldstart due to empty cache on server restart and lack of BulkHeads barrier because it takes memory away from the application server, which may cause application failure.
4.2 External Caching
External caching involves storing data on a separate server or service, such as Redis or Memcached. It can handle larger datasets as it’s not limited by the memory of a single server and offers shared state for multiple instances in distributed system. However, it is slower than local caching due to network latency and requires managing and maintaining separate caching infrastructure. Another drawback is that unavailability of external cache can result in higher load on the datastore and may cause cascading failure.
4.3 Inline Caching
Inline caching embeds caching logic directly in the application code, where data retrieval occurs. A key difference between inline and local caching is that local caching focuses on the cache being in the same physical or virtual server, while inline caching emphasizes the integration of cache logic directly within the application code. However, inline caching can make the application code more complex, tightly coupled and harder to maintain.
4.4 Side Caching
Side caching involves a separate service or layer that the application interacts with for cached data, often implemented as a microservice. It separates caching concerns from application logic. However, it requires managing an additional component. It differs from external caching as external caching is about a completely independent caching service that can be used by multiple different applications.
4.5 Combination of Local and External Cache
When dealing with the potential unavailability of an external cache, which can significantly affect the application’s availability and scalability as well as the load on the dependent datastore, a common approach is to integrate external caching with local caching. This strategy allows the application to fall back to serving data from the local cache, even if it might be stale, in case the external cache becomes unavailable. This requires setting maximum threshold for serving stale data besides setting expiration TTL for the item. Additionally, other remediation tactics such as load shedding and request throttling can be employed.
4.5 Comparison of Cache Locality
Performance vs. Scalability: Local caching is faster but less scalable, while external caching scales better but introduces network latency.
Complexity vs. Maintainability: Inline caching increases application complexity but offers precise control, whereas side caching simplifies the application but requires additional infrastructure management.
Suitability: Local and inline caching are more suited to applications with specific, high-performance requirements and simpler architectures. In contrast, external and side caching are better for distributed, scalable systems and microservices architectures.
Flexibility vs. Control: External and side caching provide more flexibility and are easier to scale and maintain. However, they offer less control over caching behavior compared to local and inline caching.
5. Monitoring, Metrics and Alarms
Monitoring a caching system effectively requires tracking various metrics to ensure optimal performance, detect failures, and identify any misbehavior or inefficiencies. Here are key metrics, monitoring practices, and alarm triggers that are typically used for caching systems:
5.1 Key Metrics for Caching Systems
Hit Rate: The percentage of cache read operations that were served by the cache.
Miss Rate: The percentage of cache read operations that required a fetch from the primary data store.
Eviction Rate: The rate at which items are removed from the cache.
Latency: Measures the time taken for cache read and write operations.
Cache Size and Usage: Monitoring the total size of the cache and how much of it is being used helps in capacity planning and detecting memory leaks.
Error Rates: The number of errors encountered during cache operations.
Throughput: The number of read/write operations handled by the cache per unit of time.
Load on Backend/Data Store: Measures the load on the primary data store, which can decrease with effective caching.
5.2 Monitoring and Alarm Triggers
By continuously monitoring, alerts can be configured for critical metrics thresholds, such as very low hit rates, high latency, or error rates exceeding a certain limit. These metrics help with capacity planning by observing high eviction rates along with a high utilization of cache size. Alarm can be triggered if error rates spike suddenly. Similarly, a significant drop in hit rate might indicate cache inefficiency or changing data access patterns.
6. Other Caching Considerations
In addition to the caching strategies, eviction policies, and data locality discussed earlier, there are several other important considerations that need special attention when designing and implementing a caching system:
6.1 Concurrency Control
A reliable caching approach requires handling simultaneous read and write operations in a multi-threaded or distributed environment while ensuring data integrity and avoiding data races.
6.2 Fault Tolerance and Recovery
The caching system should be resilient to failures and should be easy to recover from hardware or network failures without significant impact on the application.
6.3 Scalability
As demand increases, the caching system should scale appropriately. This could involve scaling out (adding more nodes) or scaling up (adding resources to existing nodes).
6.3 Security
When caching sensitive data, security aspects such as encryption, access control, and secure data transmission become critical.
6.4 Ongoing Maintenance
The caching system requires ongoing maintenance and tweaking based on monitoring cache hit rates, performance metrics, and operational health.
6.5 Cost-Effectiveness
The cost of implementing and maintaining the caching system should be weighed against the performance and scalability benefits it provides.
6.6 Integration with Existing Infrastructure
The caching solution requires integration the existing technology stack, thus it should not require extensive changes to current systems.
6.7 Capacity Planning
The caching solution proper planning regarding the size of the cache and hardware resources based on monitoring eviction rates, latency and operational health.
6.8 Cache Size
Cache size plays a critical role in the performance and scalability of applications. A larger cache can store more data, potentially increasing the likelihood of cache hits. However, this relationship plateaus after a certain point; beyond an optimal size, the returns in terms of hit rate improvement diminish. While a larger cache can reduce the number of costly trips to the primary data store but too large cache can increase lookup cost and consume more memory. Finding optimal cache size requires careful analysis of the specific use case, access patterns, and the nature of the data being cached.
6.9 Encryption
For sensitive data, caches may need to implement encryption, which can add overhead and complexity.
6.10 Data Volatility
Highly dynamic data might not benefit as much from caching or may require frequent invalidation, impacting cache hit rates.
6.11 Hardware
The underlying hardware (e.g., SSDs vs. HDDs, network speed) can significantly impact the performance of external caching solutions.
6.12 Bimodal Behavior
The performance of caching can vary significantly between hits and misses, leading to unpredictable performance (bimodal behavior).
6.13 Cache Warming
In order to avoid higher latency for first time due to cache misses, applications may populate the cache with data before it’s needed, which can add additional complexity especially determining what data to preload.
6.14 Positive and Negative Caching
Positive caching involves storing the results of successful query responses. On the other hand, negative caching involves storing the information about the non-existence or failure of a requested data. Negative caching can be useful if a client is misconfigured to access non-existing data, which may result in higher load on the data source. It is critical to set an appropriate TTL (time-to-live) for negative cache entries so that it doesn’t delay the visibility of new data; too short. In addition, negative caching requires timely cache invalidation to handle changes in data availability.
6.15 Asynchronous Cache Population and Background Refresh
Asynchronous cache population involves updating or populating the cache in a non-blocking manner. Instead of the user request waiting for the cache to be populated, the data is fetched and stored in the cache asynchronously. Background refresh periodically refreshing cached data in the background before it becomes stale or expires. This allows system to handle more requests as cache operations do not block user requests but it adds more complexity for managing the timing and conditions under which the cache is populated asynchronously.
6.16 Prefetching and Cache Warming
Prefetching involves loading data into the cache before it is actually requested, based on predicted future requests so that overall system efficiency is improved. Cache warming uses the process of pre-loading to populate the data immediately after the cache is created or cleared.
6.17 Data Format and Serialization
When using an external cache in a system that undergoes frequent updates, data format and serialization play a crucial role in ensuring compatibility, particularly for forward and backward-compatible changes. The choice of serialization format (e.g., JSON, XML, Protocol Buffers) can impact forward and backward compatibility. Incorrect handling of data formats can lead to corruption, especially if an older version of an application cannot recognize new fields or different data structures upon rollbacks. The caching system is recommended to include a version number in the cached data schema, testing for compatibility, clearing or versioning cache on rollbacks, and monitoring for errors.
6.18 Cache Stampede
This occurs when a popular cache item expires, and numerous concurrent requests are made for this data, causing a surge in database or backend load.
6.19 Memory Leaks
Improper management of cache size can lead to memory leaks, where the cache keeps growing and consumes all available memory.
6.20 Cache Poisoning
In cases where the caching mechanism is not well-secured, there’s a risk of cache poisoning, where incorrect or malicious data gets cached. This can lead to serving inappropriate content to users or even security breaches.
6.21 Soft and Hard TTL with Periodic Refresh
If a periodic background refresh meant to update a cache fails to retrieve data from the source, there’s a risk that the cache may become invalidated. However, there are scenarios where serving stale data is still preferable to having no data. In such cases, implementing two distinct TTL (Time To Live) configurations can be beneficial: a ‘soft’ TTL, upon which a refresh is triggered without invalidating the cache, and a ‘hard’ TTL, which is longer and marks the point at which the cache is actually invalidated.
7. Production Outages
Due to complexity of managing caching systems, it can also lead to significant production issues and outages when not implemented or managed correctly. Here are some notable examples of outages or production issues caused by caching:
7.1 Public Outages
In 2010, Facebook experienced a notable issue where an error in their caching layer caused the site to slow down significantly. This problem was due to cache stampede where a feedback loop created in their caching system, which led to an overload of one of their databases.
In 2017, GitLab once faced an incident where a cache invalidation problem caused users to see wrong data. The issue occurred due to the caching of incorrect user data, leading to a significant breach of data privacy as users could view others’ private repositories.
In 2014, Reddit has experienced several instances of downtime related to its caching layer. In one such instance, an issue with the caching system led to an outage where users couldn’t access the site.
In 2014, Microsoft Azure’s storage service faced a significant outage, which was partly attributed to a caching bug introduced in an update. The bug affected the Azure Storage front-ends and led to widespread service disruptions.
7.2 Work Projects
Following are a few examples of caching related problems that I have experienced at work:
Caching System Overload Leading to Downtime: In one of the cloud provider system at work, we experienced an outage because the caching infrastructure was not scaled to handle sudden spikes in traffic and the timeouts for connecting to the caching server was set too high. This led to high request latency and cascading failure that affected the entire application.
Memory Leak in Caching Layer: When working at a retail trading organization that cached quotes used an embedded caching layer, which had a memory leak that led to server crash and was fixed by periodic server bounce because the root cause couldn’t be determined due to a huge monolithic application.
Security and Encryption: Another system at work, we cached credentials in an external cache, which were stored without any encryption and exposed an attack vector to execute actions on behalf of customers. This was discovered during a different caching related issue and the system removed the use of external cache.
Cache Poisoning with Delayed Visibility: In one of configuration system that employed caching with very high expiration time, an issue arose when an incorrect configuration was deployed. The error in the new configuration was not immediately noticed because the system continued to serve the previous, correct configuration from the cache due to its long expiration period.
Rollbacks and Patches: In one of system, a critical update was released to correct erroneous graph data, but users continued to encounter the old graphs because the cached data could not be invalidated.
BiModal Logic: Implementing an application-based caching strategy introduces the necessity to manage cache misses and cache hydration. This addition creates a bimodal complexity within the system, characterized by varying latency. Moreover, such a strategy can obscure issues like race conditions and data-store failures, making them harder to detect and resolve.
Thundering Herd and Cache Stampede: In a number of systems, I have observed a variant of thundering herd and cache stampede problems where a server restart cleared all cache that caused cold cache problem, which then turns into thundering herd when clients start making requests.
Unavailability of Caching servers: In several systems that depend on external caching, there have been instances of performance degradation observed when the caching servers either become unavailable or are unable to accommodate the demand from users.
Stale Data: In one particular system, an application was using an deprecated client library for an external caching server. This older version of the library erroneously returned expired data, instead of properly expiring it in the cache. To address this issue, timestamps were added to the cached items, allowing the application to effectively identify and handle stale data.
Load and Performance Testing: During load or performance testing, I’ve noticed that caching was not factored into the process, which obscured important metrics. Therefore, it’s critical to either account for the cache’s impact or disable it during testing, especially when the objective is to accurately measure requests to the underlying data source.
Summary
In summary, caching stands out as an effective method to enhance performance and scalability, yet it demands thoughtful strategy selection and an understanding of its complexities. The approach must navigate challenges such as maintaining data consistency and coherence, managing cache invalidation, handling the complexities of distributed systems, ensuring effective synchronization, and addressing issues related to stale data, warm-up periods, error management, and resource utilization. Tailoring caching strategies to fit the unique requirements and constraints of your application and infrastructure is crucial for its success.
Effective cache management, precise configuration, and rigorous testing are pivotal, particularly in expansive, distributed systems. These practices play a vital role in mitigating risks commonly associated with caching, such as memory leaks, configuration errors, overconsumption of resources, and synchronization hurdles. In short, caching should be considered as a solution only when other approaches are inadequate, and it should not be hastily implemented as a fix at the first sign of performance issues without a thorough understanding of the underlying cause. It’s crucial to meticulously evaluate the potential challenges mentioned previously before integrating a caching layer, to genuinely enhance the system’s efficiency, scalability, and reliability.
With the proliferation of online services and accounts, it has become almost impossible for users to remember unique and strong passwords for each of them. Some users use the same password across multiple accounts, which is risky because if one account is compromised, all other accounts are at risk. With increase of cyber threats such as 2022-Morgan-Stanley, 2019-Facebook, 2018-MyFitnessPal, 2019-CapitalOne, more services demand stronger and more complex passwords, which are harder to remember. Standards like FIDO (Fast IDentity Online), WebAuthn (Web Authentication), and Passkeys aim to address the problems associated with traditional passwords by introducing stronger, simpler, and more phishing-resistant user authentication methods. These standards mitigate Man-in-the-Middle attacks by using decentralized on-device authentication. Yet, their universal adoption remains a work in progress. Until then, a popular alternative for dealing with the password complexity is a Password manager such as LessPass, 1Password, and Bitwarden, which offer enhanced security, convenience, and cross-platform access. However, these password managers are also prone to security and privacy risks especially and become a single point of failure when they store user passwords in the cloud. As password managers may also store other sensitive information such as credit card details and secured notes, the Cloud-based password managers with centralized storage become high value target hackers. Many cloud-based password managers implement additional security measures such as end-to-end encryption, zero-knowledge architecture, and multifactor authentication but once hackers get access to the encrypted password vaults, they become vulnerable to sophisticated encryption attacks. For example, In 2022, LastPass, serving 25 million users, experienced significant security breaches. Attackers accessed a range of user data, including billing and email addresses, names, telephone numbers, and IP addresses. More alarmingly, the breach compromised customer vault data, revealing unencrypted website URLs alongside encrypted usernames, passwords, secure notes, and form-filled information. The access to the encrypted vaults allow “offline attacks” for password cracking attempts that may use powerful computers for trying millions of password guesses per second. In another incident, LastPass users were locked out of their accounts due to MFA reset after a security upgrade. In order to address these risks with cloud-based password managers, we have built a secured family-friendly password manager named “PlexPass” with an enhanced security and ease of use including multi-device support for family members but without relying on storing data in cloud.
1.0 Design Tenets and Features
The PlexPass is designed based on following tenets and features:
End-to-End Encryption: All data is encrypted using strong cryptographic algorithms. The decryption key will be derived from the user’s master password.
Zero-Knowledge Architecture: The password manager won’t have the ability to view the decrypted data unless explicitly instructed by the user.
No Cloud: It allows using the password manager to be used as a local command-line tool or as a web server for local hosting without storing any data in the cloud.
Great User Experience: It provides a great user-experience based on a command-line tool and a web-based responsive UI that can be accessed by local devices.
Strong Master Password: It encourages users to create a robust and strong master password.
Secure Password Generation: It allows users to generate strong, random passwords for users, reducing the temptation to reuse passwords.
Password Strength Analyzer: It evaluates the strength of stored passwords and prompt users to change weak or repeated ones.
Secure Import and Export: It allows users to import and export password vault data in a standardized, encrypted format so that users can backup and restore in case of application errors or device failures.
Data Integrity Checks: It verifies the integrity of the stored data to ensure it hasn’t been tampered with.
Version History: It stores encrypted previous versions of entries, allowing users to revert to older passwords or data if necessary.
Open-Source: The PlexPass is open-source so that the community can inspect the code, which can lead to the identification and rectification of vulnerabilities.
Regular Updates: It will be consistently updated to address known vulnerabilities and to stay aligned with best practices in cryptographic and security standards.
Physical Security: It ensures the physical security of the device where the password manager is installed, since the device itself becomes a potential point of vulnerability.
Data Breach Notifications: It allows uses to scan passwords with known breached password hashes (without compromising privacy) that may have been leaked in data breaches.
Multi-Device and Sharing: As a family-friendly password manager, PlexPass allows sharing passwords safely to the nearby trusted devices without the risks associated with online storage.
Clipboard Protection: It offers mechanisms like clearing the clipboard after a certain time to protect copied passwords.
Tagging and Organization: It provides users with the ability to organize entries using tags, categories, or folders for a seamless user experience.
Secure Notes: It stores encrypted notes and additional form-filled data.
Search and Filter Options: It provides intuitive search and filter capabilities.
Multi-Factor and Local Authentication: PlexPass supports MFA based on One-Time-Password (OTP), FIDO and WebAuthN for local authentication based on biometrics and multi-factor authentication based on hardware keys such as Yubikey.
Use Argon2 (winner of the 2015 Password Hashing Competition) with an iteration count of 2, and 1 degree of parallelism (if not available then use scrypt with cost parameter of (2^17), a minimum block size of 8, and a parallelization parameter of 1).
For FIPS-140 compliance, it recommends PBKDF2 with work factor of 600,000+ and with an internal hash function of HMAC-SHA-256. Other settings include:
PBKDF2-HMAC-SHA1: 1,300,000 iterations
PBKDF2-HMAC-SHA256: 600,000 iterations
PBKDF2-HMAC-SHA512: 210,000 iterations
Consider using a pepper to provide additional defense in depth.
Many of the popular password managers fall short of these standards but PlexPass will support Argon2id with a memory cost of 64 MiB, iteration count of 3, and parallelism of 1; PBKDF2-HMAC-SHA256 with 650,000 iterations; and salt with pepper for enhanced security.
2.2 Encryption
PlexPass will incorporate a robust encryption strategy that utilizes both symmetric and asymmetric encryption methodologies, in conjunction with envelope encryption, detailed as follows:
Symmetric Encryption: Based on OWasp recommendations, the private account information are safeguarded with Symmetric key algorithm of AES (Advanced Encryption Standard) with GCM (Galois/Counter Mode) mode that provides confidentiality and authenticity and uses key size of 256 bits (AES-256) for the highest security. The Symmetric key is used for both the encryption and decryption of accounts and sensitive data.
Asymmetric Encryption: PlexPass employs Elliptic Curve Cryptography (ECC) based Asymmetric key algorithm with SECP256k1 standard for encrypting Symmetric keys and sharing data with other users based on public key infrastructure (PKI). The public key is used for encrypting keys and shared data, while the private key is used for decryption. This allows users to share encrypted data without the need to exchange a secret key over the network.
Envelope Encryption: PlexPass’s envelope encryption mechanism involves encrypting a Symmetric data encryption key (DEK) with a Asymmetric encryption key (KEK). The Symmetric DEK is responsible for securing the actual user data, while the Asymmetric KEK is used to encrypt and protect the DEK itself. The top-level KEK key is then encrypted with a Symmetric key derived from the master user password and a pepper key for the local device. This multi-tiered encryption system ensures that even if data were to be accessed without authorization, it would remain undecipherable without the corresponding KEK.
3.0 Data Storage and Network Communication
With Envelope Encryption strategy, PlexPass ensures a multi-layered protective barrier for user accounts and sensitive information. This security measure involves encrypting data with a unique Symmetric key, which is then further secured using a combination of the user’s master password and a device-specific pepper key. The pepper key is securely stored within Hardware Security Modules (HSMs), providing an additional layer of defense. To generate the user’s secret key, PlexPass relies on the master password in tandem with the device’s pepper key, while ensuring that the master password itself is never stored locally or on any cloud-based platforms. PlexPass allows a versatile range of access points, including command-line tools, REST API, and a user-friendly interface. Although PlexPass is primarily designed for local hosting, it guarantees secure browser-to-local-server communications through the implementation of TLS 1.3, reflecting the commitment to the highest standards of network security.
3.1 Data Encryption
Following diagram illustrates how data is encrypted with envelop encryption scheme:
The above diagram illustrates that a master secret key is derived from the combination of the user’s master password and a device-specific pepper key. The device pepper key is securely stored within HSM storage solutions, such as the MacOS Keychain, or as encrypted files on other platforms. Crucially, neither the master user password nor the secret key are stored on any local or cloud storage systems.
This master secret key plays a pivotal role in the encryption process: it encrypts the user’s private asymmetric key, which then encrypts the symmetric user key. The symmetric user key is utilized for the encryption of user data and messages. Furthermore, the user’s private key is responsible for encrypting the private key of each Vault, which in turn is used to encrypt the Vault’s symmetric key and the private keys of individual Accounts.
Symmetric keys are employed for the encryption and decryption of data, while asymmetric keys are used for encrypting and decrypting other encryption keys, as well as for facilitating the secure sharing of data between multiple users. This layered approach to encryption ensures robust security and privacy of the user data within the system.
4.0 Domain Model
The following section delineates the domain model crafted for implementing a password manager:
Class-diagram
4.1 User
A user refers to any individual utilizing the password manager, which may include family members or other users. The accounts information corresponding to each user is secured with a unique key, generated by combining the user’s master password with a device-specific pepper key.
4.2 Vault
A user has the capability to create multiple vaults, each serving as a secure storage space for account information and sensitive data, tailored for different needs. Additionally, users can grant access to their vaults to family members or friends, enabling them to view or modify shared credentials for Wi-Fi, streaming services, and other applications.
4.3 Account and Secure Notes
The Account entity serves as a repository for a variety of user data, which may include credentials for website access, credit card details, personal notes, or other bespoke attributes. Key attributes of the Account entity include:
label and description of account
username
password
email
website
category
tags
OTP and other MFA credentials
custom fields for credit cards, address and other data
secure notes for storing private notes
4.4 Password Policy
The Password Policy stipulates the guidelines for creating or adhering to specified password requirements, including:
Option for a random or memorable password.
A minimum quota of uppercase letters to include.
A requisite number of lowercase letters to include.
An essential count of digits to incorporate.
A specified number of symbols to be included.
The minimum allowable password length.
The maximum allowable password length.
An exclusion setting to omit ambiguous characters for clarity.
4.5 Messages
The Message structure delineates different categories of messages employed for managing background operations, distributing information, or alerting users about potential password breaches.
4.6 Hashing and Cryptography algorithms
PlexPass offers the option to select from a variety of robust hashing algorithms, including Pbkdf2HmacSha256 and ARGON2id, as well as cryptographic algorithms like Aes256Gcm and ChaCha20Poly1305.
4.7 PasswordAnalysis
PasswordAnalysis encapsulates the outcome of assessing a password, detailing aspects such as:
The strength of the password.
Whether the password has been compromised or flagged in “Have I Been Pwned” (HIBP) breaches.
Similarity to other existing passwords.
Similarity to previously used passwords.
Reuse of the password across multiple accounts.
The entropy level, indicating the password’s complexity.
Compliance with established password creation policies
4.8 VaultAnalysis
VaultAnalysis presents a comprehensive evaluation of the security posture of all credentials within a vault, highlighting the following metrics:
The total number of accounts stored within the vault.
The quantity of passwords classified as strong due to their complexity and resistance to cracking attempts.
The tally of passwords deemed to have moderate strength, providing reasonable but not optimal security.
The count of passwords considered weak and vulnerable to being easily compromised.
The number of passwords that are not only strong but also have not been exposed in breaches or found to be reused.
The amount of credentials that have been potentially compromised or found in known data breaches.
The number of passwords that are reused across different accounts within the vault.
The tally of passwords that are notably similar to other passwords in the vault, posing a risk of cross-account vulnerability.
The count of current passwords that share similarities with the user’s past passwords, which could be a security concern if old passwords have been exposed.
4.9 System Configuration
The system configuration outlines a range of settings that determine the data storage path, HTTP server parameters, public and private key specifications for TLS encryption, preferred hashing and cryptographic algorithms, and other essential configurations.
4.10 UserContext
PlexPass mandates that any operation to access or modify user-specific information, including accounts, vaults, and other confidential data, is strictly governed by user authentication. The ‘UserContext’ serves as a secure container for the user’s authentication credentials, which are pivotal in the encryption and decryption processes of hierarchical cryptographic keys, adhering to the principles of envelope encryption.
5.0 Database Model and Schema
In general, there is a direct correlation between the domain model and the database schema, with the latter focusing primarily on key identifying attributes while preserving the integrity of user, vault, and account details through encryption. Furthermore, the database schema is designed to manage the cryptographic keys essential for the secure encryption and decryption of the stored data. The following section details the principal entities of the database model:
5.1 UserEntity
The UserEntity captures essential user attributes including the user_id and username. It securely retains encrypted user data alongside associated salt and nonce—components utilized in the encryption and decryption process. This entity leverages a secret-key, which is generated through a combination of the user’s master password and a unique device-specific pepper key. Importantly, the secret-key itself is not stored in the database to prevent unauthorized access.
5.2 LoginSessionEntity
The LoginSessionEntity records the details of user sessions, functioning as a mechanism to verify user access during remote engagements through the API or web interfaces.
5.3 CryptoKeyEntity
The CryptoKeyEntity encompasses both asymmetric and symmetric encryption keys. The symmetric key is encrypted by the asymmetric private key, which itself is encrypted using the public key of the parent CryptoKeyEntity. Key attributes include:
The unique identifier of the key.
The identifier of the parent key, which, if absent, signifies it as a root key—this is enforced as non-null for database integrity.
The user who owns the crypto key.
The keyable_id linked through a polymorphic association.
The keyable_type, determining the nature of the association.
The salt utilized in the encryption process.
The nonce that ensures encryption uniqueness.
The public key utilized for encryption purposes.
The secured private key, which is encrypted and used for value encryption tasks.
Note: The keyable_id and keyable_type facilitates implementing polymorphic relationships so that CryptoKeyEntity can be associated with different types of objects such as Users, Vaults, and Accounts.
5.4 VaultEntity
The VaultEntity is the structural representation of a secure repository designed for the safekeeping of account credentials and sensitive information. The primary attributes of the VaultEntity are as follows:
The user ID of the vault’s owner, indicating possession and control.
The designated name given to the vault for identification.
The category or type of vault, specifying its purpose or nature.
The salt applied during the encryption process, enhancing security.
The nonce, a number used once to prevent replay attacks, ensuring the uniqueness of each encryption.
The vault’s contents, securely encrypted to protect the confidentiality of the information it holds.
Other metadata such as unique identifier, version and timestamp for tracking changes.
5.5 AccountEntity
The AccountEntity serves as the database abstraction for the Account object, which is responsible for storing various user data, including account credentials, secure notes, and other bespoke attributes. Its principal characteristics are:
The vault_id that links the account to its respective vault.
The archived_version, which holds historical data of the account for reference or restoration purposes.
The salt, a random data input that is used in conjunction with hashing to ensure the uniqueness of each hash and prevent attacks such as hash collisions.
The key-nonce, a one-time use number utilized in the encryption process to guarantee the security of each encryption operation.
The encrypted_value, which is the securely encrypted form of the account’s data, preserving the confidentiality and integrity of user information.
The hash of primary attributes, which functions as a unique fingerprint to identify and prevent duplicate accounts from being created inadvertently.
Other metadata such as unique identifier, version and timestamp for tracking changes.
5.6 ArchivedAccountEntity
The ArchivedAccountEntity functions as a historical repository for AccountEntity records. Whenever a password or another vital piece of information within an account is altered, the original state of the account is preserved in this entity. This allows users to conveniently review previous versions of their account data, providing a clear audit trail of changes over time.
5.7 UserVaultEntity
The UserVaultEntity acts as the relational bridge between individual User entities and VaultEntity records. It facilitates the shared access of a single VaultEntity among multiple users while enforcing specific access control measures and adherence to predefined policies. This entity enables collaborative management of vault data based on access control policies and user’s permissions.
5.8 MessageEntity
The MessageEntity is a storage construct for various types of messages. These messages facilitate user notifications and alerts, sharing of vaults and account details, and scheduling of background processes. The entity ensures that operations meant to be executed on behalf of the user, such as sending notifications or processing queued tasks, are handled efficiently and securely.
5.9 AuditEntity
The AuditEntity functions as a comprehensive record for monitoring user activities within the system, primarily for enhancing security oversight. Key attributes of this entity are as follows:
The user associated with the audit event.
The specific category of the audit event.
The originating ip-adderss from which the event was triggered.
A set of context parameters providing additional detail about the event.
The message which encapsulates the essence of the audit event.
Additional metadata that provides further insight into the audit occurrence.
5.10 ACLEntity
The ACLEntity is a structural component that dictates permissions within the system, controlling user access to resources such as Vaults. The principal attributes of this entity are outlined as follows:
The user-id to which the ACL pertains, determining who the permissions are assigned to.
The resource-type indicating the category of resource the ACL governs.
The resource-id which specifies the particular instance of the resource under ACL.
A permission mask that encodes the rights of access, such as read or write privileges.
The scope parameters that may define the context or extent of the permissions.
Supplementary metadata which could include the ACL’s identifier, version number, and the timestamp of its creation or last update.
6.0 Data Repositories
Data repositories act as the intermediary layer between the underlying database and the application logic. These repositories are tasked with providing specialized data access operations for their respective database models, such as the UserRepository, ACLRepository, LoginSessionRepository, and so forth. They offer a suite of standardized methods for data manipulation—adding, updating, retrieving, and searching entries within the database.
Each repository typically adheres to a common Repository interface, ensuring consistency and predictability across different data models. Additionally, they may include bespoke methods that cater to specific requirements of the data they handle. Leveraging Rust’s Diesel library, these repositories enable seamless interactions with relational databases like SQLite, facilitating the efficient execution of complex queries and ensuring the integrity and performance of data operations within the system.
7.0 Domain Services
Following diagram illustrates major components of the PlexPass application:
Components Diagram
The heart of the password manager’s functionality is orchestrated by domain services, each tailored to execute a segment of the application’s core business logic by interacting with data repository interfaces. These services encompass a diverse range of operations integral to the password manager such as:
7.1 AuthenticationService
AuthenticationService defiens operations for user sign-in, sign-out and multi-factor authentication such as:
ImportExportService allows users to import account data into vaults or export it for backup or other purposes, ensuring data portability. It defines following operations:
Note: The import and export operations may take a long time so it supports a callback function to update user with progress of the operation.
7.7 MessageService
MessageSevice manages the creation, delivery, and processing of messages within the system, whether for notifications or data sharing. It defines following operations:
PasswordService offers operations for the generation of secure passwords, alongside analytical features to assess password strength and security. It defines following operations:
#[async_trait]
pub trait PasswordService {
    // create strong password.
    async fn generate_password(&self, policy: &PasswordPolicy) -> Option<String>;

    // check strength of password.
    async fn password_info(&self, password: &str) -> PassResult<PasswordInfo>;

    // check strength of password.
    async fn password_compromised(&self, password: &str) -> PassResult<bool>;

    // check if email is compromised.
    async fn email_compromised(&self, email: &str) -> PassResult<String>;

    // check similarity of password.
    async fn password_similarity(&self, password1: &str, password2: &str) -> PassResult<PasswordSimilarity>;

    // analyze passwords and accounts of all accounts in given vault
    // It returns hashmap by account-id and password analysis
    async fn analyze_all_account_passwords(&self, ctx: &UserContext, vault_id: &str) -> PassResult<VaultAnalysis>;

    // analyze passwords and accounts of all accounts in all vaults
    // It returns hashmap by (vault-id, account-id) and password analysis
    async fn analyze_all_vault_passwords(&self, ctx: &UserContext) -> PassResult<HashMap<String, VaultAnalysis>>;

    // schedule password analysis for vault
    async fn schedule_analyze_all_account_passwords(&self, ctx: &UserContext, vault_id: &str) -> PassResult<()>;

    // schedule password analysis for all vaults
    async fn schedule_analyze_all_vault_passwords(&self, ctx: &UserContext) -> PassResult<()>;
}
7.9 ShareVaultAccountService
ShareVaultAccountService handles the intricacies of sharing vaults and accounts, enabling collaborative access among authorized users. It defines following operations:
/// Service interface for sharing vaults or accounts.
#[async_trait]
pub trait ShareVaultAccountService {
    // share vault with another user
    async fn share_vault(
        &self,
        ctx: &UserContext,
        vault_id: &str,
        target_username: &str,
        read_only: bool,
    ) -> PassResult<usize>;

    // share account with another user
    async fn share_account(
        &self,
        ctx: &UserContext,
        account_id: &str,
        target_username: &str,
    ) -> PassResult<usize>;

    // lookup usernames
    async fn lookup_usernames(
        &self,
        ctx: &UserContext,
        q: &str,
    ) -> PassResult<Vec<String>>;

    // handle shared vaults and accounts from inbox of messages
    async fn handle_shared_vaults_accounts(
        &self,
        ctx: &UserContext,
    ) -> PassResult<(usize, usize)>;
}
PlexPass employs a Public Key Infrastructure (PKI) for secure data sharing, whereby a user’s vault and account keys are encrypted using the intended recipient’s public key. This encrypted data is then conveyed as a message, which is deposited into the recipient’s inbox. Upon the recipient’s next login, they use their private key to decrypt the message. This process of decryption serves to forge a trust link, granting the recipient authorized access to the shared vault and account information, strictly governed by established access control protocols.
7.10 SettingService
SettingService allows managing user preferencs and settings with following operations:
AuditLogService specializes in the retrieval and querying of audit logs, which are automatically generated to track activities for security monitoring. It defines following operations:
PlexPass employs API controllers to establish RESTful endpoints and UI controllers to manage the rendering of the web interface. Typically, there’s a direct correlation between each API and UI controller and their respective domain services. These controllers act as an intermediary, leveraging the domain services to execute the core business logic.
9.0 Commands
PlexPass adopts the command pattern for its command line interface, where each command is associated with a specific user action within the password management system.
10.0 Design Decisions
The architectural considerations for the design and implementation of PlexPass – a password manager – encompassed several key strategies:
Security-First Approach: PlexPass design ensured the highest level of security for stored credentials was paramount. This involved integrating robust encryption methods, such as AES-256 for data at rest and TLS 1.3 for data in transit, alongside employing secure hashing algorithms for password storage.
User-Centric Design: User experience was prioritized by providing a clean, intuitive interface and seamless interactions, whether through a command-line interface, RESTful APIs, or a web application.
Performance: PlexPass chose Rust for implementation to leverage its performance, safety, and robustness, ensuring a highly secure and efficient password manager.
Modular Structure: PlexPass was designed with modular architecture by segmenting the application into distinct services, controllers, and repositories to facilitate maintenance and future enhancements.
Object/Relation Mapping: PlexPass utilizes the Diesel framework for its database operations, which offers an extensive ORM toolkit for efficient data handling and compatibility with various leading relational databases.
MVC Architecture: PlexPass employs the Model-View-Controller (MVC) architectural pattern to structure its web application, enhancing the clarity and maintainability of the codebase. In this architecture, the Model component represents the data and the business logic of the application. It’s responsible for retrieving, processing, and storing data, and it interacts with the database layer. The model defines the essential structures and functions that represent the application’s core functionality and state. The View utilizes the Askama templating engine, a type-safe and fast Rust templating engine, to dynamically generate HTML content. The Controller acts as an intermediary between the Model and the View.
Multi-Factor Authentication: PlexPass supports Multi-Factor Authentication based on One-Time-Passwords (OTP), FIDO, WebAuthN, and YubiKey. It required careful implementation of these standards using widely used libraries when available. In addition, it required handling a number of edge cases such as losing a security device and adding multi-factor authentication to REST APIS and CLI tools and not just protecting the UI application.
Extensibility and Flexibility: PlexPass design considered future extensions to allow for additional features such as shared vaults and multi-factor authentication to be added without major overhauls.
Internationalization and Localization: PlexPass employs the Fluent library, a modern localization system designed for natural-sounding translations. This ensures that PlexPass user-interface is linguistically and culturally accessible to users worldwide.
Authorization and Access Control: PlexPass rigorously upholds stringent ownership and access control measures, guaranteeing that encrypted private data remains inaccessible without appropriate authentication. Furthermore, it ensures that other users can access shared Vaults and Accounts solely when they have been explicitly authorized with the necessary read or write permissions.
Cross-Platform Compatibility: PlexPass design ensured compatibility across different operating systems and devices, enabling users to access their password vaults from any platform.
Privacy by Design: User privacy was safeguarded by adopting principles like minimal data retention and ensuring that sensitive information, such as master passwords, is never stored in a file or persistent database.
Asynchronous Processing: PlexPass uses asynchronous processing for any computational intenstive tasks such as password analysis so that UI and APIs are highly responsive.
Data Portability: PlexPass empowers users with full control over their data by offering comprehensive import and export features, facilitating effortless backup and data management.
Robust Error Handling and Logging: PlexPass applies comprehensive logging, auditing and error-handling mechanisms to facilitate troubleshooting and enhance the security audit trail.
Compliance with Best Practices: PlexPass design adhered to industry best practices and standards for password management and data protection regulations throughout the development process.
Health Metrics: PlexPass incorporates Prometheus, a powerful open-source monitoring and alerting toolkit, to publish and manage its API and business service metrics. This integration plays a crucial role in maintaining the reliability and efficiency of the system through enhanced monitoring capabilities.
11.0 User Guide
The following section serves as a practical guide for utilizing PlexPass, a secured password management solution. Users have the convenience of interacting with PlexPass through a variety of interfaces including a command-line interface (CLI), RESTful APIs, and a user-friendly web application.
11.1 Build and Installation
Checkout PlexPass from https://github.com/bhatti/PlexPass and then build using:
git clone git@github.com:bhatti/PlexPass.git
cd PlexPass
cargo build --release && ./target/release/plexpass server
Alternatively, you can use Docker for the server by pulling plexpass image as follows:
Once, the server is started, you can point a browser to the server, e.g., https://localhost:8443 and it will show you interface for signin and registration:
Sign up UI
11.3 User Signin
The user-signin is requied when using REST APIs but CLIBefore engaging with the system, users are required to complete the registration process. The REST API will generate a JWT Token, which will be required for accessing all other APIs, e.g.,
You can search your accounts based on username, email, categories, tags, label and description with above command. For example, above command will show all amazon accounts.
In above example, the exported data will be encrypted with given password and you can use symmetric encryption to decrypt it or import it later as follows:
You can check strength of a password using Docker CLI as follows:
docker run -e DEVICE_PEPPER_KEY=$DEVICE_PEPPER_KEY -e DATA_DIR=/data \
	-v $PARENT_DIR/PlexPassData:/data plexpass -j true --master-username frank \
    --master-password *** password-strength --password ***
11.26 Checking if Email is Compromised
11.26.1 Command Line
PlexPass integrates with https://haveibeenpwned.com/ and you can check if an emaill or website is compromised if you have an API key from the website. Here is how you can check if email is compromised using CLI as follows:
You can check if an email is compromised using Docker CLI as follows:
docker run -e DEVICE_PEPPER_KEY=$DEVICE_PEPPER_KEY -e DATA_DIR=/data \
	-v $PARENT_DIR/PlexPassData:/data plexpass -j true --master-username frank \
    --master-password ** email-compromised --email myemail@mail.com
Note: The Web UI highlights the accounts with red background that are using compromised or weak passwords and shows advisories such as:
11.27 Analyzing Passwords for a Vault
11.27.1 Command Line
PlexPass integrates with https://haveibeenpwned.com/ and checks for strength, similarity, and password reuse. Here is how you can analyze all passwords in a vault using CLI as follows:
You can search usernames using Docker CLI as follows:
docker run -e DEVICE_PEPPER_KEY=$DEVICE_PEPPER_KEY -e DATA_DIR=/data \
	-v $PARENT_DIR/PlexPassData:/data plexpass -j true --master-username frank \
    --master-password *** search-usernames --q ali
11.30 Sharing and Unsharing a Vault with another User
PlexPass allows sharing a vault with another user for read-only or read/write access to view or edit all accounts in the Vault.
11.30.1 Command Line
You can share a Vault with another user using CLI as follows:
./target/release/plexpass -j true --master-username eddie \
--master-password *** share-vault --vault-id $vault_id --target-username frank
You can also unshare a Vault with another user using CLI as follows:
./target/release/plexpass -j true --master-username eddie
--master-password *** unshare-vault --vault-id $vault_id --target-username frank
Vault and Account sharing within the system leverages public key infrastructure (PKI) for secure data exchange. This process involves encrypting the encryption keys of the Vault using the intended recipient user’s public key. A message containing this encrypted data is then sent to the recipient. Upon the recipient user’s next sign-in, this data is decrypted and subsequently re-encrypted using the recipient’s public key, ensuring secure access and transfer of information.
11.30.2 REST API
You can share or unshare a Vault with another user using REST API as follows:
When registering a security key, PlexPass will display recovery codes to reset multi-factor authentication if you lose your security key and you can reset in the Web application upon signin, e.g.,
Recovering multi-factor authentication keys
11.34 Security Dashboad and Auditing
The PlexPass web application includes a security dashboard to monitor health of all passwords and allows users to view audit logs for all changes to their accounts, e.g.,
Security Dashboard
12.0 Summary
The design principles and architectural framework outlined above showcase PlexPass’s advanced capabilities in password management, setting it apart from conventional cloud-based password managers. The key advantages of PlexPass include:
End-to-End Encryption and Zero-Knowledge Architecture: By encrypting all data with strong algorithms and ensuring that decryption happens only on the user’s device, PlexPass provides a high level of security. The zero-knowledge architecture means that it assumes no trust when accessing secured user data.
Local Data Storage and Management: With no reliance on cloud storage, PlexPass reduces the risk of data breaches and privacy concerns associated with cloud services.
Advanced Cryptographic Techniques: PlexPass’s use of Argon2 for password hashing, AES-256 for symmetric encryption, and ECC for asymmetric encryption, coupled with envelope encryption, positions it at the forefront of modern cryptographic practices.
User-Friendly Experience with Strong Security Practices: Despite its focus on security, PlexPass promises a great user experience through its command-line tool and web-based UI.
Open Source with Regular Updates: PlexPass is open-source that allows for community scrutiny, which can lead to the early detection and rectification of vulnerabilities.
Physical Security Considerations and Data Breach Alerts: PlexPass analyzes passwords for breaches, weak strength, similarity with other passwords and provides a dashboard for monitoring password security.
Multi-Device and Secure Sharing Features: The ability to share passwords securely with nearby trusted devices without cloud risks, and the support for multi-device use, make it versatile and family-friendly.
Strong Master Password and Password Generation: Encouraging strong master passwords and providing tools for generating robust passwords further enhance individual account security.
Detailed Domain Model with Advanced Data Storage and Network Communication: PlexPass’s detailed model covers all aspects of password management and security, ensuring thorough protection at each level.
Local Control and Privacy: With PlexPass, all data is stored locally, providing users with full control over their password data. This is particularly appealing for those who are concerned about privacy and don’t want their sensitive information stored on a cloud server.
Customization and Flexibility: PlexPass can be customized to fit specific needs and preferences. Users who prefer to have more control over the configuration and security settings may find PlexPass more flexible than cloud-based solutions.
Cost Control: Hosting your own password manager might have cost benefits, as you avoid ongoing subscription fees associated with many cloud-based password managers.
Transparency and Trust: PlexPass is open-source, users can inspect the source code for any potential security issues, giving them a higher degree of trust in the application.
Reduced Attack Surface: By not relying on cloud connectivity, offline managers are not susceptible to online attacks targeting cloud storage.
Control over Data: Users have complete control over their data, including how it’s stored and backed up.
Potentially Lower Risk of Service Shutdown: Since the data is stored locally, the user’s access to their passwords is not contingent on the continued operation of a third-party service.
Multi-Factor and Local Authentication: PlexPass supports Multi-Factor Authentication based on One-Time-Passwords (OTP), FIDO, WebAuthN, and YubiKey for authentication.
In summary, PlexPass, with its extensive features, represents a holistic and advanced approach to password management. You can download it freely from https://github.com/bhatti/PlexPass and provide your feedback.
Phased deployment is a software deployment strategy where new software features, changes, or updates are gradually released to a subset of a product’s user base rather than to the entire user community at once. The goal is to limit the impact of any potential negative changes and to catch issues before they affect all users. It’s often a part of modern Agile and DevOps practices, allowing teams to validate software in stages—through testing environments, to specific user segments, and finally, to the entire user base. The phased deployment solves following issues with the production changes:
Risk Mitigation: Deploying changes all at once can be risky, especially for large and complex systems. Phase deployment helps to mitigate this risk by gradually releasing the changes and carefully monitoring their impact.
User Experience: With phased deployment, if something goes wrong, it affects only a subset of users. This protects the larger user base from potential issues and negative experiences.
Performance Bottlenecks: By deploying in phases, you can monitor how the system performs under different loads, helping to identify bottlenecks and scaling issues before they impact all users.
Immediate Feedback: Quick feedback loops with stakeholders and users are established. This immediate feedback helps in quick iterations and refinements.
Resource Utilization: Phased deployment allows for better planning and use of resources. You can allocate just the resources you need for each phase, reducing waste.
The phased deployment applies following approaches for detecting production issues early in the deployment process:
Incremental Validation: As each phase is a limited rollout, you can carefully monitor and validate that the software is working as expected. This enables early detection of issues before they become widespread.
Isolation of Issues: If an issue does arise, its impact is restricted to a smaller subset of the system or user base. This makes it easier to isolate the problem, fix it, and then proceed with the deployment.
Rollbacks: In the event of a problem, it’s often easier to rollback changes for a subset of users than for an entire user base. This allows for quick recovery with minimal impact.
Data-driven Decisions: The metrics and logs gathered during each phase can be invaluable for making informed decisions, reducing the guesswork, and thereby reducing errors.
User Feedback: By deploying to a limited user set first, you can collect user feedback that can be crucial for understanding how the changes are affecting user interaction and performance. This provides another opportunity for catching issues before full-scale deployment.
Best Practices and Automation: Phase deployment often incorporates industry best practices like blue/green deployments, canary releases, and feature flags, all of which help in minimizing errors and ensuring a smooth release.
Building CI/CD Process for Phased Deployment
CI/CD with Phased Deployment
Continuous Integration (CI)
Continuous Integration (CI) is a software engineering practice aimed at regularly merging all developers’ working copies of code to a shared mainline or repository, usually multiple times a day. The objective is to catch integration errors as quickly as possible and ensure that code changes by one developer are compatible with code changes made by other developers in the team. The practice defines following steps for integrating developers’ changes:
Code Commit: Developers write code in their local environment, ensuring it meets all coding guidelines and includes necessary unit tests.
Pull Request / Merge Request: When a developer believes their code is ready to be merged, they create a pull request or merge request. This action usually triggers the CI process.
Automated Build and Test: The CI server automatically picks up the new code changes that may be in a feature branch and initiates a build and runs all configured tests.
Code Review: Developers and possibly other stakeholders review the test and build reports. If errors are found, the code is sent back for modification.
Merge: If everything looks good, the changes are merged into main branch of the repository.
Automated Build: After every commit, automated build processes compile the source code, create executables, and run unit/integration/functional tests.
Automated Testing: This stage automatically runs a suite of tests that can include unit tests, integration tests, test coverage and more.
Reporting: Generate and publish reports detailing the success or failure of the build, lint/FindBugs, static analysis (Fortify), dependency analysis, and tests.
Notification: Developers are notified about the build and test status, usually via email, Slack, or through the CI system’s dashboard.
Artifact Repository: Store the build artifacts that pass all the tests for future use.
Above continuous integration process allows immediate feedback on code changes, reduces integration risk, increases confidence, encourages better collaboration and improves code quality.
Continuous Deployment (CD)
The Continuous Deployment (CD) further enhances this by automating the delivery of applications to selected infrastructure environments. Where CI deals with build, testing, and merging code, CD takes the code from CI and deploys it directly into the production environment, making changes that pass all automated tests immediately available to users. The above workflow for Continuous Integration is added with following additional steps:
Code Committed: Once code passes all tests during the CI phase, it moves onto CD.
Pre-Deployment Staging: Code may be deployed to a staging area where it undergoes additional tests that could be too time-consuming or risky to run during CI. The staging environment can be divided into multiple environments such as alpha staging for integration and sanity testing, beta staging for functional and acceptance testing, and gamma staging environment for chaos, security and performance testing.
Performance Bottlenecks: The staging environment may execute security, chaos, shadow and performance tests to identify bottlenecks and scaling issues before deploying code to the production.
Deployment to Production: If the code passes all checks, it’s automatically deployed to production.
Monitoring & Verification: After deployment, automated systems monitor application health and performance. Some systems use Canary Testing to continuously verify that deployed features are behaving as expected.
Rollback if Necessary: If an issue is detected, the CD system can automatically rollback to a previous, stable version of the application.
Feedback Loop: Metrics and logs from the deployed application can be used to inform future development cycles.
The Continuous Deployment process results in faster time-to-market, reduced risk, greater reliability, improved quality, and better efficiency and resource utilization.
Phased Deployment Workflow
Phased Deployment allows rolling out a change in increments rather than deploying it to all servers or users at once. This strategy fits naturally into a Continuous Integration/Continuous Deployment (CI/CD) pipeline and can significantly reduce the risks associated with releasing new software versions. The CI/CD workflow is enhanced as follows:
Code Commit & CI Process: Developers commit code changes, which trigger the CI pipeline for building and initial testing.
Initial Deployment to Dev Environment: After passing CI, the changes are deployed to a development environment for further testing.
Automated Tests and Manual QA: More comprehensive tests are run. This could also include security, chaos, shadow, load and performance tests.
Phase 1 Deployment (Canary Release): Deploy the changes to a small subset of the production environment or users and monitor closely. If you operate in multiple data centers, cellular architecture or geographical regions, consider initiating your deployment in the area with the fewest users to minimize the impact of potential issues. This approach helps in reducing the “blast radius” of any potential problems that may arise during deployment.
PreProd Testing: In the initial phase, you may optionally first deploy to a special pre-prod environment where you only execute canary testing simulating user requests without actually user-traffic with the production infrastructure so that you can further reduce blast radius for impacting customer experience.
Baking Period: To make informed decisions about the efficacy and reliability of your code changes, it’s crucial to have a ‘baking period’ where the new code is monitored and tested. During this time, you’ll gather essential metrics and data that help in confidently determining whether or not to proceed with broader deployments.
Monitoring and Metrics Collection: Use real-time monitoring tools to track system performance, error rates, and other KPIs.
Review and Approval: If everything looks good, approve the changes for the next phase. If issues are found, roll back and diagnose.
Subsequent Phases: Roll out the changes to larger subsets of the production environment or user base, monitoring closely at each phase. The subsequent phases may use a simple static scheme by adding X servers or user-segments at a time or geometric scheme by exponentially doubling the number of servers or user-segments after each phase. For instance, you can employ mathematical formulas like 2^N or 1.5^N, where N represents the phase number, to calculate the scope of the next deployment phase. This could pertain to the number of servers, geographic regions, or user segments that will be included.
SubsequentBaking Periods: As confidence in the code increases through successful earlier phases, the duration of subsequent ‘baking periods’ can be progressively shortened. This allows for an acceleration of the phased deployment process until the changes are rolled out to all regions or user segments.
Final Rollout: After all phases are successfully completed, deploy the changes to all servers and users.
Continuous Monitoring: Even after full deployment, keep running Canary Tests for validation and monitoring to ensure everything is working as expected.
Thus, phase deployment further mitigates risk, improves user experience, monitoring and resource utilization. If a problem is identified, it’s much easier to roll back changes for a subset of users, reducing negative impact.
Criteria for Selecting Targets for Phased Deployment
When choosing targets for phased deployment, you have multiple options, including cells within a Cellular Architecture, distinct Geographical Regions, individual Servers within a data center, or specific User Segments. Here are some key factors to consider while making your selection:
Risk Assessment: The first step in selecting cells, regions, or user-segments is to conduct a thorough risk assessment. The idea is to understand which areas are most sensitive to changes and which are relatively insulated from potential issues.
User Activity: Regions with lower user activity can be ideal candidates for the initial phases, thereby minimizing the impact if something goes wrong.
Technical Constraints: Factors such as server capacity, load balancing, and network latency may also influence the selection process.
Business Importance: Some user-segments or regions may be more business-critical than others. Starting deployment in less critical areas can serve as a safe first step.
Gradual Scale-up: Mathematical formulas like 2^N or 1.5^N where N is the phase number can be used to gradually increase the size of the deployment target in subsequent phases.
Performance Metrics: Utilize performance metrics like latency, error rates, etc., to decide on next steps after each phase.
Always start with the least risky cells, regions, or user-segments in the initial phases and then use metrics and KPIs to gain confidence in the deployed changes. After gaining confidence from initial phases, you may initiate parallel deployments cross multiple environments, perhaps even in multiple regions simultaneously. However, you should ensure that each environment has its independent monitoring to quickly identify and isolate issues. The rollback strategy should be tested ahead of time to ensure it works as expected before parallel deployment. You should keep detailed logs and documentation for each deployment phase and environment.
Cellular Architecture
Phased deployment can work particularly well with a cellular architecture, offering a systematic approach to gradually release new code changes while ensuring system reliability. In cellular architecture, your system is divided into isolated cells, each capable of operating independently. These cells could represent different services, geographic regions, user segments, or even individual instances of a microservices-based application. For example, you can identify which cells will be the first candidates for deployment, typically those with the least user traffic or those deemed least critical.
The deployment process begins by introducing the new code to an initial cell or a small cluster of cells. This initial rollout serves as a pilot phase, during which key performance indicators such as latency, error rates, and other metrics are closely monitored. If the data gathered during this ‘baking period’ indicates issues, a rollback is triggered. If all goes well, the deployment moves on to the next set of cells. Subsequent phases follow the same procedure, gradually extending the deployment to more cells. Utilizing phased deployment within a cellular architecture helps to minimize the impact area of any potential issues, thus facilitating more effective monitoring, troubleshooting, and ultimately a more reliable software release.
Blue/Green Deployment
The phased deployment can employ the Blue/Green deployment strategy where two separate environments, often referred to as “blue” and “green,” are configured. Both are identical in terms of hardware, software, and settings. The Blue environment runs the current version of the application and serves all user traffic. The Green is a clone of the Blue environment where the new version of the application is deployed. This helps phased deployment because one environment is always live, thus allow for releasing new features without downtime. If issues are detected, traffic can be quickly rerouted back to the Blue environment, thus minimizing the risk and impact of new deployments. The Blue/Green deployment includes following steps:
Preparation: Initially, both Blue and Green environments run the current version of the application.
Initial Rollout: Deploy the new application code or changes to the Green environment.
Verification: Perform tests on the Green environment to make sure the new code changes are stable and performant.
Partial Traffic Routing: In a phased manner, start rerouting a small portion of the live traffic to the Green environment. Monitor key performance indicators like latency, error rates, etc.
Monitoring and Decision: If any issues are detected during this phase, roll back the traffic to the Blue environment without affecting the entire user base. If metrics are healthy, proceed to the next phase.
Progressive Routing: Gradually increase the percentage of user traffic being served by the Green environment, closely monitoring metrics at each stage.
Final Cutover: Once confident that the Green environment is stable, you can reroute 100% of the traffic from the Blue to the Green environment.
Fallback: Keep the Blue environment operational for a period as a rollback option in case any issues are discovered post-switch.
Decommission or Sync: Eventually, decommission the Blue environment or synchronize it to the Green environment’s state for future deployments.
Automated Testing
CI/CD and phased deployment strategy relies on automated testing to validate changes to a subset of infrastructure or users. The automated testing includes a variety of testing types that should be performed at different stages of the process such as:involved:
Functional Testing: testing the new feature or change before initiating phased deployment to make sure it performs its intended function correctly.
Security Testing: testing for vulnerabilities, threats, or risks in a software application before phased deployment.
Performance Testing: testing how the system performs under heavy loads or large amounts of data before and during phased deployment.
Canary Testing: involves rolling out the feature to a small, controlled group before making it broadly available. This also includes testing via synthetic transactions by simulating user requests. This is executed early in the phased deployment process, however testing via synthetic transactions is continuously performed in background.
Shadow Testing: In this method, the new code runs alongside the existing system, processing real data requests without affecting the actual system.
Chaos Testing: This involves intentionally introducing failures to see how the system reacts. It is usually run after other types of testing have been performed successfully, but before full deployment.
Load Testing: test the system under the type of loads it will encounter in the real world before the phased deployment.
Stress Testing: attempt to break the system by overwhelming its resources. It is executed late in the phased deployment process, but before full deployment.
Penetration Testing: security testing where testers try to ‘hack’ into the system.
Usability Testing: testing from the user’s perspective to make sure the application is easy to use in early stages of phased deployment.
Monitoring
Monitoring plays a pivotal role in validating the success of phased deployments, enabling teams to ensure that new features and updates are not just functional, but also reliable, secure, and efficient. By constantly collecting and analyzing metrics, monitoring offers real-time feedback that can inform deployment decisions. Here’s how monitoring can help with the validation of phased deployments:
Real-Time Metrics and Feedback: collecting real-time metrics on system performance, user engagement, and error rates.
Baking Period Analysis: using a “baking” period where the new code is run but closely monitored for any anomalies.
Anomaly Detection: using automated monitoring tools to flag anomalies in real-time, such as a spike in error rates or a drop in user engagement.
Benchmarking: establishing performance benchmarks based on historical data.
Compliance and Security Monitoring: monitoring for unauthorized data access or other security-related incidents.
Log Analysis: using aggregated logs to show granular details about system behavior.
User Experience Monitoring: tracking metrics related to user interactions, such as page load times or click-through rates.
Load Distribution: monitoring how well the new code handles different volumes of load, especially during peak usage times.
Rollback Metrics: tracking of the metrics related to rollback procedures.
Feedback Loops: using monitoring data for continuous feedback into the development cycle.
Feature Flags
Feature flags, also known as feature toggles, are a powerful tool in the context of phased deployments. They provide developers and operations teams the ability to turn features on or off without requiring a code deployment. This capability synergizes well with phased deployments by offering even finer control over the feature release process. The benefits of feature flags include:
Gradual Rollout: Gradually releasing a new feature to a subset of your user base.
Targeted Exposure: Enable targeted exposure of features to specific user segments based on different attributes like geography, user role, etc.
Real-world Testing: With feature flags, you can perform canary releases, blue/green deployments, and A/B tests in a live environment without affecting the entire user base.
Risk Mitigation: If an issue arises during a phased deployment, a feature can be turned off immediately via its feature flag, preventing any further impact.
Easy Rollback: Since feature flags allow for features to be toggled on and off, rolling back a feature that turns out to be problematic is straightforward and doesn’t require a new deployment cycle.
Simplified Troubleshooting: Feature flags simplify the troubleshooting process since you can easily isolate problems and understand their impact.
CICD Compatibility: Feature flags are often used in conjunction with CI/CD pipelines, allowing for features to be integrated into the main codebase even if they are not yet ready for public release.
Conditional Logic: Advanced feature flags can include conditional logic, allowing you to automate the criteria under which features are exposed to users.
A/B Testing
A/B testing, also known as split testing, is an experimental approach used to compare two or more versions of a web page, feature, or other variables to determine which one performs better. In the context of software deployment, A/B testing involves rolling out different variations (A, B, etc.) of a feature or application component to different subsets of users. Metrics like user engagement, conversion rates, or performance indicators are then collected to statistically validate which version is more effective or meets the desired goals better. Phased deployment and A/B testing can complement each other in a number of ways:
Both approaches aim to reduce risk but do so in different ways.
Both methodologies are user-focused but in different respects.
A/B tests offer a more structured way to collect user-related metrics, which can be particularly valuable during phased deployments.
Feature flags, often used in both A/B testing and phased deployment, give teams the ability to toggle features on or off for specific user segments or phases.
If an A/B test shows one version to be far more resource-intensive than another, this information could be invaluable for phased deployment planning.
The feedback from A/B testing can feed into the phased deployment process to make real-time adjustments.
A/B testing can be included as a step within a phase of a phased deployment, allowing for user experience quality checks.
In a more complex scenario, you could perform A/B testing within each phase of a phased deployment.
Safe Rollback
Safe rollback is a critical aspect of a robust CI/CD pipeline, especially when implementing phased deployments. Here’s how safe rollback can be implemented:
Maintain versioned releases of your application so that you can easily identify which version to rollback to.
Always have backward-compatible database changes so that rolling back the application won’t have compatibility issues with the database.
Utilize feature flags so that you can disable problematic features without needing to rollback the entire deployment.
Implement comprehensive monitoring and logging to quickly identify issues that might necessitate a rollback.
Automate rollback procedures.
Keep the old version (Blue) running as you deploy the new version (Green). If something goes wrong, switch the load balancer back to the old version.
Use Canaray releases to roll out the new version to a subset of your infrastructure. If errors occur, halt the rollout and revert the canary servers to the old version.
Following steps should be applied on rollback:
Immediate Rollback: As soon as an issue is detected that can’t be quickly fixed, trigger the rollback procedure.
Switch Load Balancer: In a Blue/Green setup, switch the load balancer back to route traffic to the old version.
Database Rollback: If needed and possible, rollback the database changes. Be very cautious with this step, as it can be risky.
Feature Flag Disablement: If the issue is isolated to a particular feature that’s behind a feature flag, consider disabling that feature.
Validation: After rollback, validate that the system is stable. This should include health checks and possibly smoke tests.
Postmortem Analysis: Once the rollback is complete and the system is stable, conduct a thorough analysis to understand what went wrong.
One critical consideration to keep in mind is ensuring both backward and forward compatibility, especially when altering communication protocols or serialization formats. For instance, if you update the serialization format and the new code writes data in this new format, the old code may become incompatible and unable to read the data if a rollback is needed. To mitigate this risk, you can deploy an intermediate version that is capable of reading the new format without actually writing in it.
Here’s how it works:
Phase 1: Release an intermediate version of the code that can read the new serialization format like JSON, but continues to write in the old format. This ensures that even if you have to roll back after advancing further, the “old” version is still able to read the newly-formatted data.
Phase 2: Once the intermediate version is fully deployed and stable, you can then roll out the new code that writes data in the new format.
By following this two-phase approach, you create a safety net, making it possible to rollback to the previous version without encountering issues related to data format incompatibility.
Safe Rollback when changing data format
Sample CI/CD Pipeline
Following is a sample GitHub Actions workflow .yml file that includes elements for build, test and deployment. You can create a new file in your repository under .github/workflows/ called ci-cd.yml:
name: CI/CD Pipeline with Phased Deployment
on:
push:
branches:
- main
env:
IMAGE_NAME: my-java-app
jobs:
unit-test:
runs-on: ubuntu-latest
steps:
- name: Checkout Code
uses: actions/checkout@v2
- name: Run Unit Tests
run: mvn test
integration-test:
needs: unit-test
runs-on: ubuntu-latest
steps:
- name: Run Integration Tests
run: mvn integration-test
functional-test:
needs: integration-test
runs-on: ubuntu-latest
steps:
- name: Run Functional Tests
run: ./run-functional-tests.sh # Assuming you have a script for functional tests
load-test:
needs: functional-test
runs-on: ubuntu-latest
steps:
- name: Run Load Tests
run: ./run-load-tests.sh # Assuming you have a script for load tests
security-test:
needs: load-test
runs-on: ubuntu-latest
steps:
- name: Run Security Tests
run: ./run-security-tests.sh # Assuming you have a script for security tests
build:
needs: security-test
runs-on: ubuntu-latest
steps:
- name: Build and Package
run: |
mvn clean package
docker build -t ${{ env.IMAGE_NAME }} .
phase_one:
needs: build
runs-on: ubuntu-latest
steps:
- name: Deploy to Phase One Cells
run: ./deploy-to-phase-one.sh # Your custom deploy script for Phase One
- name: Canary Testing
run: ./canary-test-phase-one.sh # Your custom canary testing script for Phase One
- name: Monitoring
run: ./monitor-phase-one.sh # Your custom monitoring script for Phase One
- name: Rollback if Needed
run: ./rollback-phase-one.sh # Your custom rollback script for Phase One
if: failure()
phase_two:
needs: phase_one
# Repeat the same steps as phase_one but for phase_two
# ...
phase_three:
needs: phase_two
# Repeat the same steps as previous phases but for phase_three
# ...
phase_four:
needs: phase_three
# Repeat the same steps as previous phases but for phase_four
# ...
phase_five:
needs: phase_four
# Repeat the same steps as previous phases but for phase_five
# ...
run-functional-tests.sh, run-load-tests.sh, and run-security-tests.sh would contain the logic for running functional, load, and security tests, respectively. You might use tools like Selenium for functional tests, JMeter for load tests, and OWASP ZAP for security tests.
Conclusion
Phased deployment, when coupled with effective monitoring, testing, and feature flags, offers numerous benefits that enhance the reliability, security, and overall quality of software releases. Here’s a summary of the advantages:
Reduced Risk: By deploying changes in smaller increments, you minimize the impact of any single failure, thereby reducing the “blast radius” of issues.
Real-Time Validation: Continuous monitoring provides instant feedback on system performance, enabling immediate detection and resolution of issues.
Enhanced User Experience: Phased deployment allows for real-time user experience monitoring, ensuring that new features or changes meet user expectations and don’t negatively impact engagement.
Data-Driven Decision Making: Metrics collected during the “baking” period and subsequent phases allow for data-driven decisions on whether to proceed with the deployment, roll back, or make adjustments.
Security & Compliance: Monitoring for compliance and security ensures that new code doesn’t introduce vulnerabilities, keeping the system secure throughout the deployment process.
Efficient Resource Utilization: The gradual rollout allows teams to assess how the new changes affect system resources, enabling better capacity planning and resource allocation.
Flexible Rollbacks: In the event of a failure, the phased approach makes it easier to roll back changes, minimizing disruption and maintaining system stability.
Iterative Improvement: Metrics and feedback collected can be looped back into the development cycle for ongoing improvements, making future deployments more efficient and reliable.
Optimized Testing: Various forms of testing like functional, security, performance, and canary can be better focused and validated against real-world scenarios in each phase.
Strategic Rollout: Feature flags allow for even more granular control over who sees what changes, enabling targeted deployments and A/B testing.
Enhanced Troubleshooting: With fewer changes deployed at a time, identifying the root cause of any issues becomes simpler, making for faster resolution.
Streamlined Deployment Pipeline: Incorporating phased deployment into CI/CD practices ensures a smoother, more controlled transition from development to production.
By strategically implementing these approaches, phased deployment enhances the resilience and adaptability of the software development lifecycle, ensuring a more robust, secure, and user-friendly product.
The technologies, methodologies, and paradigms that have shaped the way software is designed, built, and delivered have evolved from the Waterfall model, proposed in 1970 by Dr. Winston W. Royce to Agile model in early 2000. The Waterfall model was characterized by sequential and rigid phases, detailed documentation, and milestone-based progression and suffered from inflexibility to adapt to changes, longer time-to-market, high risk and uncertainty difficulty in accurately estimating costs and time, silos between teams, and late discovery of issues. The Agile model addresses these shortcomings by adopting iterative and incremental development, continuous delivery, feedback loops, lower risk, and cross-functional teams. In addition, modern software development process over the last few years have adopted DevOps integration, automated testing, microservices and modular architecture, cloud services, infrastructure as code, and data driven decisions to improve the time to market, customer satisfaction, cost efficiency, operational resilience, collaboration, and sustainable development.
Modern Software Development Process
1. Goals
The goals of modern software development process includes:
Speed and Agility: Accelerate the delivery of high-quality software products and updates to respond to market demands and user needs.
Quality and Reliability: Ensure that the software meets specified requirements, performs reliably under all conditions, and is maintainable and scalable.
Reduced Complexity: Simplify complex tasks with use of refactoring and microservices.
Customer-Centricity: Develop features and products that solve real problems for users and meet customer expectations for usability and experience.
Scalability: Design software that can grow and adapt to changing user needs and technological advancements.
Cost-Efficiency: Optimize resource utilization and operational costs through automation and efficient practices.
Security: Ensure the integrity, availability, and confidentiality of data and services.
Innovation: Encourage a culture of innovation and learning, allowing teams to experiment, iterate, and adapt.
Collaboration and Transparency: Foster a collaborative environment among cross-functional teams and maintain transparency with stakeholders.
Employee Satisfaction: Focus on collaboration, autonomy, and mastery can lead to more satisfied, motivated teams.
Learning and Growth: Allows teams to reflect on their wins and losses regularly, fostering a culture of continuous improvement.
Transparency: Promote transparency with regular meetings like daily stand-ups and sprint reviews.
Flexibility: Adapt to changes even late in the development process.
Compliance and Governance: Ensure that software meets industry-specific regulations and standards.
Risk Mitigation: Make it easier to course-correct, reducing the risk of late project failure.
Competitive Advantage: Enables companies to adapt to market changes more swiftly, offering a competitive edge.
2. Elements of Software Development Process
Key elements of the Software Development Cycle include:
Discovery & Ideation: Involves brainstorming, feasibility studies, and stakeholder buy-in. Lean startup methodologies might be applied for new products.
Continuous Planning: Agile roadmaps, iterative sprint planning, and backlog refinement are continuous activities.
User-Centric Design: The design process is iterative, human-centered, and closely aligned with development.
Development & Testing: Emphasizes automated testing, code reviews, and incremental development. CI/CD pipelines automate much of the build and testing process.
Deployment & Monitoring: DevOps practices facilitate automated, reliable deployments. Real-time monitoring tools and AIOps (Artificial Intelligence for IT Operations) can proactively manage system health.
Iterative Feedback Loops: Customer feedback, analytics, and KPIs inform future development cycles.
3. Roles in Modern Processes
Critical Roles in Contemporary Software Development include:
Product Owner/Product Manager: This role serves as the liaison between the business and technical teams. They are responsible for defining the product roadmap, prioritizing features, and ensuring that the project aligns with stakeholder needs and business objectives.
Scrum Master/Agile Coach: These professionals are responsible for facilitating Agile methodologies within the team. They help organize and run sprint planning sessions, stand-ups, and retrospectives.
Development Team: This group is made up of software engineers and developers responsible for the design, coding, and initial testing of the product. They collaborate closely with other roles, especially the Product Owner, to ensure that the delivered features meet the defined requirements.
DevOps Engineers: DevOps Engineers act as the bridge between the development and operations teams. They focus on automating the Continuous Integration/Continuous Deployment (CI/CD) pipeline to ensure that code can be safely, efficiently, and reliably moved from development into production.
QA Engineers: Quality Assurance Engineers play a vital role in the software development life cycle by creating automated tests that are integrated into the CI/CD pipeline.
Data Scientists: These individuals use analytical techniques to draw actionable insights from data generated by the application. They may look at user behavior, application performance, or other metrics to provide valuable feedback that can influence future development cycles or business decisions.
Security Engineers: Security Engineers are tasked with ensuring that the application is secure from various types of threats. They are involved from the early stages of development to ensure that security is integrated into the design (“Security by Design”).
Each of these roles plays a critical part in modern software development, contributing to more efficient processes, higher-quality output, and ultimately, greater business value.
4. Phases of Modern SDLC
In the Agile approach to the software development lifecycle, multiple phases are organized not in a rigid, sequential manner as seen in the Waterfall model, but as part of a more fluid, iterative process. This allows for continuous feedback loops and enables incremental delivery of features. Below is an overview of the various phases that constitute the modern Agile-based software development lifecycle:
4.1 Inception Phase
The Inception phase is the initial stage in a software development project, often seen in frameworks like the Rational Unified Process (RUP) or even in Agile methodologies in a less formal manner. It sets the foundation for the entire project by defining its scope, goals, constraints, and overall vision.
4.1.1 Objectives
The objectives of inception phase includes:
Project Vision and Scope: Define what the project is about, its boundaries, and what it aims to achieve.
Feasibility Study: Assess whether the project is feasible in terms of time, budget, and technical constraints.
Stakeholder Identification: Identify all the people or organizations who have an interest in the project, such as clients, end-users, developers, and more.
Risk Assessment: Evaluate potential risks, like technical challenges, resource limitations, and market risks, and consider how they can be mitigated.
Resource Planning: Preliminary estimation of the resources (time, human capital, budget) required for the project.
Initial Requirements Gathering: Collect high-level requirements, often expressed as epics or user stories, which will be refined later.
Project Roadmap: Create a high-level project roadmap that outlines major milestones and timelines.
4.1.2 Practices
The inception phase includes following practices:
Epics Creation: High-level functionalities and features are described as epics.
Feasibility Study: Analyze the technical and financial feasibility of the proposed project.
Requirements: Identify customers and document requirements that were captured from the customers. Review requirements with all stakeholders and get alignment on key features and deliverables. Be careful for a scope creep so that the software change can be delivered incrementally.
Estimated Effort: A high-level effort in terms of estimated man-month, t-shirt size, or story-points to build and deliver the features.
Business Metrics: Define key business metrics that will be tracked such as adoption, utilization and success criteria for the features.
Customer and Dependencies Impact: Understand how the changes will impact customers as well as upstream/downstream dependencies.
Roadmapping: Develop a preliminary roadmap to guide the project’s progression.
4.1.3 Roles and Responsibilities:
The roles and responsibilities in inception phase include:
Stakeholders: Validate initial ideas and provide necessary approvals or feedback.
Product Owner: Responsible for defining the vision and scope of the product, expressed through a set of epics and an initial product backlog. The product manager interacts with customers, defines the customer problems and works with other stakeholders to find solutions. The product manager defines end-to-end customer experience and how the customer will benefit from the proposed solution.
Scrum Master: Facilitates the Inception meetings and ensures that all team members understand the project’s objectives and scope. The Scrum master helps write use-cases, user-stories and functional/non-functional requirements into the Sprint Backlog.
Development Team: Provide feedback on technical feasibility and initial estimates for the project scope.
By carefully executing the Inception phase, the team can ensure that everyone has a clear understanding of the ‘what,’ ‘why,’ and ‘how’ of the project, thereby setting the stage for a more organized and focused development process.
4.2. Planning Phase
The Planning phase is an essential stage in the Software Development Life Cycle (SDLC), especially in methodologies that adopt Agile frameworks like Scrum or Kanban. This phase aims to detail the “how” of the project, which is built upon the “what” and “why” established during the Inception phase. The Planning phase involves specifying objectives, estimating timelines, allocating resources, and setting performance measures, among other activities.
4.2.1 Objectives
The objectives of planning phase includes:
Sprint Planning: Determine the scope of the next sprint, specifying what tasks will be completed.
Release Planning: Define the features and components that will be developed and released in the upcoming iterations.
Resource Allocation: Assign tasks and responsibilities to team members based on skills and availability.
Timeline and Effort Estimation: Define the timeframe within which different tasks and sprints should be completed.
Risk Management: Identify, assess, and plan for risks and contingencies.
Technical Planning: Decide the architectural layout, technologies to be used, and integration points, among other technical aspects.
4.2.2 Practices:
The planning phase includes following practices:
Sprint Planning: A meeting where the team decides what to accomplish in the coming sprint.
Release Planning: High-level planning to set goals and timelines for upcoming releases.
Backlog Refinement: Ongoing process to add details, estimates, and order to items in the Product Backlog.
Effort Estimation: Techniques like story points, t-shirt sizes, or time-based estimates to assess how much work is involved in a given task or story.
4.2.3 Roles and Responsibilities:
The roles and responsibilities in planning phase include:
Product Owner: Prioritizes the Product Backlog and clarifies details of backlog items. Helps the team understand which items are most crucial to the project’s success.
Scrum Master: Facilitates planning meetings and ensures that the team has what they need to complete their tasks. Addresses any impediments that the team might face.
Development Team: Provides effort estimates for backlog items, helps break down stories into tasks, and commits to the amount of work they can accomplish in the next sprint.
Stakeholders: May provide input on feature priority or business requirements, though they typically don’t participate in the detailed planning activities.
4.2.4 Key Deliverables:
Key deliverables in planning phase include:
Sprint Backlog: A list of tasks and user stories that the development team commits to complete in the next sprint.
Execution Plan: A plan outlining the execution of the software development including dependencies from other teams. The plan also identifies key reversible and irreversible decisions.
Deployment and Release Plan: A high-level plan outlining the features and major components to be released over a series of iterations. This plan also includes feature flags and other configuration parameters such as throttling limits.
Resource Allocation Chart: A detailed breakdown of who is doing what.
Risk Management Plan: A documentation outlining identified risks, their severity, and mitigation strategies.
By thoroughly engaging in the Planning phase, teams can have a clear roadmap for what needs to be achieved, how it will be done, who will do it, and when it will be completed. This sets the project on a course that maximizes efficiency, minimizes risks, and aligns closely with the stakeholder requirements and business objectives.
4.3. Design Phase
The Design phase in the Software Development Life Cycle (SDLC) is a critical step that comes after planning and before coding. During this phase, the high-level architecture and detailed design of the software system are developed. This serves as a blueprint for the construction of the system, helping the development team understand how the software components will interact, what data structures will be used, and how user interfaces will be implemented, among other things.
4.3.1 Objectives:
The objectives of design phase includes:
Architectural Design: Define the software’s high-level structure and interactions between components. Understand upstream and downstream dependencies and how architecture decisions affect those dependencies. The architecture will ensure scalability to a minimum of 2x of the peak traffic and will build redundancy to avoid single points of failure. The architecture decisions should be documented in an Architecture Decision Record format and should be defined in terms of reversible and irreversible decisions.
Low-Level Design: Break down the architectural components into detailed design specifications including functional and non-functional considerations. The design documents should include alternative solutions and tradeoffs when selecting a recommended approach. The design document should consider how the software can be delivered incrementally and whether multiple components can be developed in parallel. Other best practices such as not breaking backward compatibility, composable modules, consistency, idempotency, pagination, no unbounded operations, validation, and purposeful design should be applied to the software design.
API Design: Specify the endpoints, request/response models, and the underlying architecture for any APIs that the system will expose.
User Interface Design: Design the visual elements and user experiences.
Data Model Design: Define the data structures and how data will be stored, accessed, and managed.
Functional Design: Elaborate on the algorithms, interactions, and methods that will implement software features.
Security Design: Implement security measures like encryption, authentication, and authorization.
Performance Considerations: Design for scalability, reliability, and performance optimization.
Design for Testability: Ensure elements can be easily tested.
Operational Excellence: Document monitoring, logging, operational and business metrics, alarms, and dashboards to monitor health of the software components.
4.3.2 Practices:
The design phase includes following practices:
Architectural and Low-Level Design Reviews: Conducted to validate the robustness, scalability, and performance of the design. High-level reviews focus on the system architecture, while low-level reviews dig deep into modules, classes, and interfaces.
API Design Review: A specialized review to ensure that the API design adheres to RESTful principles, is consistent, and meets performance and security benchmarks.
Accessibility Review: Review UI for accessibility support.
Design Patterns: Utilize recognized solutions for common design issues.
Wireframing and Prototyping: For UI/UX design.
Sprint Zero: Sometimes used in Agile for initial setup, including design activities.
Backlog Refinement: Further details may be added to backlog items in the form of acceptance criteria and design specs.
4.3.3 Roles and Responsibilities:
The roles and responsibilities in design phase include:
Product Owner: Defines the acceptance criteria for user stories and validates that the design meets business and functional requirements.
Scrum Master: Facilitates design discussions and ensures that design reviews are conducted effectively.
Development Team: Creates the high-level architecture, low-level detailed design, and API design. Chooses design patterns and data models.
UX/UI Designers: Responsible for user interface and user experience design.
System Architects: Involved in high-level design and may also review low-level designs and API specifications.
API Designers: Specialized role focusing on API design aspects such as endpoint definition, rate limiting, and request/response models.
QA Engineers: Participate in design reviews to ensure that the system is designed for testability.
Security Engineers: Involved in both high-level and low-level design reviews to ensure that security measures are adequately implemented.
4.3.4 Key Deliverables:
Key deliverables in design phase include:
High-Level Architecture Document: Describes the architectural layout and high-level components.
Low-Level Design Document: Provides intricate details of each module, including pseudo-code, data structures, and algorithms.
API Design Specification: Comprehensive documentation for the API including endpoints, methods, request/response formats, and error codes.
Database Design: Includes entity-relationship diagrams, schema designs, etc.
UI Mockups: Prototypes or wireframes of the user interface.
Design Review Reports: Summaries of findings from high-level, low-level, and API design reviews.
Proof of Concept and Spikes: Build proof of concepts or execute spikes to learn about high risk design components.
Architecture Decision Records: Documents key decisions that were made including tradeoffs, constraints, stakeholders and final decision.
The Design phase serves as the blueprint for the entire project. Well-thought-out and clear design documentation helps mitigate risks, provides a clear vision for the development team, and sets the stage for efficient and effective coding, testing, and maintenance.
4.4 Development Phase
The Development phase in the Software Development Life Cycle (SDLC) is the stage where the actual code for the software is written, based on the detailed designs and requirements specified in the preceding phases. This phase involves coding, unit testing, integration, and sometimes even preliminary system testing to validate that the implemented features meet the specifications.
4.4.1 Objectives:
The objectives of development phase includes:
Coding: Translate design documentation and specifications into source code.
Modular Development: Build the software in chunks or modules for easier management, testing, and debugging.
Unit Testing: Verify that each unit or module functions as designed.
Integration: Combine separate units and modules into a single, functioning system.
Code Reviews: Validate that code adheres to standards, guidelines, and best practices.
Test Plans: Review test plans for all test-cases that will validate the changes to the software.
Documentation: Produce inline code comments, READMEs, and technical documentation.
Early System Testing: Sometimes, a form of system testing is performed to catch issues early.
4.4.2 Practices:
The development phase includes following practices:
Pair Programming: Two developers work together at one workstation, enhancing code quality.
Test-Driven Development (TDD): Write failing tests before writing code, then write code to pass the tests.
Code Reviews: Peer reviews to maintain code quality.
Continuous Integration: Frequently integrate code into a shared repository and run automated tests.
Version Control: Use of tools like Git to manage changes and history.
Progress Report: Use of burndown charts, risk analysis, blockers and other data to apprise stakeholders up-to-date with the progress of the development effort.
4.4.3 Roles and Responsibilities:
The roles and responsibilities in development phase include:
Product Owner: Prioritizes features and stories in the backlog that are to be developed, approves or rejects completed work based on acceptance criteria.
Scrum Master: Facilitates daily stand-ups, removes impediments, and ensures the team is focused on the tasks at hand.
Software Developers: Write the code, perform unit tests, and integrate modules.
QA Engineers: Often involved early in the development phase to write automated test scripts, and to run unit tests along with developers.
DevOps Engineers: Manage the CI/CD pipeline to automate code integration and preliminary testing.
Technical Leads/Architects: Provide guidance and review code to ensure it aligns with architectural plans.
4.4.4 Key Deliverables:
Key deliverables in development phase include:
Source Code: The actual code files, usually stored in a version control system.
Unit Test Cases and Results: Documentation showing what unit tests have been run and their results.
Code Review Reports: Findings from code reviews.
Technical Documentation: Sometimes known as codebooks or developer guides, these detail how the code works for future maintenance.
4.4.5 Best Practices for Development:
Best practices in development phase include:
Clean Code: Write code that is easy to read, maintain, and extend.
Modularization: Build in a modular fashion for ease of testing, debugging, and scalability.
Commenting and Documentation: In-line comments and external documentation to aid in future maintenance and understanding.
Code Repositories: Use version control systems to keep a historical record of all changes and to facilitate collaboration.
The Development phase is where the design and planning turn into a tangible software product. Following best practices and guidelines during this phase can significantly impact the quality, maintainability, and scalability of the end product.
4.5. Testing Phase
The Testing phase in the Software Development Life Cycle (SDLC) is crucial for validating the system’s functionality, performance, security, and stability. This phase involves various types of testing methodologies to ensure that the software meets all the requirements and can handle expected and unexpected situations gracefully.
4.5.1 Objectives:
The objectives of testing phase includes:
Validate Functionality: Ensure all features work as specified in the requirements.
Ensure Quality: Confirm that the system is reliable, secure, and performs optimally.
Identify Defects: Find issues that need to be addressed before the software is deployed.
Risk Mitigation: Assess and mitigate potential security and performance risks.
4.5.2 Practices:
The testing phase includes following practices:
Test Planning: Create a comprehensive test plan detailing types of tests, scope, schedule, and responsibilities.
Test Case Design: Prepare test cases based on various testing requirements.
Test Automation: Automate repetitive and time-consuming tests.
Continuous Testing: Integrate testing into the CI/CD pipeline for continuous feedback.
4.5.3 Types of Testing and Responsibilities:
The test phase includes following types of testing:
Integration Testing: Responsibilities: QA Engineers, DevOps Engineers Objective: Verify that different modules or services work together as expected.
Functional Testing: Responsibilities: QA Engineers Objective: Validate that the system performs all the functions as described in the specifications.
Load/Stress Testing: Responsibilities: Performance Test Engineers, DevOps Engineers Objective: Check how the system performs under heavy loads.
Security and Penetration Testing: Responsibilities: Security Engineers, Ethical Hackers Objective: Identify vulnerabilities that an attacker could exploit.
Canary Testing: Responsibilities: DevOps Engineers, Product Owners Objective: Validate that new features or updates will perform well with a subset of the production environment before full deployment.
Other Forms of Testing: Smoke Testing: Quick tests to verify basic functionality after a new build or deployment. Regression Testing: Ensure new changes haven’t adversely affected existing functionalities. User Acceptance Testing (UAT): Final validation that the system meets business needs, usually performed by stakeholders or end-users.
4.5.4 Key Deliverables:
Test Plan: Describes the scope, approach, resources, and schedule for the testing activities.
Test Cases: Detailed description of what to test, how to test, and expected outcomes.
Test Scripts: Automated scripts for testing.
Test Reports: Summary of testing activities, findings, and results.
4.5.5 Best Practices for Testing:
Early Involvement: Involve testers from the early stages of SDLC for better understanding and planning.
Code Reviews: Conduct code reviews to catch potential issues before the testing phase.
Data-Driven Testing: Use different sets of data to evaluate how the application performs with various inputs.
Monitoring and Feedback Loops: Integrate monitoring tools to get real-time insights during testing and improve the test scenarios continuously.
The Testing phase is crucial for delivering a reliable, secure, and robust software product. The comprehensive testing strategy that includes various types of tests ensures that the software is well-vetted before it reaches the end-users.
4.6. Deployment Phase
The Deployment phase in the Software Development Life Cycle (SDLC) involves transferring the well-tested codebase from the staging environment to the production environment, making the application accessible to the end-users. This phase aims to ensure a smooth transition of the application from development to production with minimal disruptions and optimal performance.
4.6.1 Objectives:
The objectives of deployment phase includes:
Release Management: Ensure that the application is packaged and released properly.
Transition: Smoothly transition the application from staging to production.
Scalability: Ensure the infrastructure can handle the production load.
Rollback Plans: Prepare contingencies for reverting changes in case of failure.
4.6.2 Key Components and Practices:
The key components and practices in deployment phase include:
Continuous Deployment (CD): Responsibilities: DevOps Engineers, QA Engineers, Developers Objective: Automatically deploy all code changes to the production environment that pass the automated testing phase. Tools: Jenkins, GitLab CI/CD, GitHub Actions, Spinnaker
Infrastructure as Code (IaC): Responsibilities: DevOps Engineers, System Administrators Objective: Automate the provisioning and management of infrastructure using code. Tools: Terraform, AWS CloudFormation, Ansible
Canary Testing: Responsibilities: DevOps Engineers, QA Engineers Objective: Gradually roll out the new features to a subset of users before a full-scale rollout to identify potential issues.
Phased Deployment: Responsibilities: DevOps Engineers, Product Managers Objective: Deploy the application in phases to monitor its stability and performance, enabling easier troubleshooting.
Rollback: Responsibilities: DevOps Engineers Objective: Be prepared to revert the application to its previous stable state in case of any issues.
Feature Flags: Responsibilities: Developers, Product Managers Objective: Enable or disable features in real-time without deploying new code.
Resilience: Responsibilities: DevOps Engineers, Developers Objective: Prevent retry storms, throttle the number of client requests, and apply reliability patterns such as Circuit Breakers and BulkHeads. Avoid bimodal behavior and maintain software latency and throughput within the defined SLAs.
Throttling and Sharding Limits (and other Configurations): Responsibilities: DevOps Engineers, Developers Objective: Review configuration and performance configurations such as throttling and sharding limits.
Access Policies: Responsibilities: DevOps Engineers, Developers Objective: Review access policies, permissions and roles that can access the software.
4.6.3 Roles and Responsibilities:
The deployment phase includes following roles and responsibilities:
DevOps Engineers: Manage CI/CD pipelines, IaC, and automate deployments.
Product Managers: Approve deployments based on feature completeness and business readiness.
QA Engineers: Ensure the application passes all tests in the staging environment before deployment.
System Administrators: Ensure that the infrastructure is ready and scalable for deployment.
4.6.4 Key Deliverables:
The deployment phase includes following key deliverables:
Deployment Checklist: A comprehensive list of tasks and checks before, during, and after deployment.
CD Pipeline Configuration: The setup details for the Continuous Deployment pipeline.
Automated Test Cases: Essential for validating the application before automatic deployment.
Operational, Security and Compliance Review Documents: These documents will define checklists about operational excellence, security and compliance support in the software.
Deployment Logs: Automated records of what was deployed, when, and by whom (usually by the automation system).
Logging: Review data that will be logged and respective log levels so that data privacy is not violated and excessive logging is avoided.
Deployment Schedule: A timeline for the deployment process.
Observability: Health dashboard to monitor operational and business metrics, and alarms to receive notifications when service-level-objectives (SLO) are violated. The operational metrics will include availability, latency, and error metrics. The health dashboard will monitor utilization of CPU, disk space, memory, and network resources.
Rollback Plan: A detailed plan for reverting to the previous stable version if necessary.
4.6.5 Best Practices:
Following are a few best practices for the deployment phase:
Automated Deployments: Use automation tools for deployment of code and infrastructure to minimize human error.
Monitoring and Alerts: Use monitoring tools to get real-time insights into application performance and set up alerts for anomalies.
Version Control: Ensure that all deployable artifacts are versioned for traceability.
Comprehensive Testing: Given the automated nature of Continuous Deployment, having a comprehensive suite of automated tests is crucial.
Rollback Strategy: Have an automated rollback strategy in case the new changes result in system failures or critical bugs.
Feature Toggles: Use feature flags to control the release of new features, which can be enabled or disabled without having to redeploy.
Audit Trails: Maintain logs and history for compliance and to understand what was deployed and when.
Documentation: Keep detailed records of the deployment process, configurations, and changes.
Stakeholder Communication: Keep all stakeholders in the loop regarding deployment schedules, success, or issues.
Feedback from Early Adopters: If the software is being released to internal or a beta customers, then capture feedback from those early adopters including any bugs report.
Marketing and external communication: The release may need to be coordinated with a marketing campaign so that customers can be notified about new features.
The Deployment phase is critical for ensuring that the software is reliably and securely accessible by the end-users. A well-planned and executed deployment strategy minimizes risks and disruptions, leading to a more dependable software product.
4.7 Maintenance Phase
The Maintenance phase in the Software Development Life Cycle (SDLC) is the ongoing process of ensuring the software’s continued effective operation and performance after its release to the production environment. The objective of this phase is to sustain the software in a reliable state, provide continuous support, and make iterative improvements or patches as needed.
4.7.1 Objectives:
The objectives of maintenance phase includes:
Bug Fixes: Address any issues or defects that arise post-deployment.
Updates & Patches: Release minor or major updates and patches to improve functionality or security.
Optimization: Tune the performance of the application based on metrics and feedback.
Scalability: Ensure that the software can handle growth in terms of users, data, and transaction volume.
Documentation: Update all documents related to software changes and configurations.
4.7.2 Key Components and Practices:
The key components and practices of maintenance phase include:
Incident Management: Responsibilities: Support Team, DevOps Engineers Objective: Handle and resolve incidents affecting the production environment.
Technical Debt Management: Responsibilities: Development Team, Product Managers Objective: Prioritize and resolve accumulated technical debt to maintain code quality and performance.
Security Updates: Responsibilities: Security Engineers, DevOps Engineers Objective: Regularly update and patch the software to safeguard against security vulnerabilities.
Monitoring & Analytics: Responsibilities: DevOps Engineers, Data Analysts Objective: Continuously monitor software performance, availability, and usage to inform maintenance tasks.
Documentation and Runbooks: Responsibilities: Support Team, DevOps Engineers Objective: Define cookbooks for development processes and operational issues.
4.7.3 Roles and Responsibilities:
The maintenance phase includes following roles and responsibilities:
DevOps Engineers: Monitor system health, handle deployments for updates, and coordinate with the support team for incident resolution.
Support Team: Provide customer support, report bugs, and assist in reproducing issues for the development team.
Development Team: Develop fixes, improvements, and updates based on incident reports, performance metrics, and stakeholder feedback.
Product Managers: Prioritize maintenance tasks based on customer needs, business objectives, and technical requirements.
Security Engineers: Regularly audit the software for vulnerabilities and apply necessary security patches.
4.7.4 Key Deliverables:
Key deliverables for the maintenance phase include:
Maintenance Plan: A detailed plan outlining maintenance activities, schedules, and responsible parties.
Patch Notes: Documentation describing what has been fixed or updated in each new release.
Performance Reports: Regular reports detailing the operational performance of the software.
4.7.5 Best Practices for Maintenance:
Following are a few best practices for the maintenance phase:
Automated Monitoring: Use tools like Grafana, Prometheus, or Zabbix for real-time monitoring of system health.
Feedback Loops: Use customer feedback and analytics to prioritize maintenance activities.
Version Control: Always version updates and patches for better tracking and rollback capabilities.
Knowledge Base: Maintain a repository of common issues and resolutions to accelerate incident management.
Scheduled Maintenance: Inform users about planned downtimes for updates and maintenance activities.
The Maintenance phase is crucial for ensuring that the software continues to meet user needs and operate effectively in the ever-changing technical and business landscape. Proper maintenance ensures the longevity, reliability, and continual improvement of the software product. Also, note that though maintenance is defined as a separate phase above but it will include other phases from inception to deployment and each change will be developed and deployed incrementally in iterative agile process.
5. Best Practices for Ensuring Reliability, Quality, and Incremental Delivery
Following best practices ensure incremental delivery with higher reliability and quality:
5.1. Iterative Development:
Embrace the Agile principle of delivering functional software frequently. The focus should be on breaking down the product into small, manageable pieces and improving it in regular iterations, usually two to four-week sprints.
Tools & Techniques: Feature decomposition, Sprint planning, Short development cycles.
Benefits: Faster time to market, easier bug isolation, and tracking, ability to incorporate user feedback quickly.
5.2. Automated Testing:
Implement Test-Driven Development (TDD) or Behavior-Driven Development (BDD) to script tests before the actual coding begins. Maintain these tests to run automatically every time a change is made.
Detailed Explanation: A formal process where architects and developers evaluate high-level and low-level design documents to ensure they meet the project requirements, are scalable, and adhere to best practices.
Benefits: Early identification of design flaws, alignment with stakeholders, consistency across the system architecture.
5.4 Code Reviews:
Before any code gets merged into the main repository, it should be rigorously reviewed by other developers to ensure it adheres to coding standards, is optimized, and is free of bugs.
Benefits: Team-wide code consistency, early detection of anti-patterns, and a secondary check for overlooked issues.
5.5 Security Review:
A comprehensive evaluation of the security aspects of the application, involving both static and dynamic analyses, is conducted to identify potential vulnerabilities.
Tools & Techniques: OWASP Top 10, Security Scanners like Nessus or Qualys, Code Review tools like Fortify, Penetration Testing.
Benefits: Proactive identification of security vulnerabilities, adherence to security best practices, and compliance with legal requirements.
5.6 Operational Review:
Before deploying any new features or services, assess the readiness of the operational environment, including infrastructure, data backup, monitoring, and support plans.
Tools & Techniques: Infrastructure as Code tools like Terraform, Monitoring tools like Grafana, Documentation.
Benefits: Ensures the system is ready for production, mitigates operational risks, confirms that deployment and rollback strategies are in place.
5.7 CI/CD (Continuous Integration and Continuous Deployment):
Integrate all development work frequently and deliver changes to the end-users reliably and rapidly using automated pipelines.
Benefits: Continuous process improvement, team alignment, and reflection on the project’s success and failures.
5.10 Product Backlog Management:
A live document containing all known requirements, ranked by priority and constantly refined to reflect changes and learnings.
Tools & Techniques: JIRA, Asana, Scrum boards.
Benefits: Focused development on high-impact features, adaptability to market or user needs.
5.11. Kanban for Maintenance:
For ongoing maintenance work and technical debt management, utilize a Kanban system to visualize work, limit work-in-progress, and maximize efficiency.
Benefits: Risk mitigation during deployments, simpler rollbacks, and fine-grained control over feature releases.
5.13 Documentation:
Create comprehensive documentation, ranging from code comments and API docs to high-level architecture guides and FAQs for users.
Tools & Techniques: Wiki platforms, OpenAPI/Swagger for API documentation, Code comments.
Benefits: Streamlined onboarding for new developers, easier troubleshooting, and long-term code maintainability.
By diligently applying these multi-layered Agile best practices and clearly defined roles, your SDLC will be a well-oiled machine—more capable of rapid iterations, quality deliverables, and high adaptability to market or user changes.
6. Conclusion
The Agile process combined with modern software development practices offers an integrated and robust framework for building software that is adaptable, scalable, and high-quality. This approach is geared towards achieving excellence at every phase of the Software Development Life Cycle (SDLC), from inception to deployment and maintenance. The key benefits of this modern software development process includes flexibility and adaptability, reduced time-to-market, enhanced quality, operational efficiency, risk mitigation, continuous feedback, transparency, collaboration, cost-effectiveness, compliance and governance, and documentation for sustainment. By leveraging these Agile and modern software development practices, organizations can produce software solutions that are not only high-quality and reliable but also flexible enough to adapt to ever-changing requirements and market conditions.
Microservice architecture is an evolution of Monolithic and Service-Oriented Architecture (SOA), where an application is built as a collection of loosely coupled, independently deployable services. Each microservice usually corresponds to a specific business functionality and can be developed, deployed, and scaled independently. In contrast to Monolithic Architecture that lacks modularity, and Service-Oriented Architecture (SOA), which is more coarse-grained and is prone to a single point of failure, the Microservice architecture offers better support for modularity, independent deployment and distributed development that often uses Conway’s law to organize teams based on the Microservice architecture. However, Microservice architecture introduces several challenges in terms of:
Network Complexity: Microservices communicate over the network, increasing the likelihood of network-related issues (See Fallacies of distributed computing).
Distributed System Challenges: Managing a distributed system introduces complexities in terms of synchronization, data consistency, and handling partial failures.
Monitoring and Troubleshooting: Due to the distributed nature, monitoring and troubleshooting can become more complex, requiring specialized tools and practices.
Potential for Cascading Failures: Failure in one service can lead to failures in dependent services if not handled properly.
Microservices Challenges
Faults, Errors and Failures
The challenges associated with microservice architecture manifest at different stages require understanding concepts of faults, errors and failures:
1. Faults:
Faults in a microservice architecture could originate from various sources, including:
Software Bugs: A defect in one service may cause incorrect behavior but remain dormant until triggered.
Network Issues: Problems in network connectivity can be considered faults, waiting to lead to errors.
Configuration Mistakes: Incorrect configuration of a service is another potential fault.
Dependency Vulnerabilities: A weakness or vulnerability in an underlying library or service that hasn’t yet caused a problem.
Following are major concerns that the Microservice architecture must address for managing faults:
Loose Coupling and Independence: With services being independent, a fault in one may not necessarily impact others, provided the system is designed with proper isolation.
Complexity: Managing and predicting faults across multiple services and their interactions can be complex.
Isolation: Properly isolating faults can prevent them from causing widespread problems. For example, a fault in one service shouldn’t impact others if isolation is well implemented.
Detecting and Managing Faults: Given the distributed nature of microservices, detecting and managing faults can be complex.
2. Error:
When a fault gets activated under certain conditions, it leads to an error. In microservices, errors can manifest as:
Communication Errors: Failure in service-to-service communication due to network problems or incompatible data formats.
Data Inconsistency: An error in one service leading to inconsistent data across different parts of the system.
Service Unavailability: A service failing to respond due to an internal error.
Microservice architecture should include diagnosing and handling errors including:
Propagation: Errors can propagate quickly across services, leading to cascading failures if not handled properly.
Transient Errors: Network-related or temporary errors might be resolved by retries, adding complexity to error handling.
Monitoring and Logging Challenges: Understanding and diagnosing errors in a distributed system can be more complex.
3. Failure:
Failure is the inability of a system to perform its required function due to unhandled errors. In microservices, this might include:
Partial Failure: Failure of one or more services leading to degradation in functionality.
Total System Failure: Cascading errors causing the entire system to become unavailable.
Further, failure handling in Microservice architecture poses additional challenges such as:
Cascading Failures: A failure in one service might lead to failures in others, particularly if dependencies are tightly interwoven and error handling is insufficient.
Complexity in Recovery: Coordinating recovery across multiple services can be challenging.
The faults and errors can be further categorized into customer related and system related:
Customer-Related: These may include improper usage of an API, incorrect input data, or any other incorrect action taken by the client. These might include incorrect input data, calling an endpoint that doesn’t exist, or attempting an action without proper authorization. Since these errors are often due to incorrect usage, simply retrying the same request without fixing the underlying issue is unlikely to resolve the error. For example, if a customer sends an invalid parameter, retrying the request with the same invalid parameter will produce the same error. In many cases, customer errors are returned with specific HTTP status codes in the 4xx range (e.g., 400 Bad Request, 403 Forbidden), indicating that the client must modify the request before retrying.
System-Related: These can stem from various aspects of the microservices, such as coding bugs, network misconfigurations, a timeout occurring, or issues with underlying hardware. These errors are typically not the fault of the client and may be transient, meaning they could resolve themselves over time or upon retrying. System errors often correlate with HTTP status codes in the 5xx range (e.g., 500 Internal Server Error, 503 Service Unavailable), indicating an issue on the server side. In many cases, these requests can be retried after a short delay, possibly succeeding if the underlying issue was temporary.
Causes Related to Faults, Errors and Failures
The challenges in microservice architecture are rooted in its distributed nature, complexity, and interdependence of services. Here are common causes of the challenges related to faults, errors, and failures, including the distinction between customer and system errors:
1. Network Complexity:
Cause: Multiple services communicating over the network where one of the service cannot communicate with other service. For example, Amazon Simple Storage Service (S3) had an outage in Feb 28, 2017 and many services that were tightly coupled failed as well due to limited fault isolation. The post-mortem analysis recommended proper fault isolation, redundancy across regions, and better understanding and managing complex inter-service dependencies.
Challenges: Leads to network-related issues, such as latency, bandwidth limitations, and network partitioning, causing both system errors and potentially triggering faults.
2. Data Consistency:
Cause: Maintaining data consistency across services that use different databases. This can occur where a microservice stores data in multiple data stores without proper anti-entropy validation or uses eventual consistency, e.g. a trading firm might be using CQRS pattern where transaction events are persisted in a write datastore, which is then replicated to a query datastore so user may not see up-to-date data when querying recently stored data.
Challenges: Ensuring transactional integrity and eventual consistency can be complex, leading to system errors if not managed properly.
3. Service Dependencies:
Cause: Tight coupling between services. For example, an online travel booking platform might deploy multiple microservices for managing hotel bookings, flight reservations, car rentals, etc. If these services are tightly coupled, then a minor update to the flight reservation service unintentionally may break the compatibility with the hotel booking service.
Challenges: Cascading failures and difficulty in isolating faults. A failure in one service can easily propagate to others if not properly isolated.
4. Scalability Issues:
Cause: Individual services may require different scaling strategies. For example, Netflix in Oct 29, 2012 suffered a major outage when due to a scaling issue, the Amazon Elastic Load Balancer (ELB) that was used for routing couldn’t route requests effectively. The lessons learned from the incident included improved scaling strategies, redundancy and failover planning, and monitoring and alerting enhancements.
Challenges: Implementing effective scaling without affecting other services or overall system stability. Mismanagement can lead to system errors or even failures.
5. Security Concerns:
Cause: Protecting the integrity and confidentiality of data as it moves between services. For example, on July 19, 2019, CapitalOne had a major security breach for its data that was stored on AWS. A former AWS employee discovered a misconfigured firewall and exploited it, accessing sensitive customer data. The incident caused significant reputational damage and legal consequences to CapitalOne, which then worked on a broader review of security practices, emphasizing the need for proper configuration, monitoring, and adherence to best practices.
Challenges: Security breaches or misconfigurations could be seen as faults, leading to potential system errors or failures.
6. Monitoring and Logging:
Cause: The need for proper monitoring and logging across various independent services to gain insights when microservices are misbehaving. For example, if a service is silently behaving erratically, causing intermittent failures for customers will lead to more significant outage and longer time to diagnose and resolve due to lack of proper monitoring and logging.
Challenges: Difficulty in tracking and diagnosing both system and customer errors across different services.
7. Configuration Management:
Cause: Managing configuration across multiple services. For example, July 20, 2021, WizCase discovered unsecured Amazon S3 buckets containing data from more than 80 US locales, predominantly in New England. The misconfigured S3 buckets included more than 1,000GB of data and more than 1.6 million files. Residents’ actual addresses, telephone numbers, IDs, and tax papers were all exposed due to the attack. On October 5, 2021, Facebook had nearly six hours due to misconfigured DNS and PGP settings. Oasis cites misconfiguration as a top root cause for security incidents and events.
Challenges: Mistakes in configuration management can be considered as faults, leading to errors and potentially failures in one or more services.
8. API Misuse (Customer Errors):
Cause: Clients using the API incorrectly, sending improper requests. For example, on October 21, 2016, Dyn experienced a massive Distributed Denial of Service (DDoS) attack, rendering a significant portion of the internet inaccessible for several hours. High-profile sites, including Twitter, Reddit, and Netflix, experienced outages. The DDoS attack was primarily driven by the Mirai botnet, which consisted of a large number of compromised Internet of Things (IoT) devices like security cameras, DVRs, and routers. These devices were vulnerable because of default or easily guessable passwords. The attackers took advantage of these compromised devices and used them to send massive amounts of traffic to Dyn’s servers, especially by abusing the devices’ APIs to make repeated and aggressive requests. The lessons learned included better IoT security, strengthening infrastructure and adding API guardrails such as built-in security and rate-limiting.
Challenges: Handling these errors gracefully to guide clients in correcting their requests.
9. Service Versioning:
Cause: Multiple versions of services running simultaneously. For example, conflicts between the old and new versions may lead to unexpected behavior in the system. Requests routed to the new version might be handled differently than those routed to the old version, causing inconsistencies.
Challenges: Compatibility issues between different versions can lead to system errors.
10. Diverse Technology Stack:
Cause: Different services might use different languages, frameworks, or technologies. For example, the diverse technology stack may cause problems with inconsistent monitoring and logging, different vulnerability profiles and security patching requirement, leading to increased complexity in managing, monitoring, and securing the entire system.
Challenges: Increases complexity in maintaining, scaling, and securing the system, which can lead to faults.
11. Human Factors:
Cause: Errors in development, testing, deployment, or operations. For example, Amazon Simple Storage Service (S3) had an outage in Feb 28, 2017, which was caused by a human error during the execution of an operational command. A typo in a command executed by an Amazon team member intended to take a small number of servers offline inadvertently removed more servers than intended.and many services that were tightly coupled failed as well due to limited fault isolation. The post-mortem analysis recommended implementing safeguards against both human errors and system failures.
Challenges: Human mistakes can introduce faults, lead to both customer and system errors, and even cause failures if not managed properly.
12. Lack of Adequate Testing:
Cause: Insufficient unit, integration, functional, and canary testing. For example, on August 1, 2012, Knight Capital deployed untested software to a production environment, resulting in a malfunction in their automated trading system. The flawed system started buying and selling millions of shares at incorrect prices. Within 45 minutes, the company incurred a loss of $440 million. The code that was deployed to production was not properly tested. It contained old, unused code that should have been removed, and the new code’s interaction with existing systems was not fully understood or verified. The lessons learned included ensuring that all code, especially that which controls critical functions, is thoroughly tested, implementing robust and consistent deployment procedures to ensure that changes are rolled out uniformly across all relevant systems, and having mechanisms in place to quickly detect and halt erroneous behavior, such as a “kill switch†for automated trading systems.
Challenges: Leads to undetected faults, resulting in both system and customer errors, and potentially, failures in production.
13. Inadequate Alarms and Health Checks:
Cause: Lack of proper monitoring and health check mechanisms. For example, on January 31, 2017, GitLab suffered a severe data loss incident. An engineer accidentally deleted a production database while attempting to address some performance issues. This action resulted in a loss of 300GB of user data. GitLab’s monitoring and alerting system did not properly notify the team of the underlying issues that were affecting database performance. The lack of clear alarms and health checks contributed to the confusion and missteps that led to the incident. The lessons learned included ensuring that health checks and alarms are configured to detect and alert on all critical conditions, and establishing and enforcing clear procedures and protocols for handling critical production systems, including guidelines for dealing with performance issues and other emergencies.
Challenges: Delays in identifying and responding to faults and errors, which can exacerbate failures.
14. Lack of Code Review and Quality Control:
Cause: Insufficient scrutiny during the development process. For example, on March 14, 2012, the Heartbleed bug was introduced with the release of OpenSSL version 1.0.1 but it was not discovered until April 2014. The bug allowed attackers to read sensitive data from the memory of millions of web servers, potentially exposing passwords, private keys, and other sensitive information. The bug was introduced through a single coding error. There was a lack of rigorous code review process in place to catch such a critical mistake. The lessons learned included implementing a thorough code review process, establishing robust testing and quality control measures to ensure that all code, especially changes to security-critical areas, is rigorously verified.
Challenges: Increases the likelihood of introducing faults and bugs into the system, leading to potential errors and failures.
15. Lack of Proper Test Environment:
Cause: Absence of a representative testing environment. For example, on August 1, 2012, Knight Capital deployed new software to a production server that contained obsolete and nonfunctional code. This code accidentally got activated, leading to unintended trades flooding the market. The algorithm was buying high and selling low, the exact opposite of a profitable strategy. The company did not have a proper testing environment that accurately reflected the production environment. Therefore, the erroneous code was not caught during the testing phase. The lessons learned included ensuring a robust and realistic testing environment that accurately mimics the production system, implementing strict and well-documented deployment procedures and implementing real-time monitoring and alerting to catch unusual or erroneous system behavior.
Challenges: Can lead to unexpected behavior in production due to discrepancies between test and production environments.
16. Elevated Permissions:
Cause: Overly permissive access controls. For example, on July 19, 2019, CapitalOne announced that an unauthorized individual had accessed the personal information of approximately 106 million customers and applicants. The breach occurred when a former employee of a third-party contractor exploited a misconfigured firewall, gaining access to data stored on Amazon’s cloud computing platform, AWS. The lessons learned included implementing the principle of least privilege, robust monitoring to detect and alert on suspicious activities quickly, and evaluating the security practices of third-party contractors and vendors.
Challenges: Increased risk of security breaches and unauthorized actions, potentially leading to system errors and failures.
17. Single Point of Failure:
Cause: Reliance on a single component without redundancy. For example, on January 31, 2017, GitLab experienced a severe data loss incident when an engineer while attempting to remove a secondary database, the primary production database was engineer deleted. The primary production database was a single point of failure in the system. The deletion of this database instantly brought down the entire service. Approximately 300GB of data was permanently lost, including issues, merge requests, user accounts, comments, and more. The lessons learned included eliminating single points of failure, implementing safeguards to protect human error, and testing backups.
Challenges: A failure in one part can bring down the entire system, leading to cascading failures.
18. Large Blast Radius:
Cause: Lack of proper containment and isolation strategies. For example, on September 4, 2018, the Azure South Central U.S. datacenter experienced a significant outage affecting multiple regions. A severe weather event in the southern United States led to cooling failures in one of Azure’s data centers. Automated systems responded to the cooling failure by shifting loads to a data center in a neighboring region. This transfer was larger and faster than anticipated, leading to an overload in the secondary region. The lessons learned included deep understanding of dependencies and failure modes, limiting the blast radius, and continuous improvements in resilience.
Challenges: An error in one part can affect a disproportionate part of the system, magnifying the impact of failures.
19. Throttling and Limits Issues:
Cause: Inadequate management of request rates and quotas. For example, on February 28, 2017, AWS S3 experienced a significant disruption in the US-EAST-1 region, causing widespread effects on many dependent systems. A command to take a small number of servers offline for inspection was executed incorrectly, leading to a much larger removal of capacity than intended. Once the servers were inadvertently removed, the S3 subsystems had to be restarted. The restart process included safety checks, which required specific metadata. However, the capacity removal caused these metadata requests to be throttled. Many other systems were dependent on the throttled subsystem, and as the throttling persisted, it led to a cascading failure. The lessons learned included safeguards against human errors, dependency analysis, and testing throttling mechanisms.
Challenges: Can lead to service degradation or failure under heavy load.
20. Rushed Releases:
Cause: Releasing changes without proper testing or review. For example, on January 31, 2017, GitLab experienced a severe data loss incident. A series of events that started with a rushed release led to an engineer accidentally deleting a production database, resulting in the loss of 300GB of user data. The team was working on addressing performance issues and pushed a release without properly assessing the risks and potential side effects. The team was working on addressing performance issues and pushed a release without properly assessing the risks and potential side effects. The lessons learned included avoiding rushed decisions, clear separation of environments, proper access controls, and robust backup strategy.
Challenges: Increases the likelihood of introducing faults and errors into the system.
21. Excessive Logging:
Cause: Logging more information than necessary. For example, excessive logs can result in disk space exhaustion, performance degradation, service disruption or high operating cost due to additional network bandwidth and storage costs.
Challenges: Can lead to performance degradation and difficulty in identifying relevant information.
22. Circuit Breaker Mismanagement:
Cause: Incorrect implementation or tuning of circuit breakers. For example, on November 18, 2014, Microsoft Azure suffered a substantial global outage affecting multiple services. An update to Azure’s Storage Service included a change to the configuration file governing the circuit breaker settings. The flawed update led to an overly aggressive tripping of circuit breakers, which, in turn, led to a loss of access to the blob front-ends. The lessons learned incremental rollouts, thorough testing of configuration changes, clear understanding of component interdependencies.
Challenges: Potential system errors or failure to protect the system during abnormal conditions.
23. Retry Mechanism:
Cause: Mismanagement of retry logic. For example, on September 20, 2015, an outage in DynamoDB led to widespread disruption across various AWS services. The root cause was traced back to issues related to the retry mechanism. A small error in the system led to a slight increase in latency. Due to an aggressive retry mechanism, the slightly increased latency led to a thundering herd problem where many clients retried their requests almost simultaneously.The absence of jitter (randomization) in the retry delays exacerbated this surge of requests because retries from different clients were synchronized. The lessons learned included proper retry logic with jitter, understanding dependencies, and enhancements to monitoring and alerting.
Challenges: Can exacerbate network congestion and failure conditions, particularly without proper jitter implementation.
24. Backward Incompatible Changes:
Cause: Introducing changes that are not backward compatible. For example, on August 1, 2012, Knight Capital deployed new software to a production environment. This software was intended to replace old, unused code but was instead activated, triggering old, defective functionality. The new software was not compatible with the existing system, and instead of being deactivated, the old code paths were unintentionally activated. The incorrect software operation caused Knight Capital to loss of over $460 million in just 45 minutes. The lessons learned included proper testing, processes for deprecating old code, and robust monitoring and rapid response mechanism.
Challenges: Can break existing clients and other services, leading to system errors.
25. Inadequate Capacity Planning:
Cause: Failure to plan for growth or spikes in usage. For example, on October 21, 2018, GitHub experienced a major outage that lasted for over 24 hours. During this period, various services within GitHub were unavailable or severely degraded. The incident was caused by inadequate capacity planning as GitHub’s database was operating close to its capacity. A routine maintenance task to replace a failing 100G network link set off a series of events that caused the database to failover to a secondary. This secondary didn’t have enough capacity to handle the production load, leading to cascading failures. The lessons learned included capacity planning, regular review of automated systems and building redundancy in critical components.
Challenges: Can lead to system degradation or failure under increased load.
26. Lack of Failover Isolation:
Cause: Insufficient isolation between primary and failover mechanisms. For example, on September 4, 2018, the Azure South Central U.S. datacenter experienced a significant outage. The Incident was caused by a lightning, which resulted in a voltage swell that impacted the cooling systems, causing them to shut down. Many services that were only hosted in this particular region went down completely, showing a lack of failover isolation between regions. The lessons learned included redundancy in critical systems, cross-region failover strategies, and regular testing of failover procedures.
Challenges: Can lead to cascading failures if both primary and failover systems are affected simultaneously.
27. Noise in Metrics and Alarms:
Cause: Too many irrelevant or overly sensitive alarms and metrics. Over time, the number of metrics and alarms may grow to a point where there are thousands of alerts firing every day, many of them false positives or insignificant. The noise level in the alerting system becomes overwhelming. For example, if many alarms are set with thresholds too close to regular operating parameters, they may cause frequent false positives. The operations team became desensitized to alerts, treating them as “normal.” The lessons learned include focusing on the most meaningful metrics and alerts, and regular review and adjust alarm thresholds and relevance to ensure they remain meaningful.
Challenges: Can lead to alert fatigue and hinder the prompt detection and response to real issues, increasing the risk of system errors and failures going unaddressed.
28. Variations Across Environments:
Cause: Differences between development, staging, and production environments. For example, a development team might be using development, testing, staging, and production environments, allowing them to safely develop, test, and deploy their services. However, production environment might be using different versions of database or middleware, using different network topology or production data is different, causing unexpected behaviors that leads to a significant outage.
Challenges: May lead to unexpected behavior and system errors, as code behaves differently in production compared to the test environment.
29. Inadequate Training or Documentation:
Cause: Lack of proper training, guidelines, or documentation for developers and operations teams. For example, if the internal team is not properly trained on the complexities of the microservices architecture, it can lead to misunderstandings of how services interact. Without proper training or documentation, the team may take a significant amount of time to identify the root causes of the issues.
Challenges: Can lead to human-induced faults, misconfiguration, and inadequate response to incidents, resulting in errors and failures.
30. Self-Inflicted Traffic Surge:
Cause: Uncontrolled or unexpected increase in internal traffic, such as excessive inter-service calls. For example, on January 31st 2017, GitLab experienced an incident that, while primarily related to data deletion, also demonstrated a form of self-inflicted traffic surge. While attempting to restore from a backup, a misconfiguration in the application caused a rapid increase in requests to the database. The lessons learned included testing configurations in an environment that mimics production, robust alerting and monitoring, clear understanding of interactions between components.
Challenges: Can overload services, causing system errors, degradation, or even failure.
31. Lack of Phased Deployment:
Cause: Releasing changes to all instances simultaneously without gradual rollout. For example, on August 1, 2012, Knight Capital deployed new software to a production environment. The software was untested in this particular environment, and an old, incompatible module was accidentally activated. The software was deployed to all servers simultaneously instead of gradually rolling it out to observe potential issues. The incorrect software operation caused Knight Capital to accumulate a massive unintended position in the market, resulting in a loss of over $440 million and a significant impact to its reputation. The lessons learned included phased deployment, thorough testing and understanding dependencies.
Challenges: Increases the risk of widespread system errors or failures if a newly introduced fault is triggered.
32. Broken Rollback Mechanisms:
Cause: Inability to revert to a previous stable state due to faulty rollback procedures. For example, a microservice tries to deploy a new version but after the deployment, issues are detected, and the decision is made to rollback. However, the rollback process fails, exacerbating the problem and leading to an extended outage.
Challenges: Can exacerbate system errors or failures during an incident, as recovery options are limited.
33. Inappropriate Timing:
Cause: Deploying new changes during critical periods such as Black Friday. For example, on Black Friday in 2014, Best Buy’s website experienced multiple outages throughout the day, which was caused by some maintenance or deployment actions that coincided with the traffic surge. Best Buy took the site down intermittently to address the issues, which, while necessary, only exacerbated the outage durations for customers. The lessons learned included avoiding deployments on critical days, better capacity planning and employing rollback strategies.
Challenges: Deploying significant changes or conducting maintenance during high-traffic or critical periods can lead to catastrophic failures.
The myriad potential challenges in microservice architecture reflect the complexity and diversity of factors that must be considered in design, development, deployment, and operation. By recognizing and addressing these causes proactively through robust practices, thorough testing, careful planning, and vigilant monitoring, teams can greatly enhance the resilience, reliability, and robustness of their microservice-based systems.
Incident Metrics
In order to prevent common causes of service faults and errors, Microservice environment can track following metrics:
1. MTBF (Mean Time Between Failures):
Prevent: By analyzing MTBF, you can identify patterns in system failures and proactively address underlying issues to enhance stability.
Detect: Monitoring changes in MTBF may help in early detection of emerging problems or degradation in system health.
Resolve: Understanding MTBF can guide investments in redundancy and failover mechanisms to ensure continuous service even when individual components fail.
2. MTTR (Mean Time to Repair):
Prevent: Reducing MTTR often involves improving procedures and tools for diagnosing and fixing issues, which also aids in preventing failures by addressing underlying faults more efficiently.
Detect: A sudden increase in MTTR can signal that something has changed within the system, such as a new fault that’s harder to diagnose, triggering a deeper investigation.
Resolve: Lowering MTTR directly improves recovery by minimizing the time it takes to restore service after a failure. This can be done through automation, streamlined procedures, and robust rollback strategies.
3. MTTA (Mean Time to Acknowledge):
Prevent: While MTTA mainly focuses on response times, reducing it can foster a more responsive monitoring environment, helping to catch issues before they escalate.
Detect: A robust monitoring system that allows for quick acknowledgment can speed up the detection of failures or potential failures.
Resolve: Faster acknowledgment of issues means quicker initiation of resolution processes, which can help in restoring the service promptly.
4. MTTF (Mean Time to Failure):
Prevent: MTTF provides insights into the expected lifetime of a system or component. Regular maintenance, monitoring, and replacement aligned with MTTF predictions can prevent unexpected failures.
Detect: Changes in MTTF patterns can provide early warnings of potential failure, allowing for pre-emptive action.
Resolve: While MTTF doesn’t directly correlate with resolution, understanding it helps in planning failover strategies and ensuring that backups or redundancies are in place for anticipated failures.
Implementing These Metrics:
Utilizing these metrics in a microservices environment requires:
Comprehensive Monitoring: Continual monitoring of each microservice to gather data.
Alerting and Automation: Implementing automated alerts and actions based on these metrics to ensure immediate response.
Regular Review and Analysis: Periodic analysis to derive insights and make necessary adjustments to both the system and the process.
Integration with Incident Management: Linking these metrics with incident management to streamline detection and resolution.
By monitoring these metrics and integrating them into the daily operations, incident management, and continuous improvement processes, organizations can build more robust microservice architectures capable of preventing, detecting, and resolving failures efficiently.
Development Procedures
A well-defined process is essential for managing the complexities of microservices architecture, especially when it comes to preventing, detecting, and resolving failures. This process typically covers various stages, from setting up monitoring and alerts to handling incidents, troubleshooting, escalation, recovery, communication, and continuous improvement. Here’s how such a process can be designed, including specific steps to follow when an alarm is received about the health of a service:
1. Preventing Failures:
Standardizing Development Practices: Creating coding standards, using automated testing, enforcing security guidelines, etc.
Implementing Monitoring and Alerting: Setting up monitoring for key performance indicators and establishing alert thresholds.
Regular Maintenance and Health Checks: Scheduling periodic maintenance, updates, and health checks to ensure smooth operation.
Operational Checklists: Maintaining a checklist for operational readiness such as:
Review requirements, API specifications, test plans and rollback plans.
Review logging, monitoring, alarms, throttling, feature flags, and other key configurations.
Document and understand components of a microservice and its dependencies.
Define key operational and business metrics for the microservice and setup a dashboard to monitor health metrics.
Review authentication, authorization and security impact for the service.
Review data privacy, archival and retention policies.
Define failure scenarios and impact to other services and customers.
Document capacity planning for scalability, redundancy to eliminate single point of failures and failover strategies.
2. Detecting Failures:
Real-time Monitoring: Constantly watching system metrics to detect anomalies.
Automated Alerting: Implementing automated alerts that notify relevant teams when an anomaly or failure is detected.
3. Responding to Alarms and Troubleshooting:
When an alarm is received:
Acknowledge the Alert: Confirm the reception of the alert and log the incident.
Initial Diagnosis: Quickly assess the scope, impact, and potential cause of the issue.
Troubleshooting: Follow a systematic approach to narrow down the root cause, using tools, logs, and predefined troubleshooting guides.
Escalation (if needed): If the issue cannot be resolved promptly, escalate to higher-level teams or experts, providing all necessary information.
4. Recovery and Mitigation:
Implement Immediate Mitigation: Apply temporary fixes to minimize customer impact.
Recovery Actions: Execute recovery plans, which might include restarting services, reallocating resources, etc.
Rollback (if needed): If a recent change caused the failure, initiate a rollback to a stable version, following predefined rollback procedures.
5. Communication:
Internal Communication: Keep all relevant internal stakeholders informed about the status, actions taken, and expected resolution time.
Communication with Customers: If the incident affects customers, communicate transparently about the issue, expected resolution time, and any necessary actions they need to take.
6. Post-Incident Activities:
Post-mortem Analysis: Conduct a detailed analysis of the incident, identify lessons learned, and update procedures as needed.
Continuous Improvement: Regularly review and update the process, including the alarm response and troubleshooting guides, based on new insights and changes in the system.
A well-defined process for microservices not only provides clear guidelines on development and preventive measures but also includes detailed steps for responding to alarms, troubleshooting, escalation, recovery, and communication. Such a process ensures that the team is prepared and aligned when issues arise, enabling rapid response, minimizing customer impact, and fostering continuous learning and improvement.
Post-Mortem Analysis
When a failure or an incident occurs in a microservice, the development team will need to follow a post-mortem process for analyzing and evaluating an incident or failure. Here’s how post-mortems help enhance fault tolerance:
1. Understanding Root Causes:
A post-mortem helps identify the root cause of a failure, not just the superficial symptoms. By using techniques like the “5 Whys,” teams can delve deep into the underlying issues that led to the fault, such as coding errors, network latency, or configuration mishaps.
2. Assessing Impact and Contributing Factors:
Post-mortems enable the evaluation of the full scope of the incident, including customer impact, affected components, and contributing factors like environmental variations. This comprehensive view allows for targeted improvements.
3. Learning from Failures:
By documenting what went wrong and what went right during an incident, post-mortems facilitate organizational learning. This includes understanding the sequence of events, team response effectiveness, tools and processes used, and overall system resilience.
4. Developing Actionable Insights:
Post-mortems result in specific, actionable recommendations to enhance system reliability and fault tolerance. This could involve code refactoring, infrastructure upgrades, or adjustments to monitoring and alerting.
5. Improving Monitoring and Alerting:
Insights from post-mortems can be used to fine-tune monitoring and alerting systems, making them more responsive to specific failure patterns. This enhances early detection and allows quicker response to potential faults.
6. Fostering a Culture of Continuous Improvement:
Post-mortems encourage a blame-free culture focused on continuous improvement. By treating failures as opportunities for growth, teams become more collaborative and proactive in enhancing system resilience.
7. Enhancing Documentation and Knowledge Sharing:
The documentation produced through post-mortems is a valuable resource for the entire organization. It can be referred to when similar incidents occur, or during the onboarding of new team members, fostering a shared understanding of system behavior and best practices.
Conclusion
The complexity and interdependent nature of microservice architecture introduce specific challenges in terms of management, communication, security, and fault handling. By adopting robust measures for prevention, detection, and recovery, along with adhering to development best practices and learning from post-mortems, organizations can significantly enhance the fault tolerance and resilience of their microservices. A well-defined, comprehensive approach that integrates all these aspects ensures a more robust, flexible, and responsive system, capable of adapting and growing with evolving demands.
This blog summarizes learnings from Systems Performance by Brendan Gregg that covers concepts, tools, and performance tuning for operating systems and applications.
1. Introduction
This chapter introduces Systems Performance including all major software and hardware components with goals to improve the end-user experience by reducing latency and computing cost. The author describes challenges for performance engineering such as subjectivity without clear goals, complexity that requires holistic approach, multiple causes, and multiple performance issues. The author defines key concepts for performance such as:
Latency: measurement of time spent waiting and it allows maximum speedup to be estimated.
Observability: refers to understanding a system through observation and includes that use counters, profiling, and tracing. This relies on counters, statistics, and metrics, which can be used to trigger alerts by the monitoring software. The profiling performs sampling to paint the picture of target. Tracing is event-based recording, where event data is captured and saved for later analysis using static instrumentation or dynamic instrumentation. The latest dynamic tools use BPF (Berkley Packet Filter) to build dynamic tracing, which is also referred as eBPF.
Experimentation tools: benchmark tools that test a specific component, e.g. following example performs a TCP network throughput:
iperf -c 192.168.1.101 -i 1 -t 10
The chapter also describes common Linux tools for analysis such as:
dmesg -T | tail
vmstat -SM 1
mpstat -P ALL 1
pidstat 1
iostat -sxz 1
free -m
sar -n DEV 1
sar -n TCP,ETCP 1
2. Methodologies
This chapter introduces common performance concepts such as IOPS, throughput, response-time, latency, utilization, saturation, bottleneck, workload, and cache. It defines following models of system performance like System under Test and Queuing System shown below:
System Under TestQueuing System
The chapter continues with defining concepts such as latency, time-scales, trade-offs, tuning efforts, load vs architecture, scalability, and metrics. It defines utilization based on time as:
U = B / T
where U = utilization, B = total-busy-time, T = observation period
and in terms of capacity, e.g.
U = % used capacity
The chapter defines saturation as the degree to which a resource has queued work it cannot service and defines caching considerations to improve performance such as hit ratio, cold-cache, warm-cache, and hot-cache.
The author then describes analysis perspectives and defines resource analysis that begins with analysis of the system resources for investigating performance issues and capacity planning, and workload analysis that examines the performance of application for identifying and confirming latency issues. Next, author describes following methodologies for analysis:
Streetlight Anti-Method: It is an absence of a deliberate methodology and user analyzes a familiar tool but can be a hit or miss.
Random Change Anti-Method: In this approach, user randomly guesses where the problems may be and then changes things until it goes away.
Blame-Someone-Else Anti-Method: In this approach, user blames someone else and redirects the issue to another team.
Ad Hoc Checklist Method: It’s a common methodology where a user uses an ad hoc list built from recent experience.
Problem Statement: It defines the problem statement based on if there has been a performance issue; what was changed recently; who are being affected; etc.
Scientific Method: This approach is summarized as: Question -> Hypothesis -> Prediction -> Test -> Analysis.
Diagnostic Cycle: This is defined as hypothesis -> instrumentation -> data -> hypothesis.
Tools Method: This method lists available performance tools; gather metrics from each tool; and then interpret the metrics collected.
Utilization, Saturation, and Errors (USE) Method: This method focuses on system resources and checks utilization, saturation and errors for each resource.
RED Method: This approach checks request rate, errors, and duration for every service.
Workload Characteristics: This approach answers questions about Who is causing the load; why is the load being called; what are the load characteristics?
Drill-Down Analysis: This approach defines three-stage drill-down analysis methodology for system resource: Monitoring, Identification, Analysis.
Latency Analysis: This approach examines the time taken to complete an operation and then breaks it into smaller components, continuing to subdivide the components.
Method R: This methodology developed for Oracle database that focuses on finding the origin of latency.
Modeling
The chapter then defines analytical modeling of a system using following techniques:
Enterprise vs Cloud
Visual Identification uses graphs to identify patterns for linear scalability, contention, coherence (propagation of changes), knee-point (where performance stops scaling linearly), scalability ceiling.
Admdahl’s Law of Scalability describes content for the serial resource:
C(N) = N / (1 + a(N - 1))
where C(N) is relative capacity, N is scaling dimension such as number of CPU, and a is degree of seriality.
Universal Scalability Law is described as:
C(N) = N / (1 + a(N - 1) + bN(N - 1))
where b is the coherence parameter and when b = 0, it becomes Amdahl's Law
Queuing Theory describes Little’s Law as:
L = lambda * W
where L is average number of requests in the system, lambda is average arrival rate, and W is average request time.
Queuing System
Capacity Planning
This section describes Capacity Planning for examining how system will handle load and will scale as load scales. It searches for a resource that will become the bottleneck under load including hardware and software components. It then applies factor analysis to determine what factors to change to achieve the desired performance.
Statistics
This section reviews how to use statistics for analysis such as:
Quantifying Performance Gains: using observation-based and experimentation-based techniques to compare performance improvements.
Averages: including geometric-mean (nth root of multiplied values), harmonic-mean (count of values divided by sum of their reciprocals), average over time, decayed average (recent time weighed more).
Standard Deviation, Percentile, Median
Coefficient of Variations
Multimodal Distribution
Monitoring
Monitoring records performance statistics over time for comparison and identification using various time-based patterns such as hourly, daily, weekly, and yearly.
Visualization
This section examines various visualization graphs such as line-chart, scatter-plots, heat-maps, timeline-charts, and surface plot.
3. Operating Systems
This chapter examines operating system and kernel for system performance analysis and defines concepts such as:
Background
Kernel
Kernel is the core of operating system and though Linux and BSED have a monolithic kernel but other kernel models include micokernels, unikernels and hybrid kernels. In addition, new Linux versions include extended BPF for enabling secure kernel-mode applications.
Kernel and User Modes
The kernel runs in a kernel mode to access devices and execution of the privileged instructions. User applications run in a user mode where they can request privileged operations using system calls such as ioctl, mmap, brk, and futex.
Interrupts
An interrupt is a single to the processor that some event has occurred that needs processing, and interrupts the current execution of the processor and runs interrupt service routine to handle the event. The interrupts can be asynchronous for handling interrupt service requests (IRQ) from hardware devices or synchronous generated by software instructions such as traps, exceptions, and faults.
Clocks and Idle
In old kernel implementations, tick latency and tick overhead caused some performance issues but modern implementations have moved much functionality out of the clock routine to on-demand interrupts to create tickless kernel for improving power efficiency.
Processes
A process is an environment for executing a user-level program and consists of memory address space, file descriptors, thread stacks, and registers. A process contains one or more threads, where each thread has a stack, registers and an instruction pointer (PC). Processes are normally created using fork system call that wraps around clone and exec/execve system call.
Stack
A stack is a memory storage area for temporary data, organized as last-in, first-out (FIFO) list. It is used to store the return address when calling a function and passing parameters to function, which is also referred as a stack frame. The call path can be seen by examining saved return addresses across all the stack frames, which is called stack trace or stack back trace. While executing a system call, a process thread has two stacks: a user-level stack and a kernel-level stack.
Virtual Memory
Virtual memory is an abstraction of main memory, providing processes and the kernel with their own private view of main memory. It supports multitasking of threads and over-subscription of main memory. The kernel manages memory using process-swapping and paging schemes.
Schedulers
The scheduler schedules processes on processors by dividing CPU time among the active processes and threads. The scheduler tracks all threads in the read-to-run state in run priority-queues where process priority can be modified to improve performance of the workload. Workloads are categorized as either CPU-bound or I/O bound and scheduler may decrease the priority of CPU-bound processes to allow I/O-bound workloads to run sooner.
File Systems
File systems are an organization of data as files and directories. The virtual file system (VFS) abstracts file system types so that multiple file systems may coexist.
Kernels
This section discusses Unix-like kernel implementations with a focus on performance such as Unix, BSD, and Solaris. In the context of Linux, it describes systemd, which is a commonly used service manager to replace original UNIX init system and extended BPF that can be used for networking, observability, and security. BPF programs run in kernel model and are configured to run on events like USDT probes, kprobes, uprobes, and perf_events.
4. Observability Tools
This chapter identifies static performance and crises tools including their overhead like counters, profiling, and tracing.
Tools Coverage
This section describes static performance tools like sysctl, dmesg, lsblk, mdadm, ldd, tc, etc., and crisis tools like vmstat, ps, dmesg, lscpu, iostat, mpstat, pidstat, sar, and more.
Tools Type
The observability tool can categorized as a system-wide, per-process observability or counters/events based, e.g. top shows system-wide summary; ps, pmap are maintained per-process; and profilers/tracers are event-based tools. Kernel maintains various counters that are incremented when events occur such as network packets received, disk I/O, etc. Profiling collects a set of samples such as CPU usage at fixed-rate or based on untimed hardware events, e.g., perf, profile are system-wide profilers, and gprof and cachegrind are per-process profilers. Tracing instruments occurrence of an event, and can store event-based details for later analysis. Examples of system-wide tracing tools include tcpdump, biosnoop, execsnoop, perf, ftrace and bpftrace, and examples of per-process tracing tools include strace and gdb. Monitoring records statistics continuously for later analysis, e.g. sar, prometheus, collectd are common tools for monitoring.
Observability Sources
The main sources of system performance include /proc and /sys. The /proc is a file system for kernel statistics and is created dynamically by the kernel. For example, ls -F /proc/123 lists per-process statistics for process with PID 123 like limits, maps, sched, smaps, stat, status, cgroup and task. Similarly, ls -Fd /proc/[a-z]* lists system-wide statistics like cpuinfo, diskstats, loadavg, meminfo, schedstats, and zoneinfo. The /sys was originally designed for device-driver statistics but has been extended for other types of statistics, e.g. find /sys/devices/system/cpu/cpu0 -type f provides information about CPU caches. Tracepoints are Linux kernel event source based on static instrumentation and provide insight into kernel behavior. For example, perf list tracepoint lists available tracepoints and perf trace -e block:block_rq_issue traces events. Tracing tools can also use tracepoints, e.g., strace -e openat ~/iosnoop and strace -e perf_event_open ~/biosnoop. A kernel event source based on dynamic instrumentation includes kprobes that can trace entry to functions and instructions, e.g. bpftrace -e 'kprobe:do_nanosleep { printf("sleep %s\n", comm); }'. A user-space event-source for dynamic instrumentation includes uprobes, e.g., bpftrace -l 'uprob:/bin/bash:*'. User-level statically-defined tracing (UsDT) is the user-space version of tracepoint and some libraries/apps have added USDt probes, e.g., bpftrace -lv 'usdt:/openjdk/libjvm.so:*'. Hardware counters (PMC) are used for observing activity by devices, e.g. perf stat gzip words instruments the architectural PMCs.
Sar
Sar is a key monitoring tool that is provided via the sysstat package, e.g., sar -u -n TCP,ETCP reports CPU and TCP statistics.
5. Applications
This chapter describes performance tuning objectives, application basics, fundamentals for application performance, and strategies for application performance analysis.
Application Basics
This section defines performance goals including lowering latency, increasing throughput, improving resource utilization, and lowering computing costs. Some companies use a target application performance index (ApDex) as an objective and as a metric to monitor:
Apdex = (satisfactory + 0.5 x tolerable + 0 x frustrating) / total-events
Application Performance Techniques
This section describes common techniques for improving application performance such as increasing I/O size to improve throughput, caching results of commonly performed operations, using ring buffer for continuous transfer between components, and using event notifications instead of polling. This section describes concurrency for loading multiple runnable programs and their execution that may overlap, and recommends parallelism via multiple processes or threads to take advantage of multiprocessor systems. These multiprocess or multithreaded applications use CPU scheduler with the cost of context-switch overhead. Alternatively, use-mode applications may implement their own scheduling mechanisms like fibers (lightweight threads), co-routines (more lightweight than fiber, e.g. Goroutine in Golang), and event-based concurrency (as in Node.js). The common models of user-mode multithreaded programming are: using service thread-pool, CPU thread-pool, and staged event-driven architecture (SEDA). In order to protect integrity of shared memory space when accessing from multiple threads, applications can use mutex, spin locks, RW locks, and semaphores. The implementation of these synchronization primitives may use fastpath (using cmpxchg to set owner), midpath (optimistic spinning), slowpath (blocks and deschedules thread), or read-copy-update (RCU) mechanisms based on the concurrency use-cases. In order to avoid the cost of creation and destruction of mutex-locks, the implementations may use hashtable to store a set of mutex locks instead of using a global mutex lock for all data structures or a mutex lock for every data structure. Further, non-blocking allows issuing I/O operations asynchronously without blocking the thread using O_ASYNC flag in open, io_submit, sendfile and io_uring_enter.
Programming Languages
This section describes compiled languages, compiler optimization flags, interpreted languages, virtual machines, and garbage collection.
Methodology
This section describes methodologies for application analysis and tuning using:
CPU profiling and visualizing via CPU flame graphs.
off-CPU analysis using sampling, scheduler tracing, and application instrumentation, which may be difficult to interpret due to wait time in the flame graphs so zooming or kernel-filtering may be required.
Syscall analysis can be instrumented to study resource based performance issues where the target for syscall analysis include new process tracing, I/O profiling, and kernel time analysis.
USE method
Thread state analysis like user, kernel, runnable, swapping, disk I/O, net I/O, sleeping, lock, idle.
Lock analysis
Static performance tuning
Distributed tracing
Observability Tools
This section introduces application performance observability tools:
perf is standard Linux profiler with many uses such as:
CPU Profiling: perf record -F 49 -a -g -- sleep 30 && per script --header > out.stack
This chapter provides basis for CPU analysis such as:
Models
This section describes CPU architecture and memory caches like CPU registers, L1, L2 and L3. It then describes run-queue that queue software threads that are ready to run and time spent waiting on CPU run-queue is called run-queue latency or dispatcher-queue latency.
Concepts
This section describes concepts regarding CPU performance including:
Clock Rate: Each CPU instruction may take one or more cycles of the clock to execute.
Instructions: CPU execute instructions chosen from their instruction set.
Instruction Pipeline: This allows multiple instructions in parallel by executing different components of different instructions at the same time. Modern processors may implement branch prediction to perform out-of-order execution of the pipeline.
Instruction Width: Superscalar CPU architecture allows more instructions can make progress with each clock cycle based on the width of instruction.
SMT: Simultaneous multithreading makes use of a superscalar architecture and hardware multi-threading support to improve parallelism.
IPC, CP: Instructions per cycle ((IPC) describe how CPU is spending its clock cycles.
Utilization: CPU utilization is measured by the time a CPU instance is busy performing work during an interval.
User Time/Kernel Time: The CPU time spent executing user-level software is called user time, and kernel-time software is kernel time.
Saturation: A CPU at 100% utilization is saturated, and threads will encounter scheduler lateny as they wait to run on CPU.
Priority Inversion: It occurs when a lower-priority threshold holds a resource and blocks a high priority thread from running.
Multiprocess, Multithreading: Multithreading is generally considered superior.
Architecture
This section describes CPU architecture and implementation:
Hardware
CPU hardware include processor and its subsystems:
Processor: The processor components include P-cache (prefetch-cache), W-cache (write-cache), Clock, Timestamp counter, Microcode ROM, Temperature sensor, and network interfaces.
P-States and C-States: The advanced configuration and power interface (ACPI) defines P-states, which provides different levels of performance during execution, and C-states, which provides different idle states for when execution is halted, saving power.
CPU caches: This include levels of caches like level-1 instruction cache, level-1 data cache, translation lookaside buffer (TLB), level-2 cache, and level-3 cache. Multiple levels of cache are used to deliver the optimum configuration of size and latency.
Associativity: It describes constraint for locating new entries like full-associative (e.g. LRU), direct-mapped where each entry has only one valid location in cache, set-associative where a subset of the cache is identified by mapping, e.g., four-way associative maps an address to four possible location.
Cache Line: Cache line size is a range of bytes that are stored and transferred as a unit.
Cache Coherence: Cache coherence ensures that CPUs are always accessing the correct state of memory.
MMU: The memory management unit (MMU) is responsible for virtual-to-physical address translation.
Hardware Counters (PMC): PMCs are processor registers implemented in hardware and include CPU cycles, CPU instructions, Level 1, 2, 3 cache accesses, floating-point unit, memory I/O, and resource I/O.
GPU: GPU support graphical displays.
Software: Kernel software include scheduler that performs time-sharing, preemption, and load balancing. The scheduler uses scheduling classes to manage the behavior of runnable threads like priorities and scheduling policies. The scheduling classes for Linux kernels include RT (fixed and high-priorities for real-time workloads), O(1) for reduced latency, CFS (Completely fair scheduling), Idle, and Deadline. Scheduler policies include RR (round-robin), FIFO, NORMAL, BATCH, IDLE, and DEADLINE.
Methodology
This section describes various methodologies for CPU analysis and tuning such as:
Tools Method: iterate over available tools like uptime, vmstat, mpstat, perf/profile, showboost/turboost, and dmesg.
USE Method: It checks for utilization, saturation, and errors for each CPU.
Workload Charcterization like CPU load average, user-time to system-time ratio, syscall rate, voluntary context switch rate, and interrupt rate.
Profiling: CPU profiler can be performed by time-based sampling or function tracing.
Cycle Analysis: Using performance monitor counter ((PMC) to understand CPU utilization at the cycle level.
Performance Monitoring: identifies active issues and patterns over time using metrics for CPU like utilization and saturation.
Static Performance Tuning
Priority Tuning
CPU Binding
Observability Tools
This section introduces CPU performance observability tools such as:
uptime
load average – exponentially damped moving average for load including current resource usage plus queued requests (saturation).
pressure stall information (PSI)
vmstat, e.g. vmstat 1
mpstat, e.g. mpstat -P ALL 1
sar
ps
top
pidstat
time, ptime
turbostat
showboost
pmcash
tlbstat
perf, e.g., perf record -F 99 command, perf stat gzip ubuntu.iso, and perf stat -a -- sleep 10
profile
cpudist, e.g., cpudist 10 1
runqlat, e.g., runqlat 10 1
runqlen, e.g., runqlen 10 1
softirqs, e.g., softirqs 10 1
hardirqs, e.g., hardirqs 10 1
bpftrace, e.g., bpftrace -l 'tracepoint:sched:*'
Visualization
This section introduces CPU utilization heat maps, CPU subsecond-offset heat maps, flame graphs, and FlameScope.
Tuning
The tuning may use scheduling priority, power stats, and CPU binding.
7. Memory
This chapter provides basis for memory analysis including background information on key concepts and architecture of hardware and software memory.
Concepts
Virtual Memory
Virtual memory is an abstraction that provides each process its own private address space. The process address space is mapped by the virtual memory subsystem to main memory and the physical swap device.
Paging
Paging is the movement of pages in and out of main memory. File system paging (good paging) is caused by the reading and writing of pages in memory-mapped files. Anonymous paging (bad paging) involves data that is private to process: the process heap and stacks.
Demand Paging
Demand paging map pages of virtual memory to physical memory on demand and defers the CPU overhead of creating the mapping until they are needed.
Utilization and Saturation
If demands for the memory exceeds the amount of main memory, main memory becomes saturated and operating system may employ paging or OOM killer to free it.
Architecture
This section introduces memory architecture:
Hardware Main Memory
The common type of the main memory is dynamic random-access memory (DRAM) and column address strobe (CAS) latency for DDR4 is around 10-20ns. The main memory architecture can be uniform memory access (UMA) or non-uniform memory access (NUMA). The main memory may use a shared system-bus to connect a single or multiprocessors, directly attached memory, or interconnected memory bus. The MMU (memory management unit) translates virtual addresses to physical addresses for each page and offset within a page. The MMU uses a TLB (translation lookaside buffer) as a first-level cache for addresses in the page tables.
Software
The kernel tracks free memory in free list of pages that are available for immediate allocation. The kernel may use swapping, reap any memory that can be freed, or use OOM killer to free memory when memory is low.
Process Virtual Address Space
The process virtual address space is a range of virtual pages that are mapped to physical pages and addresses are split into segments like executable text, executable data, heap, and stack. There are a variety of user- and kernel-level allocators for memory with simple APIs (malloc/free), effcient memory usage, performance, and observability.
Methodology
This section describes various methodlogies for memory analysis:
Tools Method: involves checking page scanning, pressure stall information (PSI), swapping, vmstat, OOM killer, and perf.
USE Method: utilization of memory, the degree of page scanning, swapping, OOM killer, and hardware errors.
Characterizing usage
Performance monitoring
Leak detection
Static performance tuning
Observability Tools
This section includes memory observability tools including:
vmstat
PSI, e.g., cat /proc/pressure/memory
swapon
sar
slabtop, e.g., slabtop -sc
numastat
ps
pmap, e.g. pmap -x 123
perf
drsnoop
wss
bpftrace
Tuning
This section describes tunable parameters for Linux kernels such as:
vm.dirty_background_bytes
vm.dirty_ratio
kernel.numa_balancing
8. File Systems
This chapter provides basic for file system analysis:
Models
File System Interfaces: File system interfaces include read, write, open, and more.
File System Cache: The file system cache may cache reads or buffer writes.
Second-Level Cache: It can be any memory type like level-1, level2, RAM, and disk.
Concepts
File System Latency: primary metric of file system performance for time spent in the file system and disk I/O subsystem.
Cache: The file system will use main memory as a cache to improve performance.
Random vs Sequential I/O: A series of logical file system I/O can be either random or sequential based on the file offset of each I/O.
Prefetch/Read-Ahead: Prefetch detects sequential read workload and issue disk reads before the application request it.
Write-Back Caching: It marks write completed after transfering to main memory and writes to disk asynchronously.
Synchronous Writes: using O_SYNC, O_DSYNC or O_RSYNC flags.
Raw and Direct I/O
Non-Blocking I/O
Memory-Mapped Files
Metadata including information about logical and physical that is read and written to the file system.
Logical vs Physical I/O
Access Timestamps
Capacity
Architecture
This section introduces generic and specific file system architecture:
File System I/O Stack
VFS (virtual file system) common interface for different file system types.
File System Caches
Buffer Cache
Page Cache
Dentry Cache
Inode Cache
File System Features
Block (fixed-size) vs Extent (pre-allocated contiguous space)
Journaling
Copy-On-Write
Scrubbing
File System Types
FFS – Berkley fast file system
ext3/ext4
XFS
ZFS
Volume and Pools
Methodology
This section describes various methodologies for file system analysis and tuning:
Disk Analysis
Latency Analysis
Transaction Cost
Workload Characterization
cache hit ratio
cache capacity and utilization
distribution of I/O arrival times
errors
Performance monitoring (operation rate and latency)
Static Performance Tuning
Cache Tuning
Workload Separation
Micro-Benchmaking
Operation types (read/write)
I/O size
File offset pattern
Write type
Working set size
Concurency
Memory mapping
Cache state
Tuning
Observability Tools
mount
free
vmstat
sar
slabtop, e.g., slabtop -a
strace, e.g., strace -ttT -p 123
fatrace
opensnoop, e.g., opensnoop -T
filetop
cachestat, e.g., cachestat -T 1
bpftrace
9. Disks
This chapter provides basis for disk I/O analysis. The parts are as follows:
Models
Simple Disk: includes an on-disk queue for I/O requests
Caching Disk: on-disk cache
Controller: HBA (host-bus adapter) bridges CPU I/O transport with the storage transport and attached disk devices.
Scalable Architecture: horizontal scalability with load balancers, web servers, application servers, and databases.
Capacity Planning: Dynamic sizing (auto-scaling) using auto-scaling-group and and Scalability testing.
Storage: File store, block store, object store
Multitenancy
Orchestration (Kubernetes)
Hardware Virtualization
Type 1: execute directly on the processors using native hypervisor or bare-metal hypervisor (e.g., Xen)
Type 2: execute within a host OS and hypervisor is scheduled by the host kernel
Implementation: Xen, Hyper-V, KVM, Nitro
Overhead:
CPU overhead (binary translation, paravirtualization, hardware assisted)
Memory Mapping
Memory Size
I/O
MultiTenant Contention
Resource Controls
Resource Controls
CPUs – Borrowed virtual time, Simple earliest deadline, Credit based schedulers
CPU Caches
Memory Capacity
File System Capacity
Device I/O
Observability
xentop
perf kvm stat live
bpftrace -lv t:kvm:kvm_exit
mpstat -P ALL 1
OS Virtualization
Implementation: Linux supports namespaces and cgroups that are used to create containers. Kubernetes uses following architecture for Pods, Kube Proxy and CNI.
Namespaces
lsns
Control Groups (cgroups) limit the usage of resources
Resource Controls – throttle access to resources so they can be shared more fairly
CPU
Shares and Bandwidth
CPU Cache
Memory Capacity
Swap Capacity
File System Capacity
File System Cache
Disk I/O
Network I/O
Observability
from Host
kubectl get pod
docker ps
kubectl top nodes
kubectl top pods
docke stats
cgroup stats (cpuacct.usage and cpuacct.usage_percpu)
system-cgtop
nsenter -t 123 -m -p top
Resource Controls (throttled time, non-voluntary context switches, idle CPU, busy, all other tenants idle)
from guest (container)
iostat -sxz 1
Lightweight Virtualization
Lightweight hypervisor based on process virtualization (Amazon Firecracker)
Implementation – Intel Clear, Kata, Google gVisor, Amazon Firecracker
Overhead
Resource Controls
Observability
From Host
From Guest
mpstat -P ALL 1
12. Benchmarking
This chapter discusses benchmarks and provides advice with methodologies. The parts of this chapter include:
Background
Reasons
System design
Proof of concept
Tuning
Development
Capacity planning
Troubleshooting
Marketing
Effective Bencharmking
Repeatable
Observable
Portable
Easily presented
Realistic
Runnable
Bencharmk Analysis
Bencharm Failures
Causal Bencharmking – you benchmark A, but measure B, and conclude you measured C, e.g. disk vs file system (buffering/caching may affect measurements).
Blind Faith
Numbers without Analysis – include description of the benchmark and analysis.
Complex Benchmark Tools
Testing the wrong thing
Ignoring the Environment (not tuning same as production)
The first chapter defines the remote API fundamentals that defines contract for the desired behavior, communication protocol, network endpoints and policies regarding failures. The chapter also surveys history of remote APIs such as TCP/IP based FTP, RPC based DCE/CORBA/RMI/gRPC, queue/messaging based, REST style, and data streams/pipelines. The authors then examines cloud native applications (CNA) and a set of principles described in IDEAL that include Isolated State, Distribution, Elasticity, Automation and Loose Coupling. These traits are then summarized as:
Fit for purpose
Rightsized and modular
Resilient and protected
Controllable and adaptable
Workfload-aware and resource-efficient
Agile and tool-supported
The authors describes how service-oriented architecture originated and evolved into Microservices that has a single responsibility within a domain-specific business capability. Microservices facilitate software reuse but also bring new challenges that include fallacies of distributed computing, data consistency and state management. These APIs should be considered as products and they may form ecosystems. API business value, visibility and lifetime help make API successful by enabling rapid integration of systems with support of the autonomy and independent evolution of those systems. The API design may differ based on:
One general vs many specialized endpoints
Fine vs coarse-grained endpoint and operation scope
Few operations carrying much data vs chatty interactions carrying little data
Data currentness vs correctness
Stable contracts vs fast changing ones
The authors reviews architecturally significant requirements such as understandability, information sharing vs hiding, amount of coupling, modifiability, performance & scalability, data parsimony, and security & privacy. The authors then describes developer experience as:
DX = function, stability, ease of use, and clarity
The developer experience includes quality attributes throughout the lifecycle of API such as development qualities, operational qualities and managerial qualities. The chapter ends with definition of a domain model for remote APIs that include communication participants, endpoints with contracts that describe operations, message structure, and API contract.
2. Lakeside Mutual Case Study
The chapter 2 introduces a fake Lakeside Mutual case study to illustrate API design. This chapter examines the user-stories and quality attributes for the case study, analsysis-level domain model and architecture overview. The architecture overviews describes system context and application architecture including service components. The chapter then describes an example of API specification using MDSL (Microservice Domain-Specific-Language).
3. API Decision Narratives
This chapter goes over the API design options and decisions where each decision includes criteria, alternative options and recommendations based on why-statement and architecture-decision-record format. The first pattern starts with Foundation API decisions and patterns that include:
3.1 API Visibility
This decision that is primarily managerial and organizational looks at the different visibility options such as Public API, Community API and Solution-Internal API.
3.2 API Integration
The chapter looks at the decision looks for the API integration types where an API can be integrated with backend horizontally or can be integrated with frontend and backend vertically. In the former option, backend exposes its services via a message-based remote backend integration API. In the latter option, the APIs are exposed via a message-based remote frontend integration API.
The API designers have to find an appropriate business granularity for the service and handle cohesion & coupling criteria. The drivers for this decision is to define the architectural role that an API endpoint should play and define the responsibility of each API operation. The role of an API endpoint can be Processing Resource for processing incoming commands or Information Holder Resource for storage and retrieval of data or metadata. The information holder roles can be further divided into operational/transactional short-lived data, master long-lived data for business transactions, reference long-lived data for looking up delivery status, zip codes, etc., link lookup resource to identify links to resources and data transfer resource to offer a shared data exchange between clients.
3.5 Defining Operation Responsibilities
The operation responsibilities include defining read-write characteristics of each API operation and can be categorized into Computing Function, State Creation Operation, State Transition Operation and Retrieval Operation. The Computation Function computes a result solely from the client input without reading or writing a server-side state. The State Creation Operation creates states with reliability on an write-only API endpoint. The State Transition Operation performs one or more activities, causing a server-side state change with considerations for network efficiency and data parsimony. The Retrieval Operation represents a read-only access operation to find the data.
3.6 Selecting Message Representation Patterns
The structural representation patterns deal with designing message representation structures with considerations for finding the optimal number of message parameters and semantic meaning and stereotypes of the representation elements. This structural representation needs to take four decisions: responsibility of message elements, structure of the parameter representation, exchange of context information required and meaning of stereotypes of message elements. The structure of parameter representation can be nested or flat with types: Atomic Parameter, Atomic Parameter List, Parameter Tree, and Parameter Forrest. The Atomic Parameter defines a single parameter or body element. The Atomic Parameter List aggregates multiple atomic parameters as list. The Parameter Tree defines a hierarchical structure with one or more child nodes. The Parameter Forest comprises two or more Parameter Trees. Security and privacy concerns such as data integrity and confidentiality as well as semantic proximity will determine choosing the right option for these structure types.
3.7 Element Stereotypes
The element stereotype patterns include Data Element and Metadata Element, Link Element, ID Element. Security and data privacy concerns drive Data Elements and Metadata Elements and messages may become larger if Metadata Elements are included. The unique ID Element is used to identify to API endpoints, operations, and message representation elements. The Link Element act as human and machine readable network accessible pointers to other endpoints and operations.
3.8 Governing API Quality
The quality of service (QoS) for API include reliability, performance, security and scalability. The themes of the decisions for quality governance include:
3.8.1 Identification and Authentication of the API Client
Identification, authentication and authorization are important for APIs security but they also enable measures for ensuring many other qualities.
3.8.2 API Key
The API Key identifies the client and additional signature made with the secret key, which are never transmitted. You may use OAuth 2.0, OpenID, Kerberos in combination with LDAP, CHAP, and EAP.
3.8.3 Pricing Plan
The pricing plan looks at the metering and charging for API consumption and its variants include Freemium Model, Flat-Rate Subscription, Usage-based Pricing and Market-based Pricing based on economic aspects.
3.8.4 Rate Limit
The Rate Limit safeguards against API clients that overuse the API.
3.8.5 Service Level Agreement
The service Level Agreement defines testable service-level objectives to establish a structured, quality-oriented agreement with the API product owner.
3.8.6 Error Report
The Error Report uses error codes in response message that indicate and classify the faults in a simple and machine-readable ways.
3.8.7 Context Representation
The context representation uses Metadata Elements to carry contextual information in request and response messages. It can be used to cope with the diversity of protocols for distributed applications and transport security tokens and digital signatures.
3.8.8 Pagination
The pagination divides large response data into smaller chunks and its variants include Page-Based Pagination, Cursor-Based Pagination, Offset-Based Pagination, and Time-Based Pagination. It can optionally allow filtering capabilities and pagination structure can be defined as Atomic Parameter List, or Parameter Forest or Parameter Tree.
3.8.9 Wish List and Wish Template
A Wish List allows API clients to provide desired data elements of requested resource in the request. When response contains a nested data, Wish Template can be used to specify parameters in the request message that should be included in the corresponding response message.
3.8.10 Conditional Request
This pattern makes a Conditional Request by adding Metadata Elements to the request message and the API service processes the request only the condition specified by the metadata is met.
3.8.11 Request Bundle
Request Bundle is defined as a data container that assembles multiple requests with unique identifiers in a single request message.
3.8.12 Embedded Entity
This pattern embeds a Data Element in the request or response instead of link or identifier.
3.8.13 Linked Information Holder
Linked Information Holder adds a Link Element to message that points to the API endpoint that represent the linked element.
3.9 API Evolution
API Evolution patterns define governing rules balancing stability and compatibility with maintainability and extensibility such as:
3.9.1 Version Identifier
Version identifier is added as a Metadata Element to the endpoint address, protocol header or the message payload to indicate possibly incompatible changes to clients.
3.9.2 Semantic Versioning
Semantic Versioning introduces a hierarchical three-number versioning schema x.y.z, which allows API providers to denote level of changes as major, minor and patch versions.
3.9.3 Commissioning and Decommissioning
The variants for version introduction and decommissioning decision include Two in Production, Limited Lifetime Guarantee, and Aggressive Obsolescence.
3.9.4 Experimental Preview
Experimental Preview provides access to an API to receive early feedback from consumers without making any commitments about the functionality, stability and longevity.
4. Pattern Language Introduction
This chapter introduces a pattern language, basic scoping and structural patterns. Many of the patterns builds upon Enterprise Integration Patterns and Gof Design Patterns when defining structure of a message. This chapter categorizes patterns into Foundation patterns, Responsibility patterns, Structure patterns, Quality patterns and Evolution patterns. These patterns also follow Design Refinement Phases based on Unified Process:
Inception – Foundation
Elaboration – Responsibility and Quality
Construction – Structure, Responsibility and Quality
Transition – Foundation, Quality and Evolution
4.1 Foundations: API Visibility and Integration Types
These patterns deal with types of systems, subsystems and components as well as where should an API be accessible. The API integration types can be Frontend Integration and Backend Integration. The Frontend Integrations, also referred as vertical integrations are consumed by API clients in application frontends. The cloud-native applications and microservices-based system benefit with Backend Integration, sometimes called horizontal integration to access information or activity in other systems. The API visibility alternatives can be Public API, Community API and Solution-Internal API. Public API specifies endpoints, operations, message representation, quality of service and lifecycle model that can be accessed by unlimited or unknown number of API clients and can be controlled with API keys. You may apply other patterns such as Version Identifiers, Pricing Plan, Rate Limit and Service Level Agreement with Public APIs. The Community API are only available to a community that may consists of different organizations. The Solution-Internal API is also referred as Platform API that may be exposed in a single cloud provider offering.
4.2 Basic Structure Patterns
The structure patterns looks at the number of representation elements for request and response messages and decides how these elements should be grouped. These patterns include Atomic Parameter that describes plain data such as text and numbers; Atomic Parameter List that groups several elementary parameters; Parameter Trees that provide nested parameters; and Parameter Forest that groups multiple tree parameters.
5. Define Endpoint Types and Operations
This chapter corresponds to Define phase of the Align-Define-Design-Refine (ADDR) process and describes high-level endpoint identification activities. The authors looks at user stories, event storming or other collaboration techniques to define API roles and responsibilities. The design of API contracts also have to define developer experience in terms of function, stability, ease of use, clarity. Other quality attributes that the API designer have to decide include: Accuracy for functional correctness including preconditions, invariants and postconditions; Distribution of control and autonomy between API client and provider; Scalability, performance and availability with Service Level Agreements for mission-critical APIs; Manageability for monitoring APIs; Consistency and atomicity for all-or-nothing semantics; Idempotence property; Auditability for risk management.
5.1 Endpoint Roles (aka Service Granularity)
The two general endpoint roles are Processing Resource and Information Holder Resource. The Processing Resource role allows remote clients to trigger an action and related design concerns include contract expressiveness and service granularity; learnability and manageability; semantic interoperability; response time; security and privacy; and compatibility and evolvability. Information Holder Resource exposes domain data in API and it may use Domain-driven design and object-oriented analysis and design to model the data. Other related concerns include quality attribute conflicts and trade-offs; security; data freshness vs consistency; and compliance with architectural design principles. Related patterns include:
Operational Data Holder to create, read, update and delete its data often and fast.
Master Data Holder to access master data that lives for long time, doesn’t change and will be referenced from many clients. The request and response messages of Master Data often take the form of Parameter Trees and master data update may come in the form of coarse-grained full updates or fine-grained partial updates.
Reference Data Holder is used to lookup reference data that is long lived and is immutable for clients using API endpoints. Its desired qualities include Do not repeat yourself (DRY) and performance vs consistency trade-off for read access.
Link Lookup Resource allows referring to other resources so that clients remain loosely coupled if API provider changes the destination of links. The design challenges include: coupling between clients and endpoints; dynamic endpoint references; centralization vs decentralization; message sizes, number of calls, resource use; dealing with broken links; and number of endpoints and API complexity.
Data Transfer Resource allows exchanging data between participants without knowing each other, without being available at the same time. The design considerations include coupling (time and location dimensions); communication constraints; reliability; scalability; storage space efficiency; latency; and ownership management. You may introduce a shared storage endpoint with a State Creation Operation and Retrieval Operation. The pattern properties include coupling (time and location dimensions); communication constraints; reliability; scalability; storage space efficiency; latency; ownership management; access control; (lack of) coordination; optimistic locking; polling; and garbage collection.
5.2 Operation Responsibilities
The four operation responsibilities include:
State Creation Operation to allow its clients that something has happened, e.g. to trigger instant or later processing. This design concerns include: coupling trade-offs (accuracy and expressiveness vs information parsimony); timing; consistency; and reliability. It may or may not have fire-and-forget semantics and idempotency may be needed for the transaction boundary. A popular variant of this pattern is Event Notification Operation, notifying the endpoint about an external event.
Retrieval Operation to retrieve information and allow further client-side processing. The design issues include: veracity, variety, velocity and volume; workload management; network efficiency vs data parsimony.
State Transition Operation to allow a client initiate a processing action that causes the provider-side application state to change. The design concerns include service granularity; consistency and auditability; dependencies on state changing being made beforehand; workload management; and network efficiency vs data parsimony. State Transition Operations are generally transactional supporting ACID behavior and may use ABAC for compliance and security controls.
Computation Function to allow client invoke side-effect-free remote processing on the provider side based on the input parameters. The relevant design issues include reproducibility and trust; performance; and workload management. Its examples include a Transformation service, Validation service, and Long Running Computation.
6. Design Request and Response Message Representations
This chapter corresponds to Design phase of the Align-Define-Design-Refine (ADDR) process and examines structural patterns for requests and responses. The challenges when designing message representations include interoperability on protocol and message-content; latency; throughput and scalability; maintainability; and developer experience.
6.1 Data Element
The Data Element pattern allow exchanging application-level information between API clients and API providers without decoupling them. The competing force concerns include rich functionality vs ease of processing and performance; security and data privacy vs ease of configuration; and maintainability vs flexibility.
6.2 Metadata Element
Metadata Element pattern allows enriching messages with additional information so that receiver can interpret the message content correctly. The design concerns include interoperability; concerns; and ease of use vs runtime efficiency. The variants of this pattern include Control Metadata Element such as identifiers, flags, filter, ACL, API eys, etc; Aggregated Metadata Elements such as counters of Pagination and statistical information; Provenance Metadata Elements such as message/request IDs, creation date, version numbers, etc.
6.3 ID Element
ID Element pattern helps identify elements of the Published Language using UUID or surrogate key when applying domain-driven design. The identification problems include effort vs stability; reliability for machines and humans; and security.
6.3 Link Element
Link Element is used to reference API endpoints and operations in request and response message payloads so that they can be called remotely.
6.4 API Key
API Key allows API provider to identify and authenticate clients and their requests. The design issues include establishing basic security; access control; avoiding the need to store or transmit user credentials; decoupling clients form their organizations; security vs ease of use; and performance.
6.5 Error Report
Error Report allows API provides inform its clients about communication and processing faults. The design concerns include expressiveness and target audience expectations; robustness and reliability; security and performance; interoperability and portability; and internationalization.
6.6 Context Representation
Context Representation allows API consumers and providers exchange context information without relying on any particular remoting protocols. The design considerations include interoperability and modifiability; dependency on evolving protocols; developer productivity (control vs convenience); diversity of clients and their requirements; end-to-end security; and logging and auditing on business domain level.
7. Refine Message Design for Quality
This chapter reviews API Quality patterns related to the Design and Refine phases of the Align-Define-Design-Refine (ADDR) process. The major challenges with API Quality include message sizes vs number of requests; information needs of individual clients; network bandwidth usage vs computation efforts; implementation complexity vs performance; statelessness vs performance; and ease of use vs legacy.
7.1 Message Granularity
The message granularity patterns deal with performance and scalability; modifiability and flexibility; data quality; data privacy; and data freshness vs consistency. These patterns include:
Embedded Pattern allows placing Data Element in the request or response to avoid exchanging multiple messages.
Linked Information Holder can be used to keep the message small when an API deals with multiple information elements that reference each other.
These patterns deal with performance, scalability, and resource use; information needs of individual clients; loose coupling and interoperability; developer experience; security and data privacy; and test and maintenance effort. These patterns include:
Pagination allows an API provider deliver large sequence of structured data without overwhelming clients. The design concerns include session awareness and isolation; and data set size and data access profile. The variants of this pattern include Page-Based Pagination, Cursor-Based Pagination, Time-Based Pagination and Offset-Based Pagination.
Wish List allows an API client inform the API provider at runtime about the data it is interested in.
Wish Template allows API client inform the API provider about nested data that it is interested in. For example, Wish Templates of GraphQL are the query and mutation schemas providing declarative descriptions of the client requirements.
These patterns provide balance competing forces for complexity of endpoint, client, and message payload design; and accuracy of reporting and billing. These patterns include:
Conditional Request prevents unnecessary server-side processing and bandwidth usage by invoking API operation only when the condition is true. The design concerns include size of message; client workload; provider workload; and data currentness vs correctness. Its variants include Time-Based Conditional Request (e.g. If-Modified-Since HTTP header) and Fingerprint-Based Conditional Request (e.g. ETag and If-None-Match HTTP headers).
Request Bundle works as a data container that assembles multiple independent requests in a single request message with unique request identifiers.
8. Evolve API
This chapter reviews API Evolution patterns related to the Refine phase of the Align-Define-Design-Refine (ADDR) process. The major challenges with API Evolution autonomy, loose coupling, extensibility, compatibility and sustainability. The patterns in this chapter include:
8.1 Versioning and Compatibility Management
These patterns include:
Version Identifier allows an API provider indicate its current capabilities as well as existence of possibly incompatible changes to clients. The design concerns include accuracy vs exact identification; no accidental breakage of comparability; client-side impact; and traceability of API versions in use.
Semantic versioning allow stakeholders compare API versions to detect incompatible changes. The design concerns include minimal effort to detect version incompatibility; clarity of change impact; clear separation of changes with different levels of impact and compatibility; manageability of API versions and related governance effort; and clarity with regard to evolution timeline. The common numbering scheme in Semantic Versioning include major version, minor version and patch version.
8.2 Life-Cycle Management Guarantees
These patterns include:
Experimental Preview allows providers make the introduction of a new API or new API versions, less risky for their clients and obtain early adopter feedback without freezing the API design prematurely. The design considerations include innovation and new features; feedback; focus effort; early learning and security.
Aggressive Obsolescence allows API providers reduce the effort for maintaining an entire API by removing unused or deprecated features. The design concerns include minimizing the maintenance effort; reducing forced changes to clients in a given time span as a consequence of API changes; repeating/acknowledging power dynamics; and commercial goals and constraints. The API version is marked as Release, Deprecate or Decommission in the lifecycle of Aggressive Obsolescence.
Limited Lifetime Guarantee allows a provider let clients know for how long they can rely on the published version of an API. The design considerations include make client-side changes caused by API changes plannable; and limit the maintenance effort for supporting old clients.
Two in Production allows a provider gradually update an API without breaking existing clients but also without maintaining a large number of API versions in production. The design concerns include allow the provider and the client to follow different life cycles; guarantee that API changes do not lead to undetected backward compatibility problems between clients and provider; ensure the ability to rollback if a new API version is designed badly; minimize changes to the client; minimize the maintenance effort for supporting clients relying on old API versions.
9. Document and Communicate API Contracts
This chapter does not correspond to any phase of the Align-Define-Design-Refine (ADDR) process. The challenges for Documenting APIs include interoperability; compliance; information hiding; economic aspects; performance and reliability; meter granularity; attractiveness from a consumer point of view. The patterns in the chapter include:
API Description to share knowledge between API provider and its clients and related concerns include interoperability; consumability; information hiding; extensibility and evolvability.
Pricing Plan to allow API provider meter API service consumption and charge for it. Its variants include Subscription-based Pricing, Usage-based Pricing, and Market-based Pricing.
Rate Limit to allow API provider prevent API clients from excessive API usage with design considerations for economic aspects; performance; reliability; impact and severity of risks of API abuse; and client awareness.
Service Level Agreement to allow API client learn about the specific quality-of-service characteristics of an API and its endpoint operations. The design concerns include business agility and vitality; attractiveness from the consumer point of view; availability; performance and scalability; security and privacy; government regulations and legal obligations; and cost-efficiency and business risks from a provider point of view.
10. Real-World Pattern Stories
This chapter examines API design and evolution in real-world business domains. The first case-study discusses large-scale process integration in Terravis, a Swiss Mortgage business had to adopt a new law for the digitization of Swiss land registry businesses. In the context dimensions defined by Philippe Krutchten, the Terravis platform was characterized in terms of system size, system criticality, system age, team distribution, rate of change, preexistence of stable architecture, governance and business model. Terravis applied role and status of API as well as other patterns such as Solution-Internal API, Community API, API Description, Service Level Agreements, Semantic Versioning, Error Report, Pricing Plan, Rate Limit, Context Representation, State Creation Operation, State Transition Operations, Pagination, etc. The other case-study showed how an internal system at the concrete column manufacturer SACAC had to integrate different existing software such as ERP and CAD systems. The chapter used the Philippe Krutchten’s project dimensions to describe the project. The key challenges included correctness of all calculations and the solution applied book’s guidelines for roles and status of API. The API used Solution-Internal, Frontend Integration, Backend Integration, State Creation Operations, State Transition Operations, Retrieval Operations, Computations Functions, etc.
11. Conclusion
The last chapter concludes with how the pattern language in the book helps integration architects, API developers and other roles involved with API design and evolution. The authors also suggest how APIs can be refactored to the patterns described in the book and use Microservice Domain Specific Language (MDSL) Tools for refactoring. The chapter also describes advancements in API protocols and standards such as HTTP/2, HTTP/3, and gRPC. OpenAPI Specification is the dominant API description language for HTTP-based APIs and AsyncAPI is gaining adoption for message-based APIs, which can also generate MDSL bindings.