Shahzad Bhatti Welcome to my ramblings and rants!

April 14, 2026

API Anti-Patterns: 50+ Mistakes That Will Break Your Production Systems

Filed under: Computing,Microservices — admin @ 2:25 pm

Over the past years I have written extensively about what makes distributed APIs fail. In How Abstraction Is Killing Software I showed how each layer crossing a network boundary multiplies latency and failure probability. In Transaction Boundaries: The Foundation of Reliable Systems and How Duplicate Detection Became the Dangerous Impostor of True Idempotency, I showed how subtle contract violations produce data corruption. Building Robust Error Handling with gRPC and REST, Zero-Downtime Services with Lifecycle Management, and Robust Retry Strategies for Building Resilient Distributed Systems explained error handling and operational health. My production checklist and fault tolerance deep-dive outlined those lessons actionable before a deployment. I also built an open-source API mock and contract testing framework, available at github.com/bhatti/api-mock-service that addresses how few teams verify their API contracts before clients discover the gaps in production. And in Agentic AI for Automated PII Detection I showed how AI-driven scanning can find the sensitive data leaking through APIs that manual review misses. Here, I am showing 50 anti-patterns across seven categories, each with a real-world example. Two laws sit at the foundation of everything that follows.

Hyrum’s Law: With a sufficient number of users of an API, it does not matter what you promised in the contract, i.e., all observable behaviors of your system will be depended upon by somebody.

Postel’s Law (the Robustness Principle): Be conservative in what you send, be liberal in what you accept.


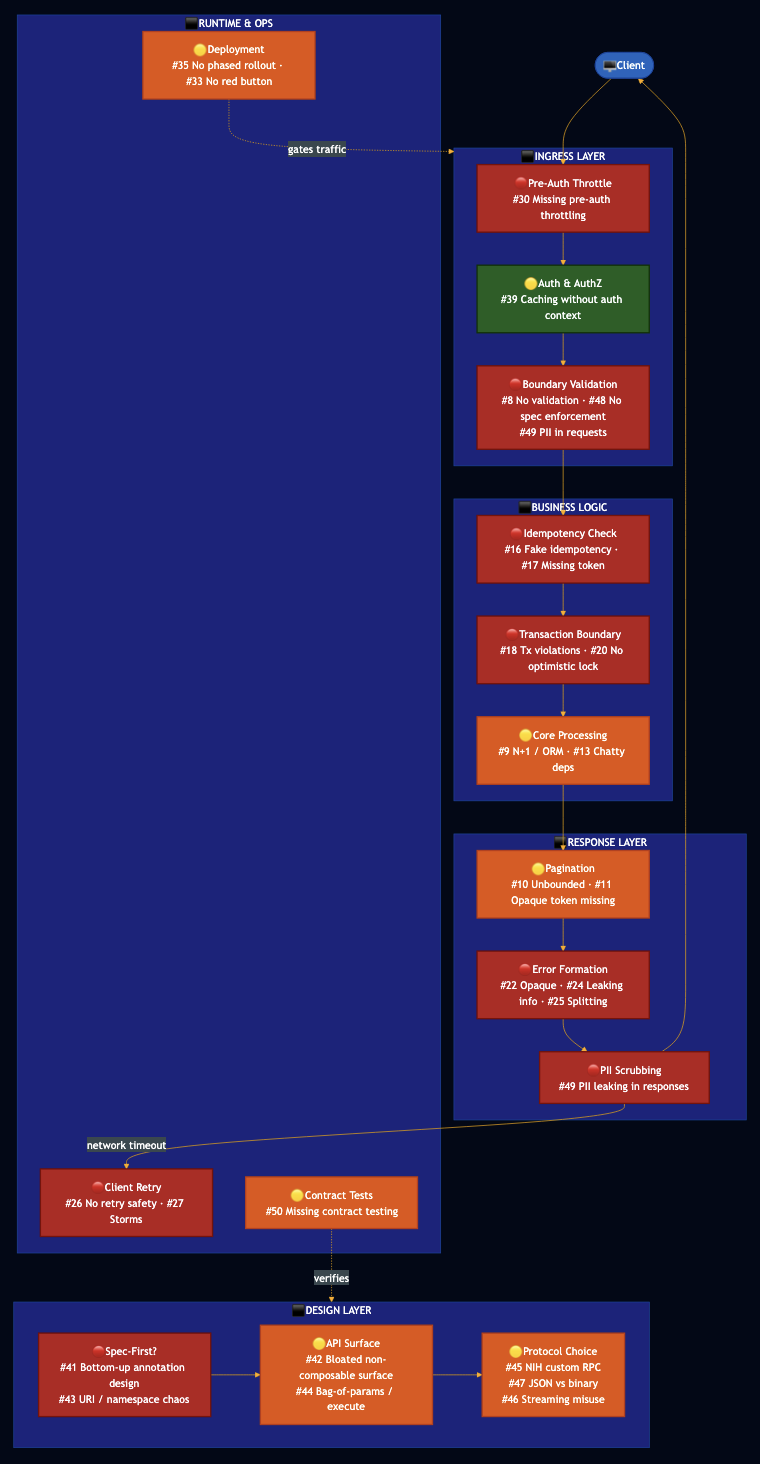
The Anatomy of an API Failure

The diagram below maps where anti-patterns activate in a production request lifecycle. Red nodes are failure hotspots.


Section 1: API Design Philosophy Anti-Patterns

Design philosophy determines everything downstream.


1.1 Bottom-Up API Design: Annotation-Driven and Implementation-First

I have seen this pattern countless times where the team builds the service, then adds Swagger/OpenAPI annotations to the Java or Typescript classes to generate the API spec automatically. The spec is an artifact of the implementation and field names are whatever the ORM column is called. Endpoints are organized around the service layer, not the consumer’s mental model. The spec is generated post-hoc, often incomplete, and rarely reviewed before clients onboard.

In the end, you get an API that perfectly describes your internal implementation and is poorly shaped for external callers. Names leak internal terminology. Refactoring the implementation silently changes the API contract. The APIs are also strongly coupled to the UI that the same team is building and clients who onboard during development find a moving target.

Better approach: Spec-First Design: Write the OpenAPI or Protobuf spec before writing any implementation code. Use the spec as the contract that drives both the server implementation and the client SDK. Review the spec with consumers before implementation begins. Use code generation to produce server stubs from the spec.

# spec-first: openapi.yaml is the source of truth, written before implementation
openapi: "3.1.0"
info:
  title: Order Service
  version: "1.0.0"
paths:
  /v1/orders:
    post:
      operationId: createOrder
      summary: Create a new order
      requestBody:
        required: true
        content:
          application/json:
            schema:
              $ref: '#/components/schemas/CreateOrderRequest'
      responses:
        '201':
          description: Order created
          content:
            application/json:
              schema:
                $ref: '#/components/schemas/Order'
        '400':
          $ref: '#/components/responses/ValidationError'
        '409':
          $ref: '#/components/responses/ConflictError'

For gRPC: write the .proto file first. The proto is the spec. Code-generate both server stubs and client libraries from it. Also, Google’s API Improvement Proposals (AIP) define a spec-first methodology for gRPC APIs that also maps to HTTP via the google.api.http annotation. A single proto definition can serve both gRPC clients and REST/JSON clients through a transcoding layer (Envoy, gRPC-Gateway), giving you the performance of binary protobuf and the accessibility of JSON from one spec:

service OrderService {
  rpc CreateOrder(CreateOrderRequest) returns (Order) {
    option (google.api.http) = {
      post: "/v1/orders"
      body: "*"
    };
  }
  rpc ListOrders(ListOrdersRequest) returns (ListOrdersResponse) {
    option (google.api.http) = {
      get: "/v1/orders"
    };
  }
}

1.2 Bloated API Surface: Non-Composable, UI-Coupled APIs

Another common pattern I have seen at a lot of companies is that a service that has hundreds or thousands of endpoints because every new feature needs some new data or behavior. Another artifact of poorly designed APIs is bloated response with all fields, all related resources, deeply nested because the first consumer needed everything and nobody added projection. This often occurs because the API is built by the same team building the UI. When the UI changes, new endpoints are added rather than the existing ones being generalized.

This results in integration without documentation becomes impossible. New clients must read everything to understand what to call. Duplicate endpoints proliferate, e.g., three different endpoints do approximately the same thing because each was built for a different screen without awareness of the others.

Composability principle: A well-designed API surface should be small enough that a competent developer can understand its structure in 30 minutes. Operations should compose small, focused operations that can be combined.

// Anti-pattern: purpose-built for one UI screen
rpc GetCheckoutPageData(GetCheckoutPageDataRequest) returns (CheckoutPageData);
// CheckoutPageData contains customer, cart, inventory, shipping, payment — all tightly coupled to one view

// Better: composable operations that any client can combine
rpc GetCustomer(GetCustomerRequest) returns (Customer);
rpc GetCart(GetCartRequest) returns (Cart);
rpc ListShippingOptions(ListShippingOptionsRequest) returns (ListShippingOptionsResponse);
// BFF layer aggregates these for the UI — keeps the core API clean

On API surface size: prefer a small number of well-understood, stable operations over a large surface of purpose-built ones. Use field masks or projections so callers opt-in to the fields they need.


1.3 Improper Namespace and Resource URI Design

Though most companies provide REST based APIs but often endpoints organized around verbs instead of resources: /getOrder, /createOrder, /deleteOrder, /updateOrderStatus. No consistent hierarchy. Related resources scattered across URL spaces: /orders and /order-history and /customer-purchases all refer to variants of the same concept with no clear relationship. Different teams own overlapping namespaces. A service called UserService that has endpoints for users, preferences, addresses, payment methods, and audit logs with no sub-resource structure.

The fundamental concept in REST is that URLs identify resources with nouns and HTTP verbs express actions on those resources. A resource hierarchy expresses relationships. This is not an aesthetic preference; it is the architectural model that makes REST APIs predictable without documentation.

# Anti-pattern: verb-based, flat, unorganized
GET    /getUser?id=123
POST   /createOrder
POST   /updateOrderStatus
GET    /getUserOrders?userId=123
DELETE /cancelOrder?orderId=456
GET    /getOrderHistory?customerId=123

# Correct: resource-oriented hierarchy
GET    /v1/users/{userId}                        # get user
POST   /v1/orders                                # create order
PATCH  /v1/orders/{orderId}                      # partial update (including status)
GET    /v1/users/{userId}/orders                 # orders for a user
DELETE /v1/orders/{orderId}                      # cancel order
GET    /v1/users/{userId}/orders?status=completed # filtered history

Namespace discipline: Keep related resources under the same base path. OrderService owns /v1/orders/**. UserService owns /v1/users/**. Related sub-resources live under their parent: /v1/orders/{orderId}/items, /v1/orders/{orderId}/events. Do not scatter related concepts across different roots based on internal team ownership.

Avoiding duplicate APIs: Before creating a new endpoint, ask whether an existing one can be parameterized to serve the new use case


1.4 The Execute Anti-Pattern: Bag of Params for Different Actions

Contrary to large surface, this anti pattern reuses same endpoint for different action depending on which parameters are present. The operation is effectively execute(action, params...) with a bag of optional fields, where different combinations of fields trigger different code paths.

// Anti-pattern: one RPC that does many things depending on type
message ProcessOrderRequest {
  string order_id = 1;
  string action = 2;           // "cancel", "ship", "refund", "update", "hold"
  string cancel_reason = 3;    // only used when action = "cancel"
  string tracking_number = 4;  // only used when action = "ship"
  double refund_amount = 5;    // only used when action = "refund"
  Address new_address = 6;     // only used when action = "update"
  string hold_until = 7;       // only used when action = "hold"
}

It feels like one operation (“do something with this order”). It minimizes the number of endpoints and it is easy to add a new action without changing the RPC signature.

It results in callers not understanding what the operation does without documentation explaining every action variant. Validation becomes a conditional maze — field cancel_reason is required when action = "cancel" but ignored otherwise. Generated SDK method signatures have no useful type information. Tests multiply exponentially.

Better approach: Separate operations for separate actions. Use oneof in protobuf for requests that have genuinely mutually exclusive parameter sets:

// Better: explicit operations, each with a clear contract
rpc CancelOrder(CancelOrderRequest) returns (Order);
rpc ShipOrder(ShipOrderRequest) returns (Order);
rpc RefundOrder(RefundOrderRequest) returns (Refund);

message CancelOrderRequest {
  string order_id = 1;
  string reason = 2;   // always relevant, always validated
}

// If you truly need a polymorphic command, use oneof to make it explicit:
message UpdateOrderRequest {
  string order_id = 1;
  oneof update {
    ShippingAddressUpdate shipping_address = 2;
    StatusUpdate status = 3;
    ContactUpdate contact = 4;
  }
  // oneof makes it structurally impossible to send two update types at once
  // Generated SDKs expose typed accessors — no stringly-typed action field
}

gRPC’s required/optional semantics: proto3 makes all fields optional by default. Use proto3’s optional keyword explicitly when a field’s absence carries meaning. You can use Protocol Buffer Validation to add more validation and enforce it in your boundary validation layer.


1.5 NIH Syndrome: Custom RPC Protocols Instead of Standards

At other places, I have seen teams build their own binary protocol over raw TCP because “gRPC has too much overhead.” They have custom framing, error codes, and multiplexing, which runs on a non-standard port, and needs special firewall rules. More often it is NIH (Not Invented Here) syndrome, believing that the standard tools are not good enough, combined with underestimation of the operational cost of maintaining a custom protocol.

In the end, custom protocols do not work through corporate proxies, CDNs, API gateways, or load balancers that only speak HTTP. Many enterprise environments permit only HTTP/HTTPS outbound and a custom port means the integration simply cannot be used. Tools like Wireshark, curl, Postman, and every observability platform will not understand your protocol. Debugging becomes dramatically harder because the entire ecosystem of HTTP tooling is unavailable.

What standard protocols actually give you:

ProtocolBest ForTransportStreaming
REST/HTTPPublic APIs, broad compatibilityHTTP/1.1, HTTP/2No (use SSE)
gRPCHigh-performance internal services, strong typingHTTP/2Yes (4 modes)
WebSocketBidirectional real-time communicationHTTP upgradeYes (full-duplex)
GraphQLFlexible queries, client-driven shapeHTTP/1.1, HTTP/2Subscriptions
Server-Sent EventsServer-push notificationHTTP/1.1Server-to-client

1.6 Badly Designed Streaming APIs

This is similar to previous pattern where a team that needs real-time data pushes builds a polling endpoint (GET /events?since=<timestamp>) and expects clients to poll every second. Or uses raw sockets that send large JSON blobs because “it’s streaming.” Or uses gRPC streaming but sends the entire dataset in one message instead of streaming rows incrementally. Or builds a custom long-polling mechanism with complex session state when SSE would have been simpler.

  • gRPC streaming modes:
service DataService {
  // Unary: single request, single response — most operations
  rpc GetOrder(GetOrderRequest) returns (Order);

  // Server streaming: one request triggers a stream of responses
  // Use for: sending large datasets, live feeds, log tailing
  rpc TailOrderEvents(TailOrderEventsRequest) returns (stream OrderEvent);

  // Client streaming: stream of requests, one response
  // Use for: bulk ingest, file upload in chunks
  rpc BulkCreateOrders(stream CreateOrderRequest) returns (BatchCreateOrdersResponse);

  // Bidirectional streaming: both sides stream independently
  // Use for: real-time chat, collaborative editing, game state sync
  rpc SyncOrderState(stream OrderStateUpdate) returns (stream OrderStateUpdate);
}
  • WebSocket is the correct choice for full-duplex browser communication where you need persistent connections with low latency in both directions. It upgrades from HTTP, passes through standard proxies, and is supported universally.
  • Server-Sent Events (SSE) is the correct choice for server-push-only scenarios (notifications, live dashboards) where the client only needs to receive, not send. SSE is HTTP.
  • Never build: custom TCP streaming, custom HTTP long-polling with complex session management, or custom binary framing when gRPC already provides exactly that.

1.7 Ignoring Encoding: JSON Everywhere Regardless of Cost

This anti-pattern can surfaces when a high-throughput internal service between two microservices you control uses JSON over HTTP/1.1 because “it’s simple.” Internal services process millions of messages per second serializing and deserializing large JSON payloads. The payload includes deeply nested structures with long field names repeated in every message. No compression. No binary encoding.

The performance reality: JSON is human-readable text with significant overhead:

  • Field names are repeated in every object (bandwidth and parse cost)
  • No schema enforcement at the encoding layer
  • No native binary type (base64 for bytes adds ~33% overhead)
  • UTF-8 string parsing is CPU-intensive at high throughput

Protobuf binary encoding is typically 3–10× smaller than equivalent JSON and 5–10× faster to serialize/deserialize at high volume. For internal service-to-service communication at scale, this is not a micro-optimization, it is a significant infrastructure cost difference.

Better approach: Choose encoding based on the use case:

ScenarioRecommended Encoding
Public REST API, browser clientsJSON (required for broad compatibility)
Internal service-to-service (high throughput)Protobuf binary over gRPC
Internal service-to-service (moderate)JSON over HTTP/2 with compression is acceptable
Mixed: public + internal clientsgRPC with HTTP/JSON transcoding via AIP
Event streaming (Kafka, Kinesis)Avro or Protobuf with schema registry

gRPC over HTTP/2 gives you multiplexed streams, binary encoding, strongly typed contracts, and bi-directional streaming in one package. For internal services at scale, there is rarely a justification for JSON over HTTP/1.1.

1.8 No Clear Internal/External API Boundary

In many cases, organizations may use gRPC internally and REST externally but in practice, the internal gRPC APIs were never held to any standard. For example, field names are inconsistent, operations are not paginated or there is no versioning.

  • Internal APIs become a inconsistent mess with duplicate functionality. Because internal APIs have no governance, each team designs theirs in isolation. Team A has GetUserProfile. Team B has FetchUser. Team C has LookupUserById. The internal API surface grows without bound.
  • Internal APIs leak into the external surface. The public REST API was designed conservatively, returning only what external callers need. But an internal team needs the same resource with additional fields. Rather than adding a projection or a scoped access tier, the quickest path is to promote the internal API endpoint. Over time, the line between “public” and “internal” API blurs. External clients discover undocumented internal fields (Hyrum’s Law again) and start depending on them.

Better approach — treat internal and external APIs as two tiers of the same governance model:

External API (public)         Internal API (private)
??????????????????????        ?????????????????????????
Same naming conventions       Same naming conventions
Same error shape              Same error shape
Same pagination model         Same pagination model
Same versioning policy        Same versioning policy — yes, even internally
Minimal response fields       Additional fields gated by internal scope/role
OpenAPI spec enforced         Proto spec enforced with protoc-gen-validate
Published SLA                 Published SLA (even if internal)
Contract tests in CI          Contract tests in CI

The key discipline is that internal APIs must follow the same standards as public APIs in terms of naming, versioning, error shapes, pagination. The only difference is the data they expose and the authentication model.

Handling the “extra fields” problem: use scoped projections rather than separate endpoints:

message GetOrderRequest {
  string order_id = 1;

  // Callers with INTERNAL_READ scope receive all fields.
  // External callers receive only the public projection.
  // The same RPC serves both — authorization determines the projection.
  FieldMaskScope scope = 2;
}

enum FieldMaskScope {
  FIELD_MASK_SCOPE_PUBLIC = 0;    // external callers: customer-visible fields
  FIELD_MASK_SCOPE_INTERNAL = 1;  // internal callers: + audit, cost, state flags
  FIELD_MASK_SCOPE_ADMIN = 2;     // ops callers: + all internal diagnostics
}

message Order {
  // Public fields — always returned
  string order_id = 1;
  OrderStatus status = 2;
  google.protobuf.Timestamp created_at = 3;

  // Internal fields — returned only to INTERNAL_SCOPE callers
  // Stripped at the API gateway for external requests
  string internal_routing_key = 100;
  CostAllocation cost_allocation = 101;

  // Admin fields — returned only to ADMIN_SCOPE callers
  repeated AuditEvent audit_trail = 200;
}

This approach keeps one canonical API, one proto spec, one set of tests. The authorization layer determines which fields a caller receives. The API gateway strips internal fields from external responses. The same spec, with scope annotations, documents both tiers.

On internal API governance: internal APIs need the same review gates as public APIs, even if the review is lighter. Some organizations enforce this via a service registry where every internal API must be registered, and the registry enforces naming and schema standards automatically.

1.9 Mixing Control-Plane and Data-Plane APIs

This anti-pattern occurs when a single API service handles both resource management (create a cluster, update a configuration, rotate a secret) and the high-frequency operational traffic that those resources serve (process a transaction, ingest a telemetry event). The same service, the same load balancer, the same deployment unit. A configuration change that causes a brief control-plane outage also takes down the data plane. A traffic spike on the data plane starves the management operations that operators need most during an incident.

Defining the planes: these terms come from networking and are now standard in cloud platform design.

PlanePurposeTypical TPSLatency requirementCaller
Control planeManage and configure resourcesLow (10s–100s/s)Relaxed (100ms–seconds)Operators, automation, UI
Data planeServe the workload those resources defineHigh (1,000s–millions/s)Strict (single-digit ms)End-users, services, devices

Real-world examples of the split done correctly:

  • Kubernetes: kube-apiserver is the control plane that creates Deployments, update ConfigMaps, scale ReplicaSets. The actual pod-to-pod traffic it orchestrates is the data plane. A kube-apiserver brownout does not stop running pods from serving traffic.
  • AWS API Gateway: The management API (create/update/delete routes, authorizers, stages) is the control plane. The actual HTTP proxy that forwards requests to Lambda or ECS is the data plane.

The scaling difference between management traffic and operational traffic is invisible until it isn’t. The consequence: Two failure modes, both serious.

  • First, data-plane load starves control-plane availability. A traffic spike on the data plane consumes all available threads, connections, and CPU. Operators cannot reach the management API to make the configuration change that would fix the problem.
  • Second, control-plane deployments risk data-plane availability. A risky configuration change deployed to the unified service takes down both planes together. A misconfigured authentication change gates all traffic, including the operational traffic that cannot tolerate any interruption.

Better approach:

Separate the planes at the service level, not just at the routing level. A reverse proxy that routes /mgmt/* to one backend and /v1/* to another on the same process does not achieve the isolation you need.

// Control-plane API — management operations, low TPS, relaxed latency
service OrderConfigService {
  // Create/update routing rules — takes effect asynchronously
  rpc UpsertRoutingRule(UpsertRoutingRuleRequest) returns (RoutingRule);
  rpc DeleteRoutingRule(DeleteRoutingRuleRequest) returns (google.protobuf.Empty);
  rpc ListRoutingRules(ListRoutingRulesRequest) returns (ListRoutingRulesResponse);

  // Capacity and rate limit configuration
  rpc SetRateLimit(SetRateLimitRequest) returns (RateLimit);

  // Returns async job — config changes propagate eventually to data plane
  rpc TriggerConfigSync(TriggerConfigSyncRequest) returns (ConfigSyncJob);
}

// Data-plane API — operational traffic, high TPS, strict latency
service OrderService {
  // Reads routing rules from LOCAL CACHE — never calls control plane in-band
  rpc CreateOrder(CreateOrderRequest) returns (Order);
  rpc GetOrder(GetOrderRequest) returns (Order);
  rpc ListOrders(ListOrdersRequest) returns (ListOrdersResponse);
}
  • Config propagation: the data plane must not call the control plane synchronously on the hot path. Configuration is pushed from the control plane to the data plane via an event stream or periodically polled and cached locally. The data plane starts with the last known good configuration and operates independently if the control plane is temporarily unavailable.
  • Deployment and SLA differences: control-plane deployments can be careful, canary-gated, and slow because the cost of a management API degradation is low (operators retry). Data-plane deployments should be fast and automated with aggressive auto-rollback because the cost of data-plane degradation is direct user impact.

Section 2: Contract & Consistency Anti-Patterns


2.1 Inconsistent Naming Across APIs

This anti-pattern is fairly common with evolution of API, e.g., EC2 uses CreateTags, ELB uses AddTags, RDS uses AddTagsToResource, Auto Scaling uses CreateOrUpdateTagswith four different verb shapes for the same semantic across four services.

Better approach: Establish a canonical vocabulary before first public release. For lifecycle operations: Create, Get, List, Update, Delete. Use id (server-assigned) vs name (client-specified) consistently. Use google.protobuf.Timestamp for all time values, never strings, never epoch integers.

message Order {
  string order_id = 1;                          // server-assigned ID
  string customer_name = 2;                     // client-specified name
  google.protobuf.Timestamp created_at = 3;     // typed timestamp, never string
  google.protobuf.Timestamp updated_at = 4;
  OrderStatus status = 5;                       // enum, not string, not int
}

enum OrderStatus {
  ORDER_STATUS_UNSPECIFIED = 0;  // always include; proto3 default
  ORDER_STATUS_PENDING = 1;
  ORDER_STATUS_CONFIRMED = 2;
  ORDER_STATUS_CANCELLED = 3;
}

2.2 Wrong HTTP Verb for the Operation

Despite adopting REST, I have seen companies misusing verbs like PATCH /orders/{id} that replaces the entire resource. GET /reports/generate that inserts a database record.

Note on GraphQL and gRPC: Both protocols legitimately tunnel all operations through HTTP POST. This is an intentional protocol design choice andnot an anti-pattern but it must be documented explicitly, and REST-layer middleware (caches, proxies, WAFs) must be configured to account for it.

VerbSemanticsIdempotentSafe
GETRetrieveYesYes
PUTFull replaceYesNo
PATCHPartial updateConditionallyNo
POSTCreate / non-idempotentNoNo
DELETERemoveYesNo

2.3 Breaking API Changes Without Versioning

A breaking change without versioning can easily break clients, e.g., a field renamed from customerId to customer_id, an error code that was 400 becomes 422, a previously optional field becomes required.

Safe (no version bump): adding optional request fields, adding response fields, adding new operations, making required fields optional. Never safe without a version bump: removing/renaming fields, changing field types, changing error codes for existing conditions, splitting an exception type, changing default behavior when optional inputs are absent.


2.4 Hyrum’s Law: Changing Semantic Behavior Without Versioning

With this anti-pattern, you fix a bug where ListOrders returned insertion order instead of alphabetical. You update an error message wording. You tighten validation. All of these feel internal. None are.

Better approach: Document everything observable. Use structured error fields (resource IDs, machine-readable codes) so clients never parse message strings. Treat any observable change including ordering, error message wording, validation leniency as potentially breaking.


2.5 Postel’s Law Misapplied: Silently Accepting Bad Input

This anti-pattern occurs when an API that accepts quantity: -5 and treats it as 0. An endpoint that silently drops unknown fields, then later adds a field with the same name with different semantics. An API that accepts both camelCase and snake_case then a new field orderType collides with legacy alias order_type.

Better approach: Be strict at the boundary. Reject invalid input with a structured ValidationException. Accept unknown fields only if explicitly designed for forward compatibility. Never silently coerce.


2.6 Bimodal Behavior

In this scenario, under normal load, ListOrders returns a complete consistent list with 200. Under high load, it silently returns a partial list still with 200.

Better approach: Your degraded paths must return consistent response shapes and correct status codes. A timeout is a 503 with Retry-After. A partial result is not a 200.


2.7 Leaky Abstractions

Examples of leaky abstractions include error messages contain internal ORM table names; pagination tokens are readable base64 JSON containing your database cursor.

Better approach: Map your domain model to your API, not your implementation. Pagination tokens must be opaque, encrypted, and versioned. Internal identifiers and infrastructure topology must never be inferred from responses.


2.8 Missing or Inconsistent Input Validation

This occurs when some fields are validated strictly, others silently truncated. The same field accepts null, "", and "0" on different endpoints.

Better approach: Validate at the boundary, consistently, for every operation.

message ValidationException {
  string message = 1;          // human-readable — never parse this in code
  string request_id = 2;
  repeated FieldViolation field_violations = 3;
}
message FieldViolation {
  string field = 1;            // "order.items[2].quantity"
  string description = 2;      // "must be greater than 0, got -5"
}

Section 3: Implementation Efficiency Anti-Patterns


3.1 N+1 Queries and ORM Abuse

In this case, you might have a ListOrders endpoint that fetches the list in one query, then issues a separate query per order for customer details, then another per order for line items. With 100 orders: 201 database round trips for what should be 1.

Network cost: Each cloud database round trip costs 1–5ms. 4,700 round trips = 4.7–23.5 seconds of pure network overhead before a byte of business logic executes. As covered in How Abstraction Is Killing Software, every layer crossing a network boundary multiplies the failure surface and latency budget.

Better approach: Return summary structures with commonly needed fields. Audit query plans with production-scale data before launch. Use eager loading for related data.


3.2 Missing Pagination

In this case, you might have a ListOrders endpoint that returns all results in a single response. Works at launch with small datasets. At scale some accounts have millions of records and responses become hundreds of megabytes, timeouts multiply, and clients start crashing on deserialization. Retrofitting pagination is a breaking change. If your endpoint always returned everything and you start returning a page with a next_page_token, clients that assumed completeness silently miss data. For example, EC2’s original DescribeInstances had no pagination. As customer instance counts grew into the thousands, responses became megabyte-scale XML documents that timed out and crashed clients. Retrofitting required making pagination opt-in legacy callers continued hitting the unbounded path for years after the fix shipped.

Guidance: every list operation must be paginated before first release:

  1. All List* operations that return a collection MUST be paginated no exceptions. The only exemption is a naturally size-limited result like a top-N leaderboard.
  2. Only one list per operation may be paginated. If you need to paginate two independent collections, expose two operations.
  3. Paginated results SHOULD NOT return the same item more than once across pages (disjoint pages). If the sort order is not an immutable strict total ordering, provide a temporally static view or snapshot the result set at the time of the first request and page through the snapshot.
  4. Items deleted during pagination SHOULD NOT appear on later pages.
  5. Newly created items MAY appear on not-yet-seen pages, but MUST appear in sorted order if they do.

The canonical request/response shape (REST and gRPC should follow the same field naming like page_size in, next_page_token out):

message ListOrdersRequest {
  // Optional upper bound — service may return fewer. Default is service-defined.
  // Client MUST NOT assume a full page means there are no more results.
  int32 page_size = 1 [(validate.rules).int32 = {gte: 0, lte: 1000}];

  // Opaque token from previous response. Absent on first call.
  string page_token = 2;

  // Filter parameters — MUST be identical on every page of the same query.
  // Service MUST reject a request where filters change mid-pagination.
  OrderFilter filter = 3;
}

message ListOrdersResponse {
  repeated OrderSummary orders = 1;

  // Absent when there are no more pages. Clients MUST stop when this is absent.
  // Never an empty string — absent means done, empty string is ambiguous.
  string next_page_token = 2;

  // Optional approximate total — document clearly that this is an estimate.
  // Do NOT guarantee an exact count; that requires a full scan on every call.
  int32 approximate_total = 3;
}

page_size is an upper bound, not a target: the service MUST return a next_page_token and stop early when its own threshold is exceeded. Attempting to fill a page to meet page_size for a highly selective filter on a large dataset creates an unbounded operation.

Changing page_size between pages is allowed: it does not change the result set, only how it is partitioned. Changing filter parameters is not allowed and must be rejected.


3.3 Pagination Token Anti-Patterns

Every one of the following mistakes has been made in production by major APIs. Each creates a permanent contract liability.

  • Readable token (leaks implementation): When you restructure your database, the token format is a public contract you cannot change. Clients construct tokens manually to jump to arbitrary offsets, bypassing your access controls. Making backwards-compatible changes to a plain-text token format is nearly impossible.
// Decoded token — client immediately knows your DB cursor format
{ "offset": 500, "shard": "us-east-1a", "table": "orders_v2" }
  • Token derived by client (S3 ListObjects mistake): S3’s original ListObjects required callers to derive the next token themselves: check IsTruncated, use NextMarker if present, otherwise use the Key of the last Contents entry. Every S3 client library had to implement this multi-step derivation. When S3 needed to change the pagination algorithm, all that client logic became incorrect. ListObjectsV2 was the clean-break solution an explicit opaque ContinuationToken issued by the server.
  • Token that never expires: A non-expiring token makes schema migrations impossible. If your pagination token format encodes version 1 of your database schema and you ship version 2, you must maintain a decoder for every token ever issued indefinitely. A 24-hour expiry gives you a bounded window after which all outstanding tokens are on the current format.
  • Token usable across users: A token generated for user A contains enough context to enumerate user B’s resources if the user check is missing. This is a data isolation vulnerability, not just a correctness bug.
  • Token that influences AuthZ: The service must not evaluate permissions differently based on whether a pagination token is present or what it contains. Authorization must be re-evaluated on every page request using the caller’s current credentials, not credentials cached inside the token.
// What the service stores inside the encrypted token — never visible to callers
message PaginationTokenPayload {
  string account_id = 1;      // bound to caller's account
  int32 version = 2;           // token format version for forward compatibility
  string cursor = 3;           // internal cursor — DB row ID, sort key, etc.
  google.protobuf.Timestamp issued_at = 4;   // for expiry enforcement
  bytes filter_hash = 5;       // hash of filter params — reject if changed
}
// This struct is AES-GCM encrypted before being base64-encoded and returned as next_page_token.
// The client sees only an opaque string. The server decrypts and validates on every use.

Client usage pattern: SDK helpers should abstract this loop, but every client must implement it correctly when calling raw:

page_token = None
while True:
    response = client.list_orders(
        filter={"status": "PENDING"},
        page_size=100,
        page_token=page_token   # None on first call
    )
    process(response.orders)
    page_token = response.next_page_token
    if not page_token:
        break   # no token = no more pages; do NOT check len(orders) < page_size

# NOTE: len(orders) < page_size does NOT mean last page.
# The service may return fewer results for internal reasons (execution time limit,
# scan limit, etc.) and still issue a next_page_token. Always check the token.

The single most common client-side pagination bug is treating a short page as a signal that pagination is complete.


3.4 Filtering Anti-Patterns

Filtering is where inconsistency compounds fastest as every team makes slightly different choices about semantics, validation, and edge cases, and callers cannot predict the behavior without reading the documentation for every endpoint individually.

The standard AND/OR semantic: all filtering implementations should follow EC2’s model: multiple values for a single attribute are OR’d; multiple attributes are AND’d. The order of attributes must not affect the result (commutative).

# EC2 canonical example
aws ec2 describe-instances \
  --filter Name=instance-state-name,Values=running \
  --filter Name=image-id,Values=ami-12345 \
  --filter Name=tag-value,Values=prod,test

# Equivalent SQL semantics:
# (instance-state-name = 'running')
# AND (image-id = 'ami-12345')
# AND (tag-value = 'prod' OR tag-value = 'test')

Swapping the order of the three filter arguments must return an identical result set. Clients must never need to order their filters to get correct behaviour.

Include/exclude filter variants for date, time, and status fields:

# Negation filter: exclude terminated instances from a different AZ
aws ec2 describe-instances \
  --filter Name=instance-state-name,Values=terminated,operator=exclude \
  --filter Name=availability-zone,Values=us-east-1a,operator=include

Timestamp fields MAY support not-before / not-after semantics. When supported, document the semantics exactly and validate that the provided value is a well-formed timestamp.

Filter structure in protobuf: use an enum for attribute names so the set of supported filters is machine-readable, and a validated pattern for values so wildcards and injection vectors are controlled:

message ListOrdersRequest {
  repeated Filter filters = 1 [(validate.rules).repeated.max_items = 10];
  int32 page_size = 2;
  string page_token = 3;
}

message Filter {
  FilterAttribute name = 1;    // enum — only supported attributes accepted
  repeated string values = 2   // OR'd together; max bounded
    [(validate.rules).repeated = {min_items: 1, max_items: 20}];
  FilterOperator operator = 3; // default INCLUDE; EXCLUDE for negation
}

enum FilterAttribute {
  FILTER_ATTRIBUTE_UNSPECIFIED = 0;
  FILTER_ATTRIBUTE_STATUS = 1;       // maps to Order.status
  FILTER_ATTRIBUTE_REGION = 2;       // maps to Order.region
  FILTER_ATTRIBUTE_CREATED_AFTER = 3;  // timestamp lower bound
  FILTER_ATTRIBUTE_CREATED_BEFORE = 4; // timestamp upper bound
  // Every value here must correspond to a field returned in OrderSummary.
  // Never add a filter attribute for an internal field not in the response.
}

enum FilterOperator {
  FILTER_OPERATOR_INCLUDE = 0;  // default — only matching resources returned
  FILTER_OPERATOR_EXCLUDE = 1;  // matching resources excluded from results
}

Filtering vs. specifying a list of IDs: these are different operations and must not be conflated. A filter is a predicate applied to the result set and it does not guarantee fetching a specific resource. Fetching a known set of resource IDs is a batch read (BatchGetOrders) and belongs in the batch operations standard, not in the filter parameter.

Flat parameters vs. structured filter list: two common shapes exist. Flat parameters (?status=PENDING&region=us-east) are simpler for simple cases and easier to cache with HTTP GET semantics. A structured filters list (as above) is more extensible and handles negation, wildcards, and complex predicates cleanly. Do not mix shapes across endpoints.


3.5 Chatty APIs and Network Latency Multiplication

Rendering a single page requires six sequential API calls. Each is 20ms. Sequential total: 120ms of pure network time before rendering begins. For example, Netflix’s move to microservices initially produced exactly this. Their solution: the BFF (Backend for Frontend) pattern, which is a purpose-built aggregation layer that parallelizes the six calls and returns one tailored response to the client.

Better approach: Design batch and composite read operations for primary use cases. Where callers need related resources together, provide projections. Parallelize what can be parallelized in your aggregation layer.


3.6 Synchronous APIs for Long-Running Operations

This is another pattern resulting from poor understanding of API behavior, e.g., POST /reports/generate blocks for 45 seconds, or it returns 202 Accepted (or 202 OK) with no body, no job ID, no link to check status, no way to cancel, and no way to know when it is safe to retry. Another related scenario is an API that was designed for a specific UI assumption, e.g., “the UI will only ever submit 100 IDs” but is exposed as a general API. When an automation script submits 10,000 IDs, the synchronous operation times out at the load balancer, the client retries, and two copies of the same job are now running. The API has no idempotency token, no job ID to check for an in-progress operation, and no way to cancel the duplicate. The missing async API primitives:

  1. No requestId in the 202 response: the caller has no handle to reference the job in subsequent calls, in logs, or in support tickets
  2. No status endpoint: the caller cannot poll for completion; the only signal is silence until a webhook fires
  3. No cancel operation: a misconfigured job consuming resources cannot be stopped without operator intervention
  4. No idempotency on submission: submitting the same job twice creates two jobs; there is no way to detect an in-progress duplicate
  5. No bounded input validation: the operation accepts an unbounded number of IDs because the UI never sends more than 100, but the API contract enforces no limit; automation sends 100,000 and the job runs for hours

Better approach is complete async job lifecycle:

// Submission: returns immediately with a Job handle
rpc StartExport(StartExportRequest) returns (Job) {
  option (google.api.http) = { post: "/v1/exports", body: "*" };
  // Response: HTTP 202 Accepted
}

// Status + result polling
rpc GetJob(GetJobRequest) returns (Job) {
  option (google.api.http) = { get: "/v1/jobs/{job_id}" };
}

// Cancellation — idempotent; safe to call multiple times
rpc CancelJob(CancelJobRequest) returns (Job) {
  option (google.api.http) = { post: "/v1/jobs/{job_id}:cancel", body: "*" };
}

message StartExportRequest {
  string client_token = 1;  // idempotency — same token returns existing job, not a new one
  repeated string record_ids = 2 [(validate.rules).repeated = {
    min_items: 1,
    max_items: 1000  // enforced at boundary — not a UI assumption baked into code
  }];
  ExportFormat format = 3;
}

message Job {
  string job_id = 1;              // stable handle for all subsequent calls
  string request_id = 2;         // trace ID for this submission specifically
  JobStatus status = 3;
  google.protobuf.Timestamp submitted_at = 4;
  google.protobuf.Timestamp completed_at = 5;  // absent until terminal state
  string result_url = 6;          // present only when status = SUCCEEDED
  JobError error = 7;             // present only when status = FAILED
  string self_link = 8;           // href to GET this job — no client URL construction needed
  string cancel_link = 9;         // href to cancel — clients should use these, not construct URLs
  int32 estimated_seconds = 10;   // hint for polling interval; not a guarantee
}

enum JobStatus {
  JOB_STATUS_UNSPECIFIED = 0;
  JOB_STATUS_QUEUED = 1;
  JOB_STATUS_RUNNING = 2;
  JOB_STATUS_SUCCEEDED = 3;
  JOB_STATUS_FAILED = 4;
  JOB_STATUS_CANCELLED = 5;
  JOB_STATUS_CANCELLING = 6;  // in-progress cancel — may still complete
}

The 202 Accepted response body must include:

  • job_id — the durable handle
  • self_link — the URL to poll (clients must not construct this)
  • cancel_link — the URL to cancel
  • estimated_seconds — polling hint
  • request_id — for logging and support correlation
HTTP 202 Accepted
Location: /v1/jobs/job-a3f9c2
{
  "job_id": "job-a3f9c2",
  "status": "QUEUED",
  "request_id": "req-7d2e1a",
  "self_link": "/v1/jobs/job-a3f9c2",
  "cancel_link": "/v1/jobs/job-a3f9c2:cancel",
  "estimated_seconds": 30
}

The Location header is standard HTTP for 202 include it so HTTP clients that follow redirects and standard library polling helpers work without custom code.

Idempotency on submission prevents duplicate jobs: if a client submits with client_token: "export-2024-q1" and receives a timeout, the retry with the same token returns the existing Job.

Bounded input enforced at the boundary: the max_items: 1000 constraint in StartExportRequest is enforced by protoc-gen-validate at the gRPC boundary instead of application code. If the constraint needs to change, it changes in the proto spec and the enforcement changes with it.


3.7 Batch Operations with Mixed Success/Error Lists

This occurs when a batch endpoint returns a single flat list where successes and failures are distinguished only by the presence of an error field. Callers must iterate every entry to determine outcome. For example, Firehose’s PutRecordsBatch uses this anti-pattern with a single mixed list. The correct model (adopted in newer AWS APIs) separates success and failure lists:

message BatchCreateOrdersResponse {
  repeated Order created_orders = 1;
  repeated OrderError failed_orders = 2;
  // HTTP 200 even if all items failed — per-item failure is in failed_orders
  // HTTP 400 only if the batch itself is malformed
}
message OrderError {
  string client_request_id = 1;  // correlates to request entry
  string error_code = 2;
  string message = 3;
}

Section 4: Idempotency & Transaction Anti-Patterns


4.1 Duplicate Detection Masquerading as True Idempotency

I wrote about this previously at How Duplicate Detection Became the Dangerous Impostor of True Idempotency and this issue arises when you create endpoint checks for an existing resource with the same name and returns it if found, calling this “idempotency.”

The correct idempotency token flow:

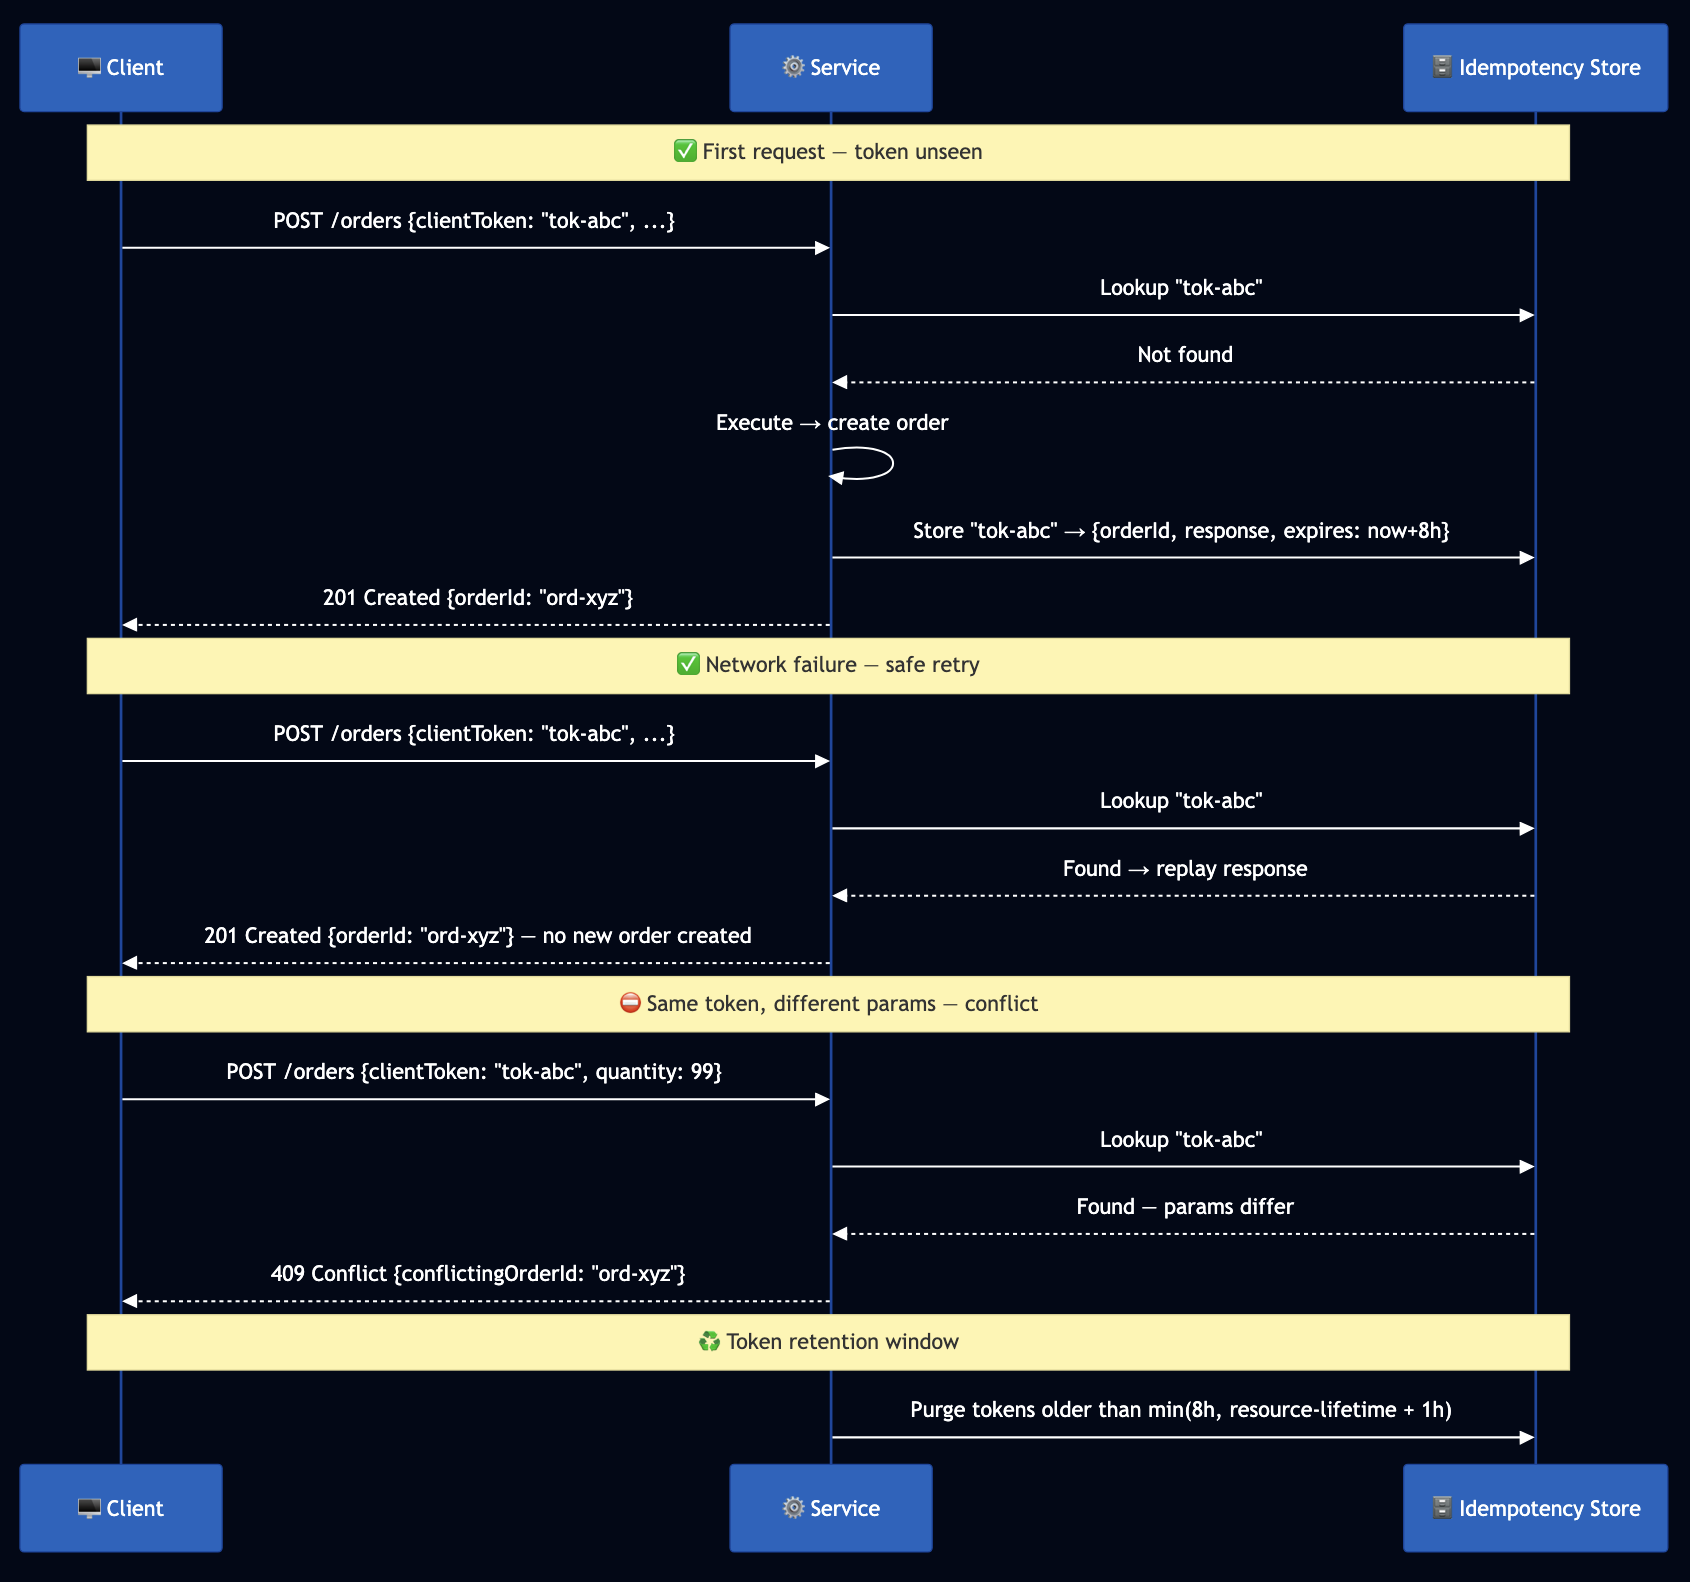
Stripe’s idempotency key is the canonical implementation. Every POST accepts an Idempotency-Key header. Stripe stores the key and the exact response. Same key within 24 hours replays the original response without re-executing. Same key with a different body returns 422.

Failure mode of duplicate detection: A response is lost in transit. The client retries. Meanwhile, another actor deleted the resource and a third created a new one with the same name. Your “idempotent” endpoint returns the new resource which the original client neither created nor controls.


4.2 Missing Idempotency Tokens on Create Operations

This scenario may occur when POST /orders returns an order ID without clientToken. The client gets a timeout. Retry = potential duplicate. No retry = potential data loss. For example, early payments APIs had this problem. A double-charge scenario: customer clicks Pay, network times out, app retries, customer charged twice. Stripe, Adyen, and Braintree all mandate idempotency keys for payment operations.

message CreateOrderRequest {
  // SDK auto-generates when absent; callers may provide their own.
  // Must be at least 64 ASCII printable characters for uniqueness.
  optional string client_token = 1;
  string customer_id = 2;
  repeated OrderItem items = 3;
}

4.3 Transaction Boundary Violations

I wrote about this anti-pattern previously at Transaction Boundaries: The Foundation of Reliable Systems. This occurs when a single API call updates two separate resources with no atomicity guarantee. The first update succeeds; the service crashes before the second. Caller retries; first update applies twice.

Better approach: Document atomicity guarantees explicitly. For cross-service consistency, use the Saga pattern with compensating transactions.


4.4 Full Update via PATCH (Implicit Field Deletion)

This occurs when PATCH /orders/{id} replaces the entire resource. Fields not included are deleted. A mobile client updating the shipping address silently deletes the contact email. For example, GitHub’s current v3 API is explicit: PATCH applies partial updates, PUT applies full replacement — documented unambiguously for every endpoint.

message UpdateOrderRequest {
  string order_id = 1;
  Order order = 2;
  // Only fields in update_mask are modified.
  // paths = ["shipping_address"] ? only shipping_address is touched
  google.protobuf.FieldMask update_mask = 3;
}

4.5 Missing Optimistic Concurrency Control

This occurs when two clients GET the same order, both modify it, both PUT back. The last write silently overwrites the first. For example, Kubernetes uses server-side apply with field ownership tracking and returns 409 Conflict with the specific fields in conflict. The ETag / If-Match pattern is the REST equivalent.

GET /orders/123 ? { ..., "version": "v7" }
PATCH /orders/123 + If-Match: v7
# If order is now v8: HTTP 409 Conflict { "current_version": "v8" }

4.6 Ignoring Concurrent Operation Safety

In this scenario, an API that allows parallel create-and-delete on the same resource without concurrency safety. A long-running create that can be invoked a second time while the first is in flight.

Better approach: Document concurrency semantics per operation. For long-running creates: check for an in-progress operation before starting a new one. Use idempotency tokens to prevent parallel retries from compounding.


Section 5: Error Handling Anti-Patterns


5.1 Opaque, Non-Actionable Errors

This anti-pattern occurs with poorly defined errors like: {"error": "Something went wrong"}. An HTML error page from a load balancer served as an API response. The same ValidationException returned for “field missing,” “field too long,” and “field contains invalid characters.”

Better approach: I wrote about better error handling previously at Building Robust Error Handling with gRPC and REST APIs. Seven standard exception types cover nearly all scenarios:

ExceptionHTTPRetryable
ValidationException400No
ServiceQuotaExceededException402No (contact support)
AccessDeniedException403No
ResourceNotFoundException404No
ConflictException409No (needs resolution)
ThrottlingException429Yes (honor Retry-After)
InternalServerException500Yes (with backoff)

Include request_id in every error response for support correlation. Include retry_after_seconds in 429 and 500 responses.


5.2 Error Messages That Clients Must Parse

This occurs where an API error looks like "ValidationException: The field 'order.items[2].quantity' must be greater than 0." A client parses the string to extract the field path. Major cloud providers have been forced to freeze exact error message phrasing for years because clients parse them. Changing a comma placement breaks production integrations.

Better approach: As described in Building Robust Error Handling with gRPC and REST APIs, error message text is for humans reading logs. Any information a program acts on must be in structured fields, never embedded in the message string.


5.3 Leaking Internal Information in Errors

Error messages contain database hostnames, stack traces, SQL fragments, or internal ARNs. 500 that says NullPointerException at com.internal.service.OrderProcessor:237.

Security principle: Return only information applicable to that request and requester. An unauthorized caller asking for a resource that does not exist receives 403 AccessDeniedException, not 404 ResourceNotFoundException that reveals non-existence is as informative as confirming existence.

Better approach: Catch and re-throw all dependency exceptions as service-defined error types. Include only a requestId for support lookup.


5.4 Exception Type Splitting and Proliferation

Splitting ConflictException into ResourceAlreadyExistsException, ConcurrentModificationException, and OptimisticLockException after release. Clients catching ConflictException silently miss the new subtypes.

The rule: Splitting an existing exception type is a breaking change. Adding fields to an existing exception type is always safe. Add new exception types only for genuinely new scenarios triggered by new optional parameters.


Section 6: Resilience & Operations Anti-Patterns


6.1 Missing Retry Safety in the SDK

This occurs when an SDK retrying any 5xx response including non-idempotent POST. No jitter causing synchronized retry storms.

Correct retry policy:

  • Retry only: idempotent operations (GET, PUT, DELETE) OR POST with clientToken
  • Retry on: 429 (honor Retry-After), 500 (if retryable: true), 503
  • Never retry: 400, 401, 403, 404, 409
  • Backoff: base 100ms, 2x multiplier, ±25% jitter, max 10s, max 3 attempts

6.2 Retry Storms and Missing Bulkheads

This occurs where all clients receive 429 simultaneously. All back off for exactly 2^n * 100ms. All retry at the same moment. The retry wave is as large as the original spike. I wrote previously Robust Retry Strategies for Building Resilient Distributed Systems that shows effective strategies for robust retries. For example, Netflix built Hystrix specifically to isolate downstream dependency thread pools. Slow responses in one pool cannot bleed into others. Circuit breakers open when error rates exceed thresholds, failing fast rather than queueing.


6.3 Hard Startup Dependencies

This occurs when a service cannot start unless all dependencies are reachable. During a dependency outage, no new instances can start so the deployment stalls and you cannot deploy fixes when you most need to.

Better approach: I wrote about this previously at Zero-Downtime Services with Lifecycle Management on Kubernetes and Istio, which shows safe startup and shutdown. Start despite all dependencies unavailable. Initialize connectivity lazily. Distinguish not yet ready (503 + Retry-After) from unhealthy (500). Degrade gracefully rather than refuse to start.


6.4 Missing Graceful Shutdown

This is another common anti-pattern, e.g., a pod receives SIGTERM and exits immediately, dropping in-flight requests. I have seen it caused a data loss because a locally saved data failed to synchronize with the remote server before the pod was shutdown.

Correct sequence: Stop accepting new connections -> complete in-flight requests (bounded timeout) -> flush async work -> exit. As covered in Zero-Downtime Services with Lifecycle Management, getting any stage wrong produces dropped requests during every deployment.


6.5 No Pre-Authentication Throttling

This occurs when throttling applied only after auth. An attacker sends millions of requests that exhaust authentication infrastructure before per-account quota applies.

Better approach: Lightweight rate limiting before authentication (source IP / API key prefix) as first-line defense. Per-account throttling after auth. Both layers required. Configuration updatable without deployment.


6.6 Shallow Health Checks

I have seen companies touting 99.99% availability where their /health returns 200 as long as the HTTP server is running, regardless of whether the database connection pool is exhausted or the cache is unreachable.

EndpointPurposeChecked by
/health/liveProcess aliveKubernetes liveness probe
/health/readyCan handle requestsReadiness probe, load balancer
/health/deepFull end-to-end validationDeployment pipeline gate

6.7 Insufficient Metrics, SLAs, and Alerting

I wrote about From Code to Production: A Checklist for Reliable, Scalable, and Secure Deployments that shows metrics/alerting must be configured for API deployment. If you have insufficient metrics like only request count and binary error rate tracked without latency percentiles or defined SLA then diagnosing failure will be hard . For example, alerts fire at 100% error rate and the entire service is down before anyone is notified.

Better approach: Instrument every operation with request rate, error rate (4xx vs 5xx), latency at P50/P95/P99/P999, and downstream dependency health. Set alert thresholds below your SLA, e.g. if P99 SLA is 500ms, alert at 400ms.


6.8 No “Big Red Button” and Missing Emergency Rollback

This occurs when there is no fast path to revert a bad deployment. Configuration changes require a full deployment to roll back. No tested runbook.

Better approach: Feature flags togglable without deployment (tested weekly). Sub-5-minute rollback pipeline. Pre-tested load shedding with documented decision thresholds. Runbooks practiced in drills, not just read.


6.9 Backup Communication Channels Not Tested

Incident response plans rely on Slack to coordinate a Slack outage. Runbooks stored in Confluence, down when cloud IAM is broken. For example, Google’s 2017 OAuth outage logged 350M users out of devices and services. Teams expected to coordinate via Google Hangouts, which was also down. Incident coordination was hampered by the incident. Recovery took 12 hours.


6.10 Phased Deployment Anti-Patterns and Missing Automation

This occurs when you deploy globally in a single wave. Rollback criteria is “wait and see.” Canary populations too small. Rollback requires human decision-making at 3 AM. I wrote about Mitigate Production Risks with Phased Deployment that shows how phased deployment can mitigate production releases. Automated phased deployment:

  1. Deploy 1-5% canary
  2. Run automated integration tests against canary
  3. Monitor SLA metrics for bake period (10 minutes)
  4. Auto-rollback if any threshold breaches without human intervention
  5. Promote to next fault boundary only on clean bake

Section 7: Security, Data Privacy & Lifecycle Anti-Patterns


7.1 Missing Boundary Validation: Specs That Don’t Enforce

In this case, an OpenAPI spec exists but is not enforced at runtime and is documentation only. A proto definition marks fields as optional but the service processes requests where required fields are absent and produces undefined behavior. Input validation is implemented inconsistently in business logic rather than at the API boundary.

Better approach: Enforce the spec at the boundary. For OpenAPI/REST: Use middleware that validates every request against the OpenAPI schema before it reaches business logic. Libraries like express-openapi-validator (Node.js), connexion (Python), or API Gateway request validation do this. Every field type, pattern, range, and required constraint in the spec is automatically enforced.

# openapi.yaml — enforced at runtime, not just documentation
components:
  schemas:
    CreateOrderRequest:
      type: object
      required: [customer_id, items]
      properties:
        client_token:
          type: string
          minLength: 16
          maxLength: 128
        customer_id:
          type: string
          pattern: '^cust-[a-z0-9]{8,}$'
        items:
          type: array
          minItems: 1
          maxItems: 100
          items:
            $ref: '#/components/schemas/OrderItem'

For gRPC/Protobuf: Use protoc-gen-validate (PGV), a protobuf plugin that generates validation code from annotations in your .proto files:

import "validate/validate.proto";

message CreateOrderRequest {
  // clientToken: optional but if present must be 16-128 printable ASCII chars
  optional string client_token = 1 [(validate.rules).string = {
    min_len: 16, max_len: 128
  }];

  // customer_id: required, must match pattern
  string customer_id = 2 [(validate.rules).string = {
    pattern: "^cust-[a-z0-9]{8,}$",
    min_len: 1
  }];

  // items: required, 1-100 items
  repeated OrderItem items = 3 [(validate.rules).repeated = {
    min_items: 1, max_items: 100
  }];
}

message OrderItem {
  string product_id = 1 [(validate.rules).string.min_len = 1];

  // quantity: must be positive
  int32 quantity = 2 [(validate.rules).int32.gt = 0];

  // price: must be non-negative
  double unit_price = 3 [(validate.rules).double.gte = 0.0];
}

This enforces validation at the boundary, before your business logic runs, using the same .proto file that is your source of truth. No duplicate validation code. No inconsistency between the spec and the enforcement.


7.2 PII Data Exposure in APIs

This anti-pattern exposes PII data like full credit card numbers, SSNs, or passport numbers returned in GET responses. Email addresses and phone numbers included in audit logs and error messages. User location data exposed in list endpoints without access controls. Responses cached at the CDN layer with no consideration of the PII they contain.

Better approach: Apply data minimization at the API layer and return only the fields a caller needs and is authorized to receive. I wrote Agentic AI for Automated PII Detection: Building Privacy Guardians with LangChain and Vertex AI to show how annotations to mark sensitive fields in your schema and AI agents can be used to detect violations:

import "google/api/field_behavior.proto";

message Customer {
  string customer_id = 1;
  string display_name = 2;

  // Sensitive: only returned to callers with PII_READ permission
  // Masked in logs: shown as "****@example.com"
  string email_address = 3 [
    (google.api.field_behavior) = OPTIONAL,
    // Custom option — your PII classification
    (pii.sensitivity) = HIGH
  ];

  // Never returned in list operations; only in GetCustomer with explicit consent
  string phone_number = 4 [(pii.sensitivity) = HIGH];

  // Tokenized before storage; never returned as plaintext
  string payment_method_token = 5;
}

Operational controls:

  • Never log full request/response bodies; use structured logging with explicit field allowlists
  • Apply response field filtering at the API gateway based on caller permissions
  • Scan API responses in CI/CD pipelines for PII patterns before deployment
  • Ensure pagination tokens do not contain PII
  • Cache keys must never contain PII; cached responses must never contain PII for a different caller

7.3 Missing Contract Testing

In this case, a service team ships an API. Client teams write integration tests against their own mock servers. The mock servers are written from the documentation, not from the actual service behavior. When the service changes, the mocks stay static. Clients discover the breaking change in production.

Consumer-driven contract testing reverses this: clients publish their expectations (the “contract” of what they call and what they expect back), and the service validates those contracts in its CI/CD pipeline. If the service changes in a way that breaks a client contract, the service’s build fails before the change is deployed.

I built an open-source framework specifically for this: api-mock-service and described in Contract Testing for REST APIs. The framework supports:

  • Recording real API traffic and generating mock contracts from it (no manual mock writing)
  • Replaying recorded responses in test environments
  • Validating that recorded behavior matches the current service
  • Contract assertions that run in CI/CD pipelines to catch regressions before deployment
  • Support for REST, gRPC, and asynchronous APIs
# Contract generated from real traffic — not hand-written
contract:
  name: create_order_success
  method: POST
  path: /v1/orders
  request:
    headers:
      Content-Type: application/json
    body:
      customer_id: "{{non_empty_string}}"
      items:
        - product_id: "{{non_empty_string}}"
          quantity: "{{positive_integer}}"
  response:
    status: 201
    body:
      order_id: "{{non_empty_string}}"
      status: PENDING
      created_at: "{{iso_timestamp}}"
  # This contract runs against the service in CI — if CreateOrder
  # changes its response shape, this test fails before deployment

Spec enforcement + contract testing = full boundary defense:

  • The OpenAPI or proto spec enforces what the service accepts
  • Contract tests verify what the service returns
  • Together they eliminate the “it works in mocks but breaks in production” class of failures

7.4 No API Versioning Strategy

There is no version identifier, or a single v1 with no plan for v2. Or major version bumps so frequent clients cannot keep up. For example, Twitter’s v1.0 deprecation gave clients weeks, not months, and broke thousands of integrations.

Better approach: Version from day one in the URL path (/v1/, /v2/). Run old versions in parallel until usage is zero. Communicate sunset timelines with 12+ months’ notice.


7.5 Poor or Missing Documentation

Documentation covers only the happy path. No failure modes, retry semantics, or idempotency semantics documented. Field descriptions say “the order ID” rather than valid values and behavior when absent.

Documentation is a contract: every field, every failure mode, every error code must be documented. Consumer-driven contract tests are a forcing function.


7.6 Insufficient Rate Limiting and Quota Management

In this scenario, no per-account rate limits exist. Rate limits fixed in code, not configurable without deployment. One client’s traffic starves all others. Throttling responses use 500 instead of 429 Too Many Requests with Retry-After.

GitHub’s rate limiting is a reference implementation. X-RateLimit-Limit, X-RateLimit-Remaining, and X-RateLimit-Reset headers in every response allow clients to implement proactive backoff. 429 with Retry-After when the limit is hit.


7.7 Caching Without Security Consideration

Examples of this anti-pattern surfaces include a CDN cached responses by keyed only on URL, serving account A’s private data to account B. Cache stores authorization decisions without accounting for permission revocation.

Better approach: I described best practices of caches in When Caching is not a Silver Bullet. Cache keys must include all authorization context. Authorization decisions must have TTLs reflecting how quickly permission changes take effect. Cache poisoning must be in your threat model.


7.8 No API Lifecycle Management and Missing Deprecation Path

This occurs when there is no process for retiring old API versions. Deprecated endpoints have no documented migration path. Or endpoints removed with insufficient notice. For example, Twilio’s classic API deprecation was managed over 18 months with migration guides, compatibility layers, and direct client outreach.

Better approach: Collect per-endpoint, per-client usage metrics before announcing deprecation. Block new clients. Provide migration docs and tooling. 12+ months’ lead time. Monitor until zero usage confirmed.


Quick Reference: Pre-Launch Checklist

API Design Philosophy

  • [ ] Spec written first (OpenAPI or proto) before any implementation code
  • [ ] OpenAPI/proto schema enforced at runtime boundary (PGV, openapi-validator)
  • [ ] API surface is small and composable; no UI-specific endpoints in the core API
  • [ ] Resources organized in a consistent URI hierarchy under namespaces
  • [ ] No bag-of-params / execute pattern; separate operations for separate actions
  • [ ] Standard protocol chosen (REST, gRPC, WebSocket, SSE), no custom RPC
  • [ ] Encoding chosen based on use case (protobuf binary for internal high-throughput)
  • [ ] Streaming APIs use gRPC streaming or WebSocket, not polling or custom framing

Contract & Consistency

  • [ ] Consistent naming vocabulary (nouns, verbs, field names, timestamps)
  • [ ] Correct HTTP verbs with documented semantics
  • [ ] No breaking changes without version bump
  • [ ] Hyrum’s Law review: what observable behaviors exist not in the contract?
  • [ ] Strict input validation on every field, every operation

Pagination & Filtering

  • [ ] Pagination on all list operations before first client, not after
  • [ ] Opaque, versioned, expiring, account-scoped pagination tokens
  • [ ] Filter semantics documented (AND across attributes, OR within values)

Idempotency & Transactions

  • [ ] clientToken on all create operations
  • [ ] Token mismatch returns 409 with conflicting resource ID
  • [ ] Transaction boundaries documented
  • [ ] PATCH implements partial update (field mask)
  • [ ] ETag / version token for optimistic concurrency

Error Handling

  • [ ] Structured error format with machine-readable codes
  • [ ] No internal implementation detail in error messages
  • [ ] Correct HTTP status codes; seven standard exception types
  • [ ] 404 vs 403: resource existence hidden from unauthorized callers

Security & Privacy

  • [ ] PII tagged in schema; data minimization applied per-endpoint
  • [ ] No PII in logs, error messages, or pagination tokens
  • [ ] PII scanning in CI/CD pipeline before deployment
  • [ ] Cache keys include authorization context

Resilience & Operations

  • [ ] Retry logic limited to idempotent or token-protected operations
  • [ ] Exponential backoff with jitter; Retry-After honored
  • [ ] Service starts despite all dependencies unavailable
  • [ ] Graceful shutdown tested (SIGTERM -> drain -> exit)
  • [ ] Pre-auth throttling + per-account quota + 429 with Retry-After
  • [ ] Three-layer health checks: live / ready / deep
  • [ ] Latency SLAs defined; alerts below SLA threshold
  • [ ] Phased deployment with automatic metric-gated rollback
  • [ ] Big Red Button identified, documented, and drill-tested
  • [ ] Backup incident communication channel tested independently

Contract Testing & Lifecycle

  • [ ] Contract tests generated from real traffic, run in CI/CD
  • [ ] API version in URL path (v1, v2) from day one
  • [ ] Documentation covers failure modes, idempotency, retry semantics
  • [ ] Usage metrics collected per endpoint for lifecycle decisions
  • [ ] Deprecation policy documented; sunset timelines published

Closing Thoughts

Above anti-patterns are based on my decades of experience in building and operating high traffic APIs. They share a common thread: they were invisible at design time, or the team assumed fixing them later would be cheaper. An idempotency contract is cheapest to design correctly before the first client. A spec-first approach catches URI design problems before any client builds against the wrong shape. A contract test catches breaking changes before deployment. The checklist above addresses these as a system because they compound. An unbounded response is worse with no pagination. A missing idempotency token is catastrophic with an aggressive retry policy. A leaky PII field is worse without boundary validation. Two practices matter more than any individual anti-pattern on this list:

  • Spec-first design: write the contract before writing the implementation. Review it with consumers before coding starts. Use it as the source of truth for both server stubs and client SDKs.
  • Contract testing: verify the contract continuously against the live service. Use recorded real traffic, not hand-written mocks. Run it in every CI/CD pipeline.

Further reading from this series:

September 21, 2024

Robust Retry Strategies for Building Resilient Distributed Systems

Filed under: API,Computing,Microservices — admin @ 10:50 am

Introduction

Distributed systems inherently involve multiple components such as services, databases, networks, etc., which are spread across different machines or locations. These systems are prone to partial failures, where one part of the system may fail while others remain operational. A common strategy for building fault-tolerant and resilient systems is to recover from transient failures by retrying failed operations. Here are some common use cases for implementing retries to maintain reliability in such environments:

  • Recover from Transient Failures such as network glitches, dropped packets, or temporary unavailability of services. These failures are often short-lived, and a simple retry may succeed without any changes to the underlying system.
  • Recover from Network Instability due to packet loss, latency, congestion, or intermittent connectivity can disrupt communication between services.
  • Recover from Load Shedding or Throttling where services may experience momentary overloads and are unable to handle incoming requests.
  • Asynchronous Processing or Eventual Consistency models may take time to converge state across different nodes or services and operations might fail temporarily if the system is in an intermediate state.
  • Fault Isolation in microservices architectures, where services are loosely coupled but depend on one another. The downstream services may fail temporarily due to a service restart, deployment or scaling activities.
  • Service Downtime affects availability of services but client application can use retries to recover from minor faults and maintain availability.
  • Load Balancing and Failover with redundant Zones/Regions so that when a request to one zone/region fails but can be handled by another healthy region or zone.
  • Partial Failures where one part of the system fails while the rest remains functional (partial failures).
  • Build System Resilience to allow the system to self-heal from minor disruptions.
  • Race Conditions or timing-related issues in concurrent systems can be resolved with retries.

Challenges with Retries

Retries help in recovering from transient or partial failures by resending requests, but they can worsen system overloads if not managed carefully. Here are some challenges associated with retries:

  • Retry Storms: A retry storm occurs when multiple clients or services simultaneously retry failed requests to an overloaded or recovering service. This flood of retries can exacerbate the problem and can lead to performance degradation or a self-inflicted Denial of Service (DoS) attack.
  • Idempotency and Data Consistency: Some operations are not idempotent and performing them multiple times can lead to inconsistent or incorrect results (e.g., processing a financial transaction multiple times).
  • Cascading Failures: Retrying can propagate failures upstream or to dependent services. For instance, when a service fails and clients retry excessively, which can overwhelm downstream services.
  • Latency Amplification: Retrying failed operations can increase end-to-end latency, as each retry adds a delay before successful resolution.
  • Amplified Resource Consumption: Retried operations consume additional CPU, memory, and bandwidth, potentially depleting resources at a faster rate. Even when services eventually succeed, the increased load from retries can harm the overall system.
  • Retry Loops or Infinite Retries: If a failed operation is retried continuously without ever succeeding, it can potentially lead to system crashes.
  • Threads and connections starvation: When a service invokes multiple operations and some fail, it may retry all operations, leading to increased overall request latency. If high timeouts are set, threads and connections remain occupied, blocking new traffic.
  • Unnecessary Retries on Non-Retryable Failures: Retrying certain types of failures, like authorization errors or malformed requests is unnecessary and wastes system resources.
  • Timeout Mismatch Between Services: If the timeout settings for retries between services are not aligned, a downstream service may still be processing a request while the upstream service retries or times out that can result in conflicting states.

Considerations for Retries

Here are some key considerations and best practices for implementing more effective and safer retry mechanisms in distributed systems, enhancing resilience while safeguarding system stability during periods of stress or failure:

  • Timeouts: Implement timeouts to prevent clients from waiting indefinitely for a response and reduce resource exhaustion (e.g., memory or threads) caused by prolonged waiting. The challenge lies in selecting the appropriate timeout value: if set too high, resources are wasted; if set too low, it can trigger excessive retries, which increases the risk of outages. It’s recommended to set timeouts that are tightly aligned with performance expectations, ideally less than 2-times your maximum response time to avoid thread starvation. Additionally, monitor for early warning signs by setting alarms when performance degrades (e.g., when P99 latency approaches 50% of the timeout value).
  • Timeout Budgeting: In complex distributed systems, timeout budgeting ensures that the total time taken by a request across multiple services doesn’t exceed an acceptable limit. Each downstream service gets a portion of the total timeout, so failure in one service doesn’t excessively delay the entire request chain.
  • Exponential Backoff: Implement exponential backoff to spread out retry attempts by gradually increasing the delay between retries, reducing the risk of overwhelming a failing component and allowing time for recovery. It’s important to cap the backoff duration and limit the total number of retries. Without these limits, the system might continue retrying unnecessarily even after the underlying issue has been resolved.
  • Jitter: Adding randomness (jitter) to the backoff process helps prevent synchronized retries that could lead to overload spikes. Jitter is useful for spreading out traffic spikes and periodic tasks to avoid large bursts of traffic at regular intervals for improving system stability.
  • Idempotency: Operations that are retried must be idempotent, meaning they can be safely repeated without causing unintended side effects (e.g., double payments or duplicated data).
  • Retry Limits: Retries should be capped at a certain limit to avoid endlessly retrying a failing operation. Retries should stop beyond a certain number of attempts and the failure should be escalated or reported.
  • Throttling and Rate Limiting: Implement throttling or rate limiting and control the number of requests a service handles within a given time period. Rate limiting can be dynamic, which is adjusted based on current load or error rates, and avoid system overloads during traffic spikes. In addition, low-priority requests can be shed during high load situations.
  • Error Categorization: Not all errors should trigger retries and use an allowlist for known retryable errors and only retry those. For example, 400 Bad Request (indicating a permanent client error) due to invalid input should not be retried, while server-side or network-related errors with a 500 Internal Server Error (a likely transient issue) can benefit from retrying.
  • Targeting Failing Components Only: In a partial failure, not all parts of the system are down and retries help isolate and recover from the failing components by retrying operations specifically targeting the failed resource. For example, if a service depends on multiple microservices for an operation and one of the service fails, the system should retry the failed request without repeating the entire operation.
  • Intelligent and Adaptive Retries: Design retry logic to take the system’s current state into account, such as checking service health or load conditions before retrying. For example, increase retry intervals if multiple components are detected as failing or retry quickly for timeout errors but back off more for connection errors.. This prevents retries when the system is already known to be overloaded.
  • Retrying at Different Levels: Retries can be implemented at various levels to handle partial failures such as application level, middleware/proxy (load-balancer or API gateway), transport level (network). For example, a distributed system using a load balancer can detect if a specific instance of a service is failing and reroute traffic to a healthy instance that triggers retries only for the requests that target the failing instance.
  • Retry Amplification: In multi-tiered architectures, if retries are implemented at each level of nested service calls, it can lead to increased latency and exponentially higher traffic. To mitigate this, implement retries only at critical points in the call chain, and ensure that each service has a clear retry policy with limits. Use short timeouts to prevent thread starvation when calls to downstream services take too long. If too many threads hang, new traffic will be blocked.
  • Retry Budget: Implementing a global limit on the number of retries across all operations helps prevent system overload. For example, using an algorithm like Leaky Bucket can regulate the number of retries within a specified time period. This ensures that retries are distributed evenly and don’t exceed system capacity, preventing resource exhaustion during high failure rates.
  • Retries with Circuit Breakers: The circuit breaker pattern can be combined with retries to avoid overwhelming a failing component. When a service starts failing, the circuit breaker opens, temporarily halting requests to that service until it is healthy again. Retries can be configured to happen only after the circuit breaker transitions to a half-open state, which allows a limited number of retries to test if the service has recovered.
  • Retries with Failover Mechanisms: Retries can be designed with failover strategies where the system switches to a backup service, region, or replica in case of partial failure. If a service in one region fails then the retries can redirect requests to a different region or zone for ensuring availability.
  • Latency Sensitivity: Services with strict latency requirements might not tolerate long backoff periods or extended retries so they should minimize number of retries and cap backoff times.
  • Sync Calls: For synchronous calls, retry once immediately to handle temporary network issues and avoid multiple retries that could lead to thread starvation. Avoid excessive sleeping of threads between retries, which can lead to thread starvation. Also, a Circuit Breaker can be used to prevent retrying if a high percentage of calls fail.
  • Async Calls: Use exponential backoff with jitter for asynchronous operations and use Circuit Breakers to stop retries when failure rates are high. Asynchronous APIs can queue requests for later retries, but should incorporate health checks to ensure that retry attempts don’t add excessive load to downstream services during recovery periods.
  • Retrying on Overload Responses: Recognize overload indicators (e.g., HTTP 503 responses) and avoid retries when the response indicates overload.
  • Fail-Fast: Detect issues early and fails quickly rather than continuing to process failing requests or operations to avoid wasting time on requests that are unlikely to succeed.
  • Graceful Degradation: Provide an alternative method of handling requests when a service fails. For example, if a primary service is down, a cached result or a simpler backup service can be used instead.
  • Downstream Bugs: Rather than implementing retry-based workarounds, prioritize having downstream service owners address and resolve the underlying issues.
  • Monitor and Analyze Retry Patterns: Implement monitoring for retry attempts and success rates, and analyze the data to gain insights into system behavior during failures. Use these insights to optimize retry strategies, such as adjusting backoff intervals and fine-tuning timeouts for improved system performance.
  • SLAs with Downstream Services: Establish clear service-level agreements (SLAs) with downstream services about call frequency, failure rates, and latency expectations.
  • Availability Over Consistency: Prioritize service availability over consistency where possible, especially during retries or failure handling. In such cases, retries might return stale data or cause inconsistency issues, so it’s crucial to align retry policies with system design.
  • Chaos Engineering: Chaos engineering involves intentionally injecting failures, such as server crashes or network disruptions, into a system to test its resilience under adverse conditions. By simulating real-world failures, teams can identify weaknesses and ensure that the retry policies are working as expected.
  • Bulkhead Pattern: The bulkhead pattern isolates different parts of a system to prevent a failure in one part from affecting the rest of the system. The bulkheads can be implemented by limiting the number of resources (threads, memory, connections) allocated to each service or subsystem so that if one service becomes overloaded or fails, it won’t exhaust resources that other services need.
  • System Design: It’s essential to design APIs to minimize unnecessary communication with the server. For instance, in an event-driven architecture, if an event is missing a required attribute, the application might need to make additional requests to retrieve that data, increasing system load. To avoid this, ensure that events are fully populated with all necessary information upfront.

Summary

Retries are an essential mechanism for building fault-tolerant distributed systems and to recover from transient failures such as network issues, service unavailability, and partial system outages. A well-implemented retry strategy improves system resilience by ensuring that temporary failures don’t lead to full-blown outages. Techniques such as exponential backoff with jitter, idempotency, token buckets to limit retries locally, and circuit breakers help manage retries effectively, preventing issues like retry storms, resource exhaustion, and latency amplification.

However, retries need careful management because without proper limits, retries can overwhelm services that are already struggling or exacerbate issues like cascading failures and thread starvation. Incorporating timeouts, retry limits, and adaptive retry mechanisms based on system health can prevent these negative side effects. By analyzing retry patterns and adopting error-specific handling strategies, distributed systems can strike a balance between availability and resource efficiency, and ensures robust performance even in the face of partial failures.

August 28, 2023

Mitigate Production Risks with Phased Deployment

Filed under: Computing,Microservices — admin @ 6:08 pm

Phased deployment is a software deployment strategy where new software features, changes, or updates are gradually released to a subset of a product’s user base rather than to the entire user community at once. The goal is to limit the impact of any potential negative changes and to catch issues before they affect all users. It’s often a part of modern Agile and DevOps practices, allowing teams to validate software in stages—through testing environments, to specific user segments, and finally, to the entire user base. The phased deployment solves following issues with the production changes:

  1. Risk Mitigation: Deploying changes all at once can be risky, especially for large and complex systems. Phase deployment helps to mitigate this risk by gradually releasing the changes and carefully monitoring their impact.
  2. User Experience: With phased deployment, if something goes wrong, it affects only a subset of users. This protects the larger user base from potential issues and negative experiences.
  3. Performance Bottlenecks: By deploying in phases, you can monitor how the system performs under different loads, helping to identify bottlenecks and scaling issues before they impact all users.
  4. Immediate Feedback: Quick feedback loops with stakeholders and users are established. This immediate feedback helps in quick iterations and refinements.
  5. Resource Utilization: Phased deployment allows for better planning and use of resources. You can allocate just the resources you need for each phase, reducing waste.

The phased deployment applies following approaches for detecting production issues early in the deployment process:

  1. Incremental Validation: As each phase is a limited rollout, you can carefully monitor and validate that the software is working as expected. This enables early detection of issues before they become widespread.
  2. Isolation of Issues: If an issue does arise, its impact is restricted to a smaller subset of the system or user base. This makes it easier to isolate the problem, fix it, and then proceed with the deployment.
  3. Rollbacks: In the event of a problem, it’s often easier to rollback changes for a subset of users than for an entire user base. This allows for quick recovery with minimal impact.
  4. Data-driven Decisions: The metrics and logs gathered during each phase can be invaluable for making informed decisions, reducing the guesswork, and thereby reducing errors.
  5. User Feedback: By deploying to a limited user set first, you can collect user feedback that can be crucial for understanding how the changes are affecting user interaction and performance. This provides another opportunity for catching issues before full-scale deployment.
  6. Best Practices and Automation: Phase deployment often incorporates industry best practices like blue/green deployments, canary releases, and feature flags, all of which help in minimizing errors and ensuring a smooth release.

Building CI/CD Process for Phased Deployment

CI/CD with Phased Deployment

Continuous Integration (CI)

Continuous Integration (CI) is a software engineering practice aimed at regularly merging all developers’ working copies of code to a shared mainline or repository, usually multiple times a day. The objective is to catch integration errors as quickly as possible and ensure that code changes by one developer are compatible with code changes made by other developers in the team. The practice defines following steps for integrating developers’ changes:

  1. Code Commit: Developers write code in their local environment, ensuring it meets all coding guidelines and includes necessary unit tests.
  2. Pull Request / Merge Request: When a developer believes their code is ready to be merged, they create a pull request or merge request. This action usually triggers the CI process.
  3. Automated Build and Test: The CI server automatically picks up the new code changes that may be in a feature branch and initiates a build and runs all configured tests.
  4. Code Review: Developers and possibly other stakeholders review the test and build reports. If errors are found, the code is sent back for modification.
  5. Merge: If everything looks good, the changes are merged into main branch of the repository.
  6. Automated Build: After every commit, automated build processes compile the source code, create executables, and run unit/integration/functional tests.
  7. Automated Testing: This stage automatically runs a suite of tests that can include unit tests, integration tests, test coverage and more.
  8. Reporting: Generate and publish reports detailing the success or failure of the build, lint/FindBugs, static analysis (Fortify), dependency analysis, and tests.
  9. Notification: Developers are notified about the build and test status, usually via email, Slack, or through the CI system’s dashboard.
  10. Artifact Repository: Store the build artifacts that pass all the tests for future use.

Above continuous integration process allows immediate feedback on code changes, reduces integration risk, increases confidence, encourages better collaboration and improves code quality.

Continuous Deployment (CD)

The Continuous Deployment (CD) further enhances this by automating the delivery of applications to selected infrastructure environments. Where CI deals with build, testing, and merging code, CD takes the code from CI and deploys it directly into the production environment, making changes that pass all automated tests immediately available to users. The above workflow for Continuous Integration is added with following additional steps:

  1. Code Committed: Once code passes all tests during the CI phase, it moves onto CD.
  2. Pre-Deployment Staging: Code may be deployed to a staging area where it undergoes additional tests that could be too time-consuming or risky to run during CI. The staging environment can be divided into multiple environments such as alpha staging for integration and sanity testing, beta staging for functional and acceptance testing, and gamma staging environment for chaos, security and performance testing.
  3. Performance Bottlenecks: The staging environment may execute security, chaos, shadow and performance tests to identify bottlenecks and scaling issues before deploying code to the production.
  4. Deployment to Production: If the code passes all checks, it’s automatically deployed to production.
  5. Monitoring & Verification: After deployment, automated systems monitor application health and performance. Some systems use Canary Testing to continuously verify that deployed features are behaving as expected.
  6. Rollback if Necessary: If an issue is detected, the CD system can automatically rollback to a previous, stable version of the application.
  7. Feedback Loop: Metrics and logs from the deployed application can be used to inform future development cycles.

The Continuous Deployment process results in faster time-to-market, reduced risk, greater reliability, improved quality, and better efficiency and resource utilization.

Phased Deployment Workflow

Phased Deployment allows rolling out a change in increments rather than deploying it to all servers or users at once. This strategy fits naturally into a Continuous Integration/Continuous Deployment (CI/CD) pipeline and can significantly reduce the risks associated with releasing new software versions. The CI/CD workflow is enhanced as follows:

  1. Code Commit & CI Process: Developers commit code changes, which trigger the CI pipeline for building and initial testing.
  2. Initial Deployment to Dev Environment: After passing CI, the changes are deployed to a development environment for further testing.
  3. Automated Tests and Manual QA: More comprehensive tests are run. This could also include security, chaos, shadow, load and performance tests.
  4. Phase 1 Deployment (Canary Release): Deploy the changes to a small subset of the production environment or users and monitor closely. If you operate in multiple data centers, cellular architecture or geographical regions, consider initiating your deployment in the area with the fewest users to minimize the impact of potential issues. This approach helps in reducing the “blast radius” of any potential problems that may arise during deployment.
  5. PreProd Testing: In the initial phase, you may optionally first deploy to a special pre-prod environment where you only execute canary testing simulating user requests without actually user-traffic with the production infrastructure so that you can further reduce blast radius for impacting customer experience.
  6. Baking Period: To make informed decisions about the efficacy and reliability of your code changes, it’s crucial to have a ‘baking period’ where the new code is monitored and tested. During this time, you’ll gather essential metrics and data that help in confidently determining whether or not to proceed with broader deployments.
  7. Monitoring and Metrics Collection: Use real-time monitoring tools to track system performance, error rates, and other KPIs.
  8. Review and Approval: If everything looks good, approve the changes for the next phase. If issues are found, roll back and diagnose.
  9. Subsequent Phases: Roll out the changes to larger subsets of the production environment or user base, monitoring closely at each phase. The subsequent phases may use a simple static scheme by adding X servers or user-segments at a time or geometric scheme by exponentially doubling the number of servers or user-segments after each phase. For instance, you can employ mathematical formulas like 2^N or 1.5^N, where N represents the phase number, to calculate the scope of the next deployment phase. This could pertain to the number of servers, geographic regions, or user segments that will be included.
  10. Subsequent Baking Periods: As confidence in the code increases through successful earlier phases, the duration of subsequent ‘baking periods’ can be progressively shortened. This allows for an acceleration of the phased deployment process until the changes are rolled out to all regions or user segments.
  11. Final Rollout: After all phases are successfully completed, deploy the changes to all servers and users.
  12. Continuous Monitoring: Even after full deployment, keep running Canary Tests for validation and monitoring to ensure everything is working as expected.

Thus, phase deployment further mitigates risk, improves user experience, monitoring and resource utilization. If a problem is identified, it’s much easier to roll back changes for a subset of users, reducing negative impact.

Criteria for Selecting Targets for Phased Deployment

When choosing targets for phased deployment, you have multiple options, including cells within a Cellular Architecture, distinct Geographical Regions, individual Servers within a data center, or specific User Segments. Here are some key factors to consider while making your selection:

  1. Risk Assessment: The first step in selecting cells, regions, or user-segments is to conduct a thorough risk assessment. The idea is to understand which areas are most sensitive to changes and which are relatively insulated from potential issues.
  2. User Activity: Regions with lower user activity can be ideal candidates for the initial phases, thereby minimizing the impact if something goes wrong.
  3. Technical Constraints: Factors such as server capacity, load balancing, and network latency may also influence the selection process.
  4. Business Importance: Some user-segments or regions may be more business-critical than others. Starting deployment in less critical areas can serve as a safe first step.
  5. Gradual Scale-up: Mathematical formulas like 2^N or 1.5^N where N is the phase number can be used to gradually increase the size of the deployment target in subsequent phases.
  6. Performance Metrics: Utilize performance metrics like latency, error rates, etc., to decide on next steps after each phase.

Always start with the least risky cells, regions, or user-segments in the initial phases and then use metrics and KPIs to gain confidence in the deployed changes. After gaining confidence from initial phases, you may initiate parallel deployments cross multiple environments, perhaps even in multiple regions simultaneously. However, you should ensure that each environment has its independent monitoring to quickly identify and isolate issues. The rollback strategy should be tested ahead of time to ensure it works as expected before parallel deployment. You should keep detailed logs and documentation for each deployment phase and environment.

Cellular Architecture

Phased deployment can work particularly well with a cellular architecture, offering a systematic approach to gradually release new code changes while ensuring system reliability. In cellular architecture, your system is divided into isolated cells, each capable of operating independently. These cells could represent different services, geographic regions, user segments, or even individual instances of a microservices-based application. For example, you can identify which cells will be the first candidates for deployment, typically those with the least user traffic or those deemed least critical.

The deployment process begins by introducing the new code to an initial cell or a small cluster of cells. This initial rollout serves as a pilot phase, during which key performance indicators such as latency, error rates, and other metrics are closely monitored. If the data gathered during this ‘baking period’ indicates issues, a rollback is triggered. If all goes well, the deployment moves on to the next set of cells. Subsequent phases follow the same procedure, gradually extending the deployment to more cells. Utilizing phased deployment within a cellular architecture helps to minimize the impact area of any potential issues, thus facilitating more effective monitoring, troubleshooting, and ultimately a more reliable software release.

Blue/Green Deployment

The phased deployment can employ the Blue/Green deployment strategy where two separate environments, often referred to as “blue” and “green,” are configured. Both are identical in terms of hardware, software, and settings. The Blue environment runs the current version of the application and serves all user traffic. The Green is a clone of the Blue environment where the new version of the application is deployed. This helps phased deployment because one environment is always live, thus allow for releasing new features without downtime. If issues are detected, traffic can be quickly rerouted back to the Blue environment, thus minimizing the risk and impact of new deployments. The Blue/Green deployment includes following steps:

  1. Preparation: Initially, both Blue and Green environments run the current version of the application.
  2. Initial Rollout: Deploy the new application code or changes to the Green environment.
  3. Verification: Perform tests on the Green environment to make sure the new code changes are stable and performant.
  4. Partial Traffic Routing: In a phased manner, start rerouting a small portion of the live traffic to the Green environment. Monitor key performance indicators like latency, error rates, etc.
  5. Monitoring and Decision: If any issues are detected during this phase, roll back the traffic to the Blue environment without affecting the entire user base. If metrics are healthy, proceed to the next phase.
  6. Progressive Routing: Gradually increase the percentage of user traffic being served by the Green environment, closely monitoring metrics at each stage.
  7. Final Cutover: Once confident that the Green environment is stable, you can reroute 100% of the traffic from the Blue to the Green environment.
  8. Fallback: Keep the Blue environment operational for a period as a rollback option in case any issues are discovered post-switch.
  9. Decommission or Sync: Eventually, decommission the Blue environment or synchronize it to the Green environment’s state for future deployments.

Automated Testing

CI/CD and phased deployment strategy relies on automated testing to validate changes to a subset of infrastructure or users. The automated testing includes a variety of testing types that should be performed at different stages of the process such as:involved:

  • Functional Testing: testing the new feature or change before initiating phased deployment to make sure it performs its intended function correctly.
  • Security Testing: testing for vulnerabilities, threats, or risks in a software application before phased deployment.
  • Performance Testing: testing how the system performs under heavy loads or large amounts of data before and during phased deployment.
  • Canary Testing: involves rolling out the feature to a small, controlled group before making it broadly available. This also includes testing via synthetic transactions by simulating user requests. This is executed early in the phased deployment process, however testing via synthetic transactions is continuously performed in background.
  • Shadow Testing: In this method, the new code runs alongside the existing system, processing real data requests without affecting the actual system.
  • Chaos Testing: This involves intentionally introducing failures to see how the system reacts. It is usually run after other types of testing have been performed successfully, but before full deployment.
  • Load Testing: test the system under the type of loads it will encounter in the real world before the phased deployment.
  • Stress Testing: attempt to break the system by overwhelming its resources. It is executed late in the phased deployment process, but before full deployment.
  • Penetration Testing: security testing where testers try to ‘hack’ into the system.
  • Usability Testing: testing from the user’s perspective to make sure the application is easy to use in early stages of phased deployment.

Monitoring

Monitoring plays a pivotal role in validating the success of phased deployments, enabling teams to ensure that new features and updates are not just functional, but also reliable, secure, and efficient. By constantly collecting and analyzing metrics, monitoring offers real-time feedback that can inform deployment decisions. Here’s how monitoring can help with the validation of phased deployments:

  • Real-Time Metrics and Feedback: collecting real-time metrics on system performance, user engagement, and error rates.
  • Baking Period Analysis: using a “baking” period where the new code is run but closely monitored for any anomalies.
  • Anomaly Detection: using automated monitoring tools to flag anomalies in real-time, such as a spike in error rates or a drop in user engagement.
  • Benchmarking: establishing performance benchmarks based on historical data.
  • Compliance and Security Monitoring: monitoring for unauthorized data access or other security-related incidents.
  • Log Analysis: using aggregated logs to show granular details about system behavior.
  • User Experience Monitoring: tracking metrics related to user interactions, such as page load times or click-through rates.
  • Load Distribution: monitoring how well the new code handles different volumes of load, especially during peak usage times.
  • Rollback Metrics: tracking of the metrics related to rollback procedures.
  • Feedback Loops: using monitoring data for continuous feedback into the development cycle.

Feature Flags

Feature flags, also known as feature toggles, are a powerful tool in the context of phased deployments. They provide developers and operations teams the ability to turn features on or off without requiring a code deployment. This capability synergizes well with phased deployments by offering even finer control over the feature release process. The benefits of feature flags include:

  • Gradual Rollout: Gradually releasing a new feature to a subset of your user base.
  • Targeted Exposure: Enable targeted exposure of features to specific user segments based on different attributes like geography, user role, etc.
  • Real-world Testing: With feature flags, you can perform canary releases, blue/green deployments, and A/B tests in a live environment without affecting the entire user base.
  • Risk Mitigation: If an issue arises during a phased deployment, a feature can be turned off immediately via its feature flag, preventing any further impact.
  • Easy Rollback: Since feature flags allow for features to be toggled on and off, rolling back a feature that turns out to be problematic is straightforward and doesn’t require a new deployment cycle.
  • Simplified Troubleshooting: Feature flags simplify the troubleshooting process since you can easily isolate problems and understand their impact.
  • CICD Compatibility: Feature flags are often used in conjunction with CI/CD pipelines, allowing for features to be integrated into the main codebase even if they are not yet ready for public release.
  • Conditional Logic: Advanced feature flags can include conditional logic, allowing you to automate the criteria under which features are exposed to users.

A/B Testing

A/B testing, also known as split testing, is an experimental approach used to compare two or more versions of a web page, feature, or other variables to determine which one performs better. In the context of software deployment, A/B testing involves rolling out different variations (A, B, etc.) of a feature or application component to different subsets of users. Metrics like user engagement, conversion rates, or performance indicators are then collected to statistically validate which version is more effective or meets the desired goals better. Phased deployment and A/B testing can complement each other in a number of ways:

  • Both approaches aim to reduce risk but do so in different ways.
  • Both methodologies are user-focused but in different respects.
  • A/B tests offer a more structured way to collect user-related metrics, which can be particularly valuable during phased deployments.
  • Feature flags, often used in both A/B testing and phased deployment, give teams the ability to toggle features on or off for specific user segments or phases.
  • If an A/B test shows one version to be far more resource-intensive than another, this information could be invaluable for phased deployment planning.
  • The feedback from A/B testing can feed into the phased deployment process to make real-time adjustments.
  • A/B testing can be included as a step within a phase of a phased deployment, allowing for user experience quality checks.
  • In a more complex scenario, you could perform A/B testing within each phase of a phased deployment.

Safe Rollback

Safe rollback is a critical aspect of a robust CI/CD pipeline, especially when implementing phased deployments. Here’s how safe rollback can be implemented:

  • Maintain versioned releases of your application so that you can easily identify which version to rollback to.
  • Always have backward-compatible database changes so that rolling back the application won’t have compatibility issues with the database.
  • Utilize feature flags so that you can disable problematic features without needing to rollback the entire deployment.
  • Implement comprehensive monitoring and logging to quickly identify issues that might necessitate a rollback.
  • Automate rollback procedures.
  • Keep the old version (Blue) running as you deploy the new version (Green). If something goes wrong, switch the load balancer back to the old version.
  • Use Canaray releases to roll out the new version to a subset of your infrastructure. If errors occur, halt the rollout and revert the canary servers to the old version.

Following steps should be applied on rollback:

  1. Immediate Rollback: As soon as an issue is detected that can’t be quickly fixed, trigger the rollback procedure.
  2. Switch Load Balancer: In a Blue/Green setup, switch the load balancer back to route traffic to the old version.
  3. Database Rollback: If needed and possible, rollback the database changes. Be very cautious with this step, as it can be risky.
  4. Feature Flag Disablement: If the issue is isolated to a particular feature that’s behind a feature flag, consider disabling that feature.
  5. Validation: After rollback, validate that the system is stable. This should include health checks and possibly smoke tests.
  6. Postmortem Analysis: Once the rollback is complete and the system is stable, conduct a thorough analysis to understand what went wrong.

One critical consideration to keep in mind is ensuring both backward and forward compatibility, especially when altering communication protocols or serialization formats. For instance, if you update the serialization format and the new code writes data in this new format, the old code may become incompatible and unable to read the data if a rollback is needed. To mitigate this risk, you can deploy an intermediate version that is capable of reading the new format without actually writing in it.

Here’s how it works:

  1. Phase 1: Release an intermediate version of the code that can read the new serialization format like JSON, but continues to write in the old format. This ensures that even if you have to roll back after advancing further, the “old” version is still able to read the newly-formatted data.
  2. Phase 2: Once the intermediate version is fully deployed and stable, you can then roll out the new code that writes data in the new format.

By following this two-phase approach, you create a safety net, making it possible to rollback to the previous version without encountering issues related to data format incompatibility.

Safe Rollback when changing data format

Sample CI/CD Pipeline

Following is a sample GitHub Actions workflow .yml file that includes elements for build, test and deployment. You can create a new file in your repository under .github/workflows/ called ci-cd.yml:

name: CI/CD Pipeline with Phased Deployment

on:
  push:
    branches:
      - main

env:
  IMAGE_NAME: my-java-app

jobs:
  
  unit-test:
    runs-on: ubuntu-latest
    steps:
      - name: Checkout Code
        uses: actions/checkout@v2

      - name: Run Unit Tests
        run: mvn test

  integration-test:
    needs: unit-test
    runs-on: ubuntu-latest
    steps:
      - name: Run Integration Tests
        run: mvn integration-test

  functional-test:
    needs: integration-test
    runs-on: ubuntu-latest
    steps:
      - name: Run Functional Tests
        run: ./run-functional-tests.sh  # Assuming you have a script for functional tests

  load-test:
    needs: functional-test
    runs-on: ubuntu-latest
    steps:
      - name: Run Load Tests
        run: ./run-load-tests.sh  # Assuming you have a script for load tests

  security-test:
    needs: load-test
    runs-on: ubuntu-latest
    steps:
      - name: Run Security Tests
        run: ./run-security-tests.sh  # Assuming you have a script for security tests

  build:
    needs: security-test
    runs-on: ubuntu-latest
    steps:
      - name: Build and Package
        run: |
          mvn clean package
          docker build -t ${{ env.IMAGE_NAME }} .

  phase_one:
    needs: build
    runs-on: ubuntu-latest
    steps:
      - name: Deploy to Phase One Cells
        run: ./deploy-to-phase-one.sh # Your custom deploy script for Phase One

      - name: Canary Testing
        run: ./canary-test-phase-one.sh # Your custom canary testing script for Phase One

      - name: Monitoring
        run: ./monitor-phase-one.sh # Your custom monitoring script for Phase One

      - name: Rollback if Needed
        run: ./rollback-phase-one.sh # Your custom rollback script for Phase One
        if: failure()

  phase_two:
    needs: phase_one
    # Repeat the same steps as phase_one but for phase_two
    # ...

  phase_three:
    needs: phase_two
    # Repeat the same steps as previous phases but for phase_three
    # ...

  phase_four:
    needs: phase_three
    # Repeat the same steps as previous phases but for phase_four
    # ...

  phase_five:
    needs: phase_four
    # Repeat the same steps as previous phases but for phase_five
    # ...

run-functional-tests.sh, run-load-tests.sh, and run-security-tests.sh would contain the logic for running functional, load, and security tests, respectively. You might use tools like Selenium for functional tests, JMeter for load tests, and OWASP ZAP for security tests.

Conclusion

Phased deployment, when coupled with effective monitoring, testing, and feature flags, offers numerous benefits that enhance the reliability, security, and overall quality of software releases. Here’s a summary of the advantages:

  1. Reduced Risk: By deploying changes in smaller increments, you minimize the impact of any single failure, thereby reducing the “blast radius” of issues.
  2. Real-Time Validation: Continuous monitoring provides instant feedback on system performance, enabling immediate detection and resolution of issues.
  3. Enhanced User Experience: Phased deployment allows for real-time user experience monitoring, ensuring that new features or changes meet user expectations and don’t negatively impact engagement.
  4. Data-Driven Decision Making: Metrics collected during the “baking” period and subsequent phases allow for data-driven decisions on whether to proceed with the deployment, roll back, or make adjustments.
  5. Security & Compliance: Monitoring for compliance and security ensures that new code doesn’t introduce vulnerabilities, keeping the system secure throughout the deployment process.
  6. Efficient Resource Utilization: The gradual rollout allows teams to assess how the new changes affect system resources, enabling better capacity planning and resource allocation.
  7. Flexible Rollbacks: In the event of a failure, the phased approach makes it easier to roll back changes, minimizing disruption and maintaining system stability.
  8. Iterative Improvement: Metrics and feedback collected can be looped back into the development cycle for ongoing improvements, making future deployments more efficient and reliable.
  9. Optimized Testing: Various forms of testing like functional, security, performance, and canary can be better focused and validated against real-world scenarios in each phase.
  10. Strategic Rollout: Feature flags allow for even more granular control over who sees what changes, enabling targeted deployments and A/B testing.
  11. Enhanced Troubleshooting: With fewer changes deployed at a time, identifying the root cause of any issues becomes simpler, making for faster resolution.
  12. Streamlined Deployment Pipeline: Incorporating phased deployment into CI/CD practices ensures a smoother, more controlled transition from development to production.

By strategically implementing these approaches, phased deployment enhances the resilience and adaptability of the software development lifecycle, ensuring a more robust, secure, and user-friendly product.

August 23, 2023

Failures in MicroService Architecture

Filed under: Computing,Microservices — admin @ 12:54 pm

Microservice architecture is an evolution of Monolithic and Service-Oriented Architecture (SOA), where an application is built as a collection of loosely coupled, independently deployable services. Each microservice usually corresponds to a specific business functionality and can be developed, deployed, and scaled independently. In contrast to Monolithic Architecture that lacks modularity, and Service-Oriented Architecture (SOA), which is more coarse-grained and is prone to a single point of failure, the Microservice architecture offers better support for modularity, independent deployment and distributed development that often uses Conway’s law to organize teams based on the Microservice architecture. However, Microservice architecture introduces several challenges in terms of:

  • Network Complexity: Microservices communicate over the network, increasing the likelihood of network-related issues (See Fallacies of distributed computing).
  • Distributed System Challenges: Managing a distributed system introduces complexities in terms of synchronization, data consistency, and handling partial failures.
  • Monitoring and Troubleshooting: Due to the distributed nature, monitoring and troubleshooting can become more complex, requiring specialized tools and practices.
  • Potential for Cascading Failures: Failure in one service can lead to failures in dependent services if not handled properly.
Microservices Challenges

Faults, Errors and Failures

The challenges associated with microservice architecture manifest at different stages require understanding concepts of faults, errors and failures:

1. Faults:

Faults in a microservice architecture could originate from various sources, including:

  • Software Bugs: A defect in one service may cause incorrect behavior but remain dormant until triggered.
  • Network Issues: Problems in network connectivity can be considered faults, waiting to lead to errors.
  • Configuration Mistakes: Incorrect configuration of a service is another potential fault.
  • Dependency Vulnerabilities: A weakness or vulnerability in an underlying library or service that hasn’t yet caused a problem.

Following are major concerns that the Microservice architecture must address for managing faults:

  • Loose Coupling and Independence: With services being independent, a fault in one may not necessarily impact others, provided the system is designed with proper isolation.
  • Complexity: Managing and predicting faults across multiple services and their interactions can be complex.
  • Isolation: Properly isolating faults can prevent them from causing widespread problems. For example, a fault in one service shouldn’t impact others if isolation is well implemented.
  • Detecting and Managing Faults: Given the distributed nature of microservices, detecting and managing faults can be complex.

2. Error:

When a fault gets activated under certain conditions, it leads to an error. In microservices, errors can manifest as:

  • Communication Errors: Failure in service-to-service communication due to network problems or incompatible data formats.
  • Data Inconsistency: An error in one service leading to inconsistent data across different parts of the system.
  • Service Unavailability: A service failing to respond due to an internal error.

Microservice architecture should include diagnosing and handling errors including:

  • Propagation: Errors can propagate quickly across services, leading to cascading failures if not handled properly.
  • Transient Errors: Network-related or temporary errors might be resolved by retries, adding complexity to error handling.
  • Monitoring and Logging Challenges: Understanding and diagnosing errors in a distributed system can be more complex.

3. Failure:

Failure is the inability of a system to perform its required function due to unhandled errors. In microservices, this might include:

  • Partial Failure: Failure of one or more services leading to degradation in functionality.
  • Total System Failure: Cascading errors causing the entire system to become unavailable.

Further, failure handling in Microservice architecture poses additional challenges such as:

  • Cascading Failures: A failure in one service might lead to failures in others, particularly if dependencies are tightly interwoven and error handling is insufficient.
  • Complexity in Recovery: Coordinating recovery across multiple services can be challenging.

The faults and errors can be further categorized into customer related and system related:

  • Customer-Related: These may include improper usage of an API, incorrect input data, or any other incorrect action taken by the client. These might include incorrect input data, calling an endpoint that doesn’t exist, or attempting an action without proper authorization. Since these errors are often due to incorrect usage, simply retrying the same request without fixing the underlying issue is unlikely to resolve the error. For example, if a customer sends an invalid parameter, retrying the request with the same invalid parameter will produce the same error. In many cases, customer errors are returned with specific HTTP status codes in the 4xx range (e.g., 400 Bad Request, 403 Forbidden), indicating that the client must modify the request before retrying.
  • System-Related: These can stem from various aspects of the microservices, such as coding bugs, network misconfigurations, a timeout occurring, or issues with underlying hardware. These errors are typically not the fault of the client and may be transient, meaning they could resolve themselves over time or upon retrying. System errors often correlate with HTTP status codes in the 5xx range (e.g., 500 Internal Server Error, 503 Service Unavailable), indicating an issue on the server side. In many cases, these requests can be retried after a short delay, possibly succeeding if the underlying issue was temporary.

Causes Related to Faults, Errors and Failures

The challenges in microservice architecture are rooted in its distributed nature, complexity, and interdependence of services. Here are common causes of the challenges related to faults, errors, and failures, including the distinction between customer and system errors:

1. Network Complexity:

  • Cause: Multiple services communicating over the network where one of the service cannot communicate with other service. For example, Amazon Simple Storage Service (S3) had an outage in Feb 28, 2017 and many services that were tightly coupled failed as well due to limited fault isolation. The post-mortem analysis recommended proper fault isolation, redundancy across regions, and better understanding and managing complex inter-service dependencies.
  • Challenges: Leads to network-related issues, such as latency, bandwidth limitations, and network partitioning, causing both system errors and potentially triggering faults.

2. Data Consistency:

  • Cause: Maintaining data consistency across services that use different databases. This can occur where a microservice stores data in multiple data stores without proper anti-entropy validation or uses eventual consistency, e.g. a trading firm might be using CQRS pattern where transaction events are persisted in a write datastore, which is then replicated to a query datastore so user may not see up-to-date data when querying recently stored data.
  • Challenges: Ensuring transactional integrity and eventual consistency can be complex, leading to system errors if not managed properly.

3. Service Dependencies:

  • Cause: Tight coupling between services. For example, an online travel booking platform might deploy multiple microservices for managing hotel bookings, flight reservations, car rentals, etc. If these services are tightly coupled, then a minor update to the flight reservation service unintentionally may break the compatibility with the hotel booking service. 
  • Challenges: Cascading failures and difficulty in isolating faults. A failure in one service can easily propagate to others if not properly isolated.

4. Scalability Issues:

  • Cause: Individual services may require different scaling strategies. For example, Netflix in Oct 29, 2012 suffered a major outage when due to a scaling issue, the Amazon Elastic Load Balancer (ELB) that was used for routing couldn’t route requests effectively. The lessons learned from the incident included improved scaling strategies, redundancy and failover planning, and monitoring and alerting enhancements.
  • Challenges: Implementing effective scaling without affecting other services or overall system stability. Mismanagement can lead to system errors or even failures.

5. Security Concerns:

  • Cause: Protecting the integrity and confidentiality of data as it moves between services. For example, on July 19, 2019, CapitalOne had a major security breach for its data that was stored on AWS. A former AWS employee discovered a misconfigured firewall and exploited it, accessing sensitive customer data. The incident caused significant reputational damage and legal consequences to CapitalOne, which then worked on a broader review of security practices, emphasizing the need for proper configuration, monitoring, and adherence to best practices.
  • Challenges: Security breaches or misconfigurations could be seen as faults, leading to potential system errors or failures.

6. Monitoring and Logging:

  • Cause: The need for proper monitoring and logging across various independent services to gain insights when microservices are misbehaving. For example, if a service is silently behaving erratically, causing intermittent failures for customers will lead to more significant outage and longer time to diagnose and resolve due to lack of proper monitoring and logging.
  • Challenges: Difficulty in tracking and diagnosing both system and customer errors across different services.

7. Configuration Management:

  • Cause: Managing configuration across multiple services. For example, July 20, 2021, WizCase discovered unsecured Amazon S3 buckets containing data from more than 80 US locales, predominantly in New England. The misconfigured S3 buckets included more than 1,000GB of data and more than 1.6 million files. Residents’ actual addresses, telephone numbers, IDs, and tax papers were all exposed due to the attack. On October 5, 2021, Facebook had nearly six hours due to misconfigured DNS and PGP settings. Oasis cites misconfiguration as a top root cause for security incidents and events.
  • Challenges: Mistakes in configuration management can be considered as faults, leading to errors and potentially failures in one or more services.

8. API Misuse (Customer Errors):

  • Cause: Clients using the API incorrectly, sending improper requests. For example, on October 21, 2016, Dyn experienced a massive Distributed Denial of Service (DDoS) attack, rendering a significant portion of the internet inaccessible for several hours. High-profile sites, including Twitter, Reddit, and Netflix, experienced outages. The DDoS attack was primarily driven by the Mirai botnet, which consisted of a large number of compromised Internet of Things (IoT) devices like security cameras, DVRs, and routers. These devices were vulnerable because of default or easily guessable passwords. The attackers took advantage of these compromised devices and used them to send massive amounts of traffic to Dyn’s servers, especially by abusing the devices’ APIs to make repeated and aggressive requests. The lessons learned included better IoT security, strengthening infrastructure and adding API guardrails such as built-in security and rate-limiting.
  • Challenges: Handling these errors gracefully to guide clients in correcting their requests.

9. Service Versioning:

  • Cause: Multiple versions of services running simultaneously. For example, conflicts between the old and new versions may lead to unexpected behavior in the system. Requests routed to the new version might be handled differently than those routed to the old version, causing inconsistencies.
  • Challenges: Compatibility issues between different versions can lead to system errors.

10. Diverse Technology Stack:

  • Cause: Different services might use different languages, frameworks, or technologies. For example, the diverse technology stack may cause problems with inconsistent monitoring and logging, different vulnerability profiles and security patching requirement, leading to increased complexity in managing, monitoring, and securing the entire system.
  • Challenges: Increases complexity in maintaining, scaling, and securing the system, which can lead to faults.

11. Human Factors:

  • Cause: Errors in development, testing, deployment, or operations. For example, Amazon Simple Storage Service (S3) had an outage in Feb 28, 2017, which was caused by a human error during the execution of an operational command. A typo in a command executed by an Amazon team member intended to take a small number of servers offline inadvertently removed more servers than intended.and many services that were tightly coupled failed as well due to limited fault isolation. The post-mortem analysis recommended implementing safeguards against both human errors and system failures.
  • Challenges: Human mistakes can introduce faults, lead to both customer and system errors, and even cause failures if not managed properly.

12. Lack of Adequate Testing:

  • Cause: Insufficient unit, integration, functional, and canary testing. For example, on August 1, 2012, Knight Capital deployed untested software to a production environment, resulting in a malfunction in their automated trading system. The flawed system started buying and selling millions of shares at incorrect prices. Within 45 minutes, the company incurred a loss of $440 million. The code that was deployed to production was not properly tested. It contained old, unused code that should have been removed, and the new code’s interaction with existing systems was not fully understood or verified. The lessons learned included ensuring that all code, especially that which controls critical functions, is thoroughly tested, implementing robust and consistent deployment procedures to ensure that changes are rolled out uniformly across all relevant systems, and having mechanisms in place to quickly detect and halt erroneous behavior, such as a “kill switch” for automated trading systems.
  • Challenges: Leads to undetected faults, resulting in both system and customer errors, and potentially, failures in production.

13. Inadequate Alarms and Health Checks:

  • Cause: Lack of proper monitoring and health check mechanisms. For example, on January 31, 2017, GitLab suffered a severe data loss incident. An engineer accidentally deleted a production database while attempting to address some performance issues. This action resulted in a loss of 300GB of user data. GitLab’s monitoring and alerting system did not properly notify the team of the underlying issues that were affecting database performance. The lack of clear alarms and health checks contributed to the confusion and missteps that led to the incident. The lessons learned included ensuring that health checks and alarms are configured to detect and alert on all critical conditions, and establishing and enforcing clear procedures and protocols for handling critical production systems, including guidelines for dealing with performance issues and other emergencies.
  • Challenges: Delays in identifying and responding to faults and errors, which can exacerbate failures.

14. Lack of Code Review and Quality Control:

  • Cause: Insufficient scrutiny during the development process. For example, on March 14, 2012, the Heartbleed bug was introduced with the release of OpenSSL version 1.0.1 but it was not discovered until April 2014. The bug allowed attackers to read sensitive data from the memory of millions of web servers, potentially exposing passwords, private keys, and other sensitive information. The bug was introduced through a single coding error. There was a lack of rigorous code review process in place to catch such a critical mistake. The lessons learned included implementing a thorough code review process, establishing robust testing and quality control measures to ensure that all code, especially changes to security-critical areas, is rigorously verified.
  • Challenges: Increases the likelihood of introducing faults and bugs into the system, leading to potential errors and failures.

15. Lack of Proper Test Environment:

  • Cause: Absence of a representative testing environment. For example, on August 1, 2012, Knight Capital deployed new software to a production server that contained obsolete and nonfunctional code. This code accidentally got activated, leading to unintended trades flooding the market. The algorithm was buying high and selling low, the exact opposite of a profitable strategy. The company did not have a proper testing environment that accurately reflected the production environment. Therefore, the erroneous code was not caught during the testing phase. The lessons learned included ensuring a robust and realistic testing environment that accurately mimics the production system, implementing strict and well-documented deployment procedures and implementing real-time monitoring and alerting to catch unusual or erroneous system behavior.
  • Challenges: Can lead to unexpected behavior in production due to discrepancies between test and production environments.

16. Elevated Permissions:

  • Cause: Overly permissive access controls. For example, on July 19, 2019, CapitalOne announced that an unauthorized individual had accessed the personal information of approximately 106 million customers and applicants. The breach occurred when a former employee of a third-party contractor exploited a misconfigured firewall, gaining access to data stored on Amazon’s cloud computing platform, AWS. The lessons learned included implementing the principle of least privilege, robust monitoring to detect and alert on suspicious activities quickly, and evaluating the security practices of third-party contractors and vendors.
  • Challenges: Increased risk of security breaches and unauthorized actions, potentially leading to system errors and failures.

17. Single Point of Failure:

  • Cause: Reliance on a single component without redundancy. For example, on January 31, 2017, GitLab experienced a severe data loss incident when an engineer while attempting to remove a secondary database, the primary production database was engineer deleted. The primary production database was a single point of failure in the system. The deletion of this database instantly brought down the entire service. Approximately 300GB of data was permanently lost, including issues, merge requests, user accounts, comments, and more. The lessons learned included eliminating single points of failure, implementing safeguards to protect human error, and testing backups.
  • Challenges: A failure in one part can bring down the entire system, leading to cascading failures.

18. Large Blast Radius:

  • Cause: Lack of proper containment and isolation strategies. For example, on September 4, 2018, the Azure South Central U.S. datacenter experienced a significant outage affecting multiple regions. A severe weather event in the southern United States led to cooling failures in one of Azure’s data centers. Automated systems responded to the cooling failure by shifting loads to a data center in a neighboring region. This transfer was larger and faster than anticipated, leading to an overload in the secondary region. The lessons learned included deep understanding of dependencies and failure modes, limiting the blast radius, and continuous improvements in resilience.
  • Challenges: An error in one part can affect a disproportionate part of the system, magnifying the impact of failures.

19. Throttling and Limits Issues:

  • Cause: Inadequate management of request rates and quotas. For example, on February 28, 2017, AWS S3 experienced a significant disruption in the US-EAST-1 region, causing widespread effects on many dependent systems. A command to take a small number of servers offline for inspection was executed incorrectly, leading to a much larger removal of capacity than intended. Once the servers were inadvertently removed, the S3 subsystems had to be restarted. The restart process included safety checks, which required specific metadata. However, the capacity removal caused these metadata requests to be throttled. Many other systems were dependent on the throttled subsystem, and as the throttling persisted, it led to a cascading failure. The lessons learned included safeguards against human errors, dependency analysis, and testing throttling mechanisms.
  • Challenges: Can lead to service degradation or failure under heavy load.

20. Rushed Releases:

  • Cause: Releasing changes without proper testing or review. For example, on January 31, 2017, GitLab experienced a severe data loss incident. A series of events that started with a rushed release led to an engineer accidentally deleting a production database, resulting in the loss of 300GB of user data. The team was working on addressing performance issues and pushed a release without properly assessing the risks and potential side effects. The team was working on addressing performance issues and pushed a release without properly assessing the risks and potential side effects. The lessons learned included avoiding rushed decisions, clear separation of environments, proper access controls, and robust backup strategy.
  • Challenges: Increases the likelihood of introducing faults and errors into the system.

21. Excessive Logging:

  • Cause: Logging more information than necessary. For example, excessive logs can result in disk space exhaustion, performance degradation, service disruption or high operating cost due to additional network bandwidth and storage costs.
  • Challenges: Can lead to performance degradation and difficulty in identifying relevant information.

22. Circuit Breaker Mismanagement:

  • Cause: Incorrect implementation or tuning of circuit breakers. For example, on November 18, 2014, Microsoft Azure suffered a substantial global outage affecting multiple services. An update to Azure’s Storage Service included a change to the configuration file governing the circuit breaker settings. The flawed update led to an overly aggressive tripping of circuit breakers, which, in turn, led to a loss of access to the blob front-ends. The lessons learned incremental rollouts, thorough testing of configuration changes, clear understanding of component interdependencies.
  • Challenges: Potential system errors or failure to protect the system during abnormal conditions.

23. Retry Mechanism:

  • Cause: Mismanagement of retry logic. For example, on September 20, 2015, an outage in DynamoDB led to widespread disruption across various AWS services. The root cause was traced back to issues related to the retry mechanism. A small error in the system led to a slight increase in latency. Due to an aggressive retry mechanism, the slightly increased latency led to a thundering herd problem where many clients retried their requests almost simultaneously. The absence of jitter (randomization) in the retry delays exacerbated this surge of requests because retries from different clients were synchronized. The lessons learned included proper retry logic with jitter, understanding dependencies, and enhancements to monitoring and alerting.
  • Challenges: Can exacerbate network congestion and failure conditions, particularly without proper jitter implementation.

24. Backward Incompatible Changes:

  • Cause: Introducing changes that are not backward compatible. For example, on August 1, 2012, Knight Capital deployed new software to a production environment. This software was intended to replace old, unused code but was instead activated, triggering old, defective functionality. The new software was not compatible with the existing system, and instead of being deactivated, the old code paths were unintentionally activated. The incorrect software operation caused Knight Capital to loss of over $460 million in just 45 minutes. The lessons learned included proper testing, processes for deprecating old code, and robust monitoring and rapid response mechanism.
  • Challenges: Can break existing clients and other services, leading to system errors.

25. Inadequate Capacity Planning:

  • Cause: Failure to plan for growth or spikes in usage. For example, on October 21, 2018, GitHub experienced a major outage that lasted for over 24 hours. During this period, various services within GitHub were unavailable or severely degraded. The incident was caused by inadequate capacity planning as GitHub’s database was operating close to its capacity. A routine maintenance task to replace a failing 100G network link set off a series of events that caused the database to failover to a secondary. This secondary didn’t have enough capacity to handle the production load, leading to cascading failures. The lessons learned included capacity planning, regular review of automated systems and building redundancy in critical components.
  • Challenges: Can lead to system degradation or failure under increased load.

26. Lack of Failover Isolation:

  • Cause: Insufficient isolation between primary and failover mechanisms. For example, on September 4, 2018, the Azure South Central U.S. datacenter experienced a significant outage. The Incident was caused by a lightning, which resulted in a voltage swell that impacted the cooling systems, causing them to shut down. Many services that were only hosted in this particular region went down completely, showing a lack of failover isolation between regions. The lessons learned included redundancy in critical systems, cross-region failover strategies, and regular testing of failover procedures.
  • Challenges: Can lead to cascading failures if both primary and failover systems are affected simultaneously.

27. Noise in Metrics and Alarms:

  • Cause: Too many irrelevant or overly sensitive alarms and metrics. Over time, the number of metrics and alarms may grow to a point where there are thousands of alerts firing every day, many of them false positives or insignificant. The noise level in the alerting system becomes overwhelming. For example, if many alarms are set with thresholds too close to regular operating parameters, they may cause frequent false positives. The operations team became desensitized to alerts, treating them as “normal.” The lessons learned include focusing on the most meaningful metrics and alerts, and regular review and adjust alarm thresholds and relevance to ensure they remain meaningful.
  • Challenges: Can lead to alert fatigue and hinder the prompt detection and response to real issues, increasing the risk of system errors and failures going unaddressed.

28. Variations Across Environments:

  • Cause: Differences between development, staging, and production environments. For example, a development team might be using development, testing, staging, and production environments, allowing them to safely develop, test, and deploy their services. However, production environment might be using different versions of database or middleware, using different network topology or production data is different, causing unexpected behaviors that leads to a significant outage.
  • Challenges: May lead to unexpected behavior and system errors, as code behaves differently in production compared to the test environment.

29. Inadequate Training or Documentation:

  • Cause: Lack of proper training, guidelines, or documentation for developers and operations teams. For example, if the internal team is not properly trained on the complexities of the microservices architecture, it can lead to misunderstandings of how services interact. Without proper training or documentation, the team may take a significant amount of time to identify the root causes of the issues.
  • Challenges: Can lead to human-induced faults, misconfiguration, and inadequate response to incidents, resulting in errors and failures.

30. Self-Inflicted Traffic Surge:

  • Cause: Uncontrolled or unexpected increase in internal traffic, such as excessive inter-service calls. For example, on January 31st 2017, GitLab experienced an incident that, while primarily related to data deletion, also demonstrated a form of self-inflicted traffic surge. While attempting to restore from a backup, a misconfiguration in the application caused a rapid increase in requests to the database. The lessons learned included testing configurations in an environment that mimics production, robust alerting and monitoring, clear understanding of interactions between components.
  • Challenges: Can overload services, causing system errors, degradation, or even failure.

31. Lack of Phased Deployment:

  • Cause: Releasing changes to all instances simultaneously without gradual rollout. For example, on August 1, 2012, Knight Capital deployed new software to a production environment. The software was untested in this particular environment, and an old, incompatible module was accidentally activated. The software was deployed to all servers simultaneously instead of gradually rolling it out to observe potential issues. The incorrect software operation caused Knight Capital to accumulate a massive unintended position in the market, resulting in a loss of over $440 million and a significant impact to its reputation. The lessons learned included phased deployment, thorough testing and understanding dependencies.
  • Challenges: Increases the risk of widespread system errors or failures if a newly introduced fault is triggered.

32. Broken Rollback Mechanisms:

  • Cause: Inability to revert to a previous stable state due to faulty rollback procedures. For example, a microservice tries to deploy a new version but after the deployment, issues are detected, and the decision is made to rollback. However, the rollback process fails, exacerbating the problem and leading to an extended outage.
  • Challenges: Can exacerbate system errors or failures during an incident, as recovery options are limited.

33. Inappropriate Timing:

  • Cause: Deploying new changes during critical periods such as Black Friday. For example, on Black Friday in 2014, Best Buy’s website experienced multiple outages throughout the day, which was caused by some maintenance or deployment actions that coincided with the traffic surge. Best Buy took the site down intermittently to address the issues, which, while necessary, only exacerbated the outage durations for customers. The lessons learned included avoiding deployments on critical days, better capacity planning and employing rollback strategies.
  • Challenges: Deploying significant changes or conducting maintenance during high-traffic or critical periods can lead to catastrophic failures.

The myriad potential challenges in microservice architecture reflect the complexity and diversity of factors that must be considered in design, development, deployment, and operation. By recognizing and addressing these causes proactively through robust practices, thorough testing, careful planning, and vigilant monitoring, teams can greatly enhance the resilience, reliability, and robustness of their microservice-based systems.

Incident Metrics

In order to prevent common causes of service faults and errors, Microservice environment can track following metrics:

1. MTBF (Mean Time Between Failures):

  • Prevent: By analyzing MTBF, you can identify patterns in system failures and proactively address underlying issues to enhance stability.
  • Detect: Monitoring changes in MTBF may help in early detection of emerging problems or degradation in system health.
  • Resolve: Understanding MTBF can guide investments in redundancy and failover mechanisms to ensure continuous service even when individual components fail.

2. MTTR (Mean Time to Repair):

  • Prevent: Reducing MTTR often involves improving procedures and tools for diagnosing and fixing issues, which also aids in preventing failures by addressing underlying faults more efficiently.
  • Detect: A sudden increase in MTTR can signal that something has changed within the system, such as a new fault that’s harder to diagnose, triggering a deeper investigation.
  • Resolve: Lowering MTTR directly improves recovery by minimizing the time it takes to restore service after a failure. This can be done through automation, streamlined procedures, and robust rollback strategies.

3. MTTA (Mean Time to Acknowledge):

  • Prevent: While MTTA mainly focuses on response times, reducing it can foster a more responsive monitoring environment, helping to catch issues before they escalate.
  • Detect: A robust monitoring system that allows for quick acknowledgment can speed up the detection of failures or potential failures.
  • Resolve: Faster acknowledgment of issues means quicker initiation of resolution processes, which can help in restoring the service promptly.

4. MTTF (Mean Time to Failure):

  • Prevent: MTTF provides insights into the expected lifetime of a system or component. Regular maintenance, monitoring, and replacement aligned with MTTF predictions can prevent unexpected failures.
  • Detect: Changes in MTTF patterns can provide early warnings of potential failure, allowing for pre-emptive action.
  • Resolve: While MTTF doesn’t directly correlate with resolution, understanding it helps in planning failover strategies and ensuring that backups or redundancies are in place for anticipated failures.

Implementing These Metrics:

Utilizing these metrics in a microservices environment requires:

  • Comprehensive Monitoring: Continual monitoring of each microservice to gather data.
  • Alerting and Automation: Implementing automated alerts and actions based on these metrics to ensure immediate response.
  • Regular Review and Analysis: Periodic analysis to derive insights and make necessary adjustments to both the system and the process.
  • Integration with Incident Management: Linking these metrics with incident management to streamline detection and resolution.

By monitoring these metrics and integrating them into the daily operations, incident management, and continuous improvement processes, organizations can build more robust microservice architectures capable of preventing, detecting, and resolving failures efficiently.

Development Procedures

A well-defined process is essential for managing the complexities of microservices architecture, especially when it comes to preventing, detecting, and resolving failures. This process typically covers various stages, from setting up monitoring and alerts to handling incidents, troubleshooting, escalation, recovery, communication, and continuous improvement. Here’s how such a process can be designed, including specific steps to follow when an alarm is received about the health of a service:

1. Preventing Failures:

  • Standardizing Development Practices: Creating coding standards, using automated testing, enforcing security guidelines, etc.
  • Implementing Monitoring and Alerting: Setting up monitoring for key performance indicators and establishing alert thresholds.
  • Regular Maintenance and Health Checks: Scheduling periodic maintenance, updates, and health checks to ensure smooth operation.
  • Operational Checklists: Maintaining a checklist for operational readiness such as:
    • Review requirements, API specifications, test plans and rollback plans.
    • Review logging, monitoring, alarms, throttling, feature flags, and other key configurations.
    • Document and understand components of a microservice and its dependencies.
    • Define key operational and business metrics for the microservice and setup a dashboard to monitor health metrics.
    • Review authentication, authorization and security impact for the service.
    • Review data privacy, archival and retention policies.
    • Define failure scenarios and impact to other services and customers.
    • Document capacity planning for scalability, redundancy to eliminate single point of failures and failover strategies.

2. Detecting Failures:

  • Real-time Monitoring: Constantly watching system metrics to detect anomalies.
  • Automated Alerting: Implementing automated alerts that notify relevant teams when an anomaly or failure is detected.

3. Responding to Alarms and Troubleshooting:

When an alarm is received:

  • Acknowledge the Alert: Confirm the reception of the alert and log the incident.
  • Initial Diagnosis: Quickly assess the scope, impact, and potential cause of the issue.
  • Troubleshooting: Follow a systematic approach to narrow down the root cause, using tools, logs, and predefined troubleshooting guides.
  • Escalation (if needed): If the issue cannot be resolved promptly, escalate to higher-level teams or experts, providing all necessary information.

4. Recovery and Mitigation:

  • Implement Immediate Mitigation: Apply temporary fixes to minimize customer impact.
  • Recovery Actions: Execute recovery plans, which might include restarting services, reallocating resources, etc.
  • Rollback (if needed): If a recent change caused the failure, initiate a rollback to a stable version, following predefined rollback procedures.

5. Communication:

  • Internal Communication: Keep all relevant internal stakeholders informed about the status, actions taken, and expected resolution time.
  • Communication with Customers: If the incident affects customers, communicate transparently about the issue, expected resolution time, and any necessary actions they need to take.

6. Post-Incident Activities:

  • Post-mortem Analysis: Conduct a detailed analysis of the incident, identify lessons learned, and update procedures as needed.
  • Continuous Improvement: Regularly review and update the process, including the alarm response and troubleshooting guides, based on new insights and changes in the system.

A well-defined process for microservices not only provides clear guidelines on development and preventive measures but also includes detailed steps for responding to alarms, troubleshooting, escalation, recovery, and communication. Such a process ensures that the team is prepared and aligned when issues arise, enabling rapid response, minimizing customer impact, and fostering continuous learning and improvement.

Post-Mortem Analysis

When a failure or an incident occurs in a microservice, the development team will need to follow a post-mortem process for analyzing and evaluating an incident or failure. Here’s how post-mortems help enhance fault tolerance:

1. Understanding Root Causes:

A post-mortem helps identify the root cause of a failure, not just the superficial symptoms. By using techniques like the “5 Whys,” teams can delve deep into the underlying issues that led to the fault, such as coding errors, network latency, or configuration mishaps.

2. Assessing Impact and Contributing Factors:

Post-mortems enable the evaluation of the full scope of the incident, including customer impact, affected components, and contributing factors like environmental variations. This comprehensive view allows for targeted improvements.

3. Learning from Failures:

By documenting what went wrong and what went right during an incident, post-mortems facilitate organizational learning. This includes understanding the sequence of events, team response effectiveness, tools and processes used, and overall system resilience.

4. Developing Actionable Insights:

Post-mortems result in specific, actionable recommendations to enhance system reliability and fault tolerance. This could involve code refactoring, infrastructure upgrades, or adjustments to monitoring and alerting.

5. Improving Monitoring and Alerting:

Insights from post-mortems can be used to fine-tune monitoring and alerting systems, making them more responsive to specific failure patterns. This enhances early detection and allows quicker response to potential faults.

6. Fostering a Culture of Continuous Improvement:

Post-mortems encourage a blame-free culture focused on continuous improvement. By treating failures as opportunities for growth, teams become more collaborative and proactive in enhancing system resilience.

7. Enhancing Documentation and Knowledge Sharing:

The documentation produced through post-mortems is a valuable resource for the entire organization. It can be referred to when similar incidents occur, or during the onboarding of new team members, fostering a shared understanding of system behavior and best practices.

Conclusion

The complexity and interdependent nature of microservice architecture introduce specific challenges in terms of management, communication, security, and fault handling. By adopting robust measures for prevention, detection, and recovery, along with adhering to development best practices and learning from post-mortems, organizations can significantly enhance the fault tolerance and resilience of their microservices. A well-defined, comprehensive approach that integrates all these aspects ensures a more robust, flexible, and responsive system, capable of adapting and growing with evolving demands.

Powered by WordPress