The Promise and the Problem
I’ve been writing software for over 30 years. In the 1990s, I built client-server applications with Visual Basic or X/Motif frontends talking to SQL databases. The entire stack fit in my head. When something broke, I could trace the problem in minutes. Today, a simple API request traverses so many layers of abstraction that debugging feels like archaeological excavation through geological strata of technology.
Here’s what a typical request looks like now:
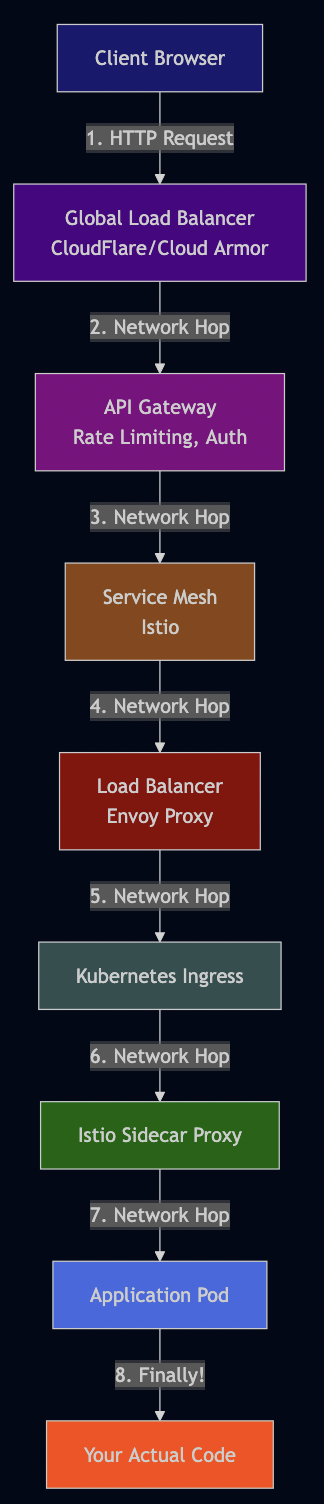
Each layer promises to solve a problem. Each layer delivers on that promise. And yet, the cumulative effect is a system so complex that even experienced engineers struggle to reason about it. I understand that abstraction is essential—it’s how we manage complexity and build on the shoulders of giants. But somewhere along the way, we crossed a threshold. We’re now spending more time managing our abstractions than solving business problems.
The Evolutionary History of Abstraction Layers
The Package Management Revolution
Though, design principles like DRY (don’t repeat yourself) and reusable components have been part of software development for a long time. But I first realized the impact of it when I used PERL’s CPAN in the 1990s. I used it extensively with the Mason web templating system at a large online retailer. It worked beautifully until it didn’t. Then came the avalanche: Maven for Java, pip for Python, npm for JavaScript, RubyGems, Cargo for Rust. Each language needed its own package ecosystem. Each package could depend on other packages, which depended on other packages, creating dependency trees that looked like fractals.
The problem isn’t package management itself—it’s that we never developed mature patterns for managing these dependencies at scale. A single Go project might pull in hundreds of transitive dependencies, each a potential security vulnerability. The npm ecosystem exemplifies this chaos. I remember the left-pad incident in 2016 when a developer unpublished his 11-line package that padded strings with spaces. Thousands of projects broke overnight—Babel, React, and countless applications—because they depended on it through layers of transitive dependencies. Eleven lines of code that any developer could write in 30 seconds brought the JavaScript ecosystem to a halt.
This pattern repeats constantly. I’ve seen production applications import packages for:
- is-odd / is-even: Check if a number is odd (
return n % 2 === 1) - is-array: Check array type (JavaScript has
Array.isArray()built-in) - string-split: Split text (seriously)
Each trivial dependency multiplies risk. The 2021 colors.js and faker.js sabotage showed how one maintainer intentionally broke millions of projects with infinite loops. The Go ecosystem has seen malicious typosquatted packages targeting cryptocurrency wallets. Critical vulnerabilities in golang.org/x/crypto and golang.org/x/net require emergency patches that cascade through entire dependency chains.
We’ve normalized depending on thousands of external packages for trivial functionality. It’s faster to go get a package than write a 5-line function, but we pay for that convenience with complexity, security risk, and fragility that compounds with every added dependency.
The O/R Mapping Disaster
In the 1990s and early 2000s, I was greatly influenced by Martin Fowler’s books like Analysis Patterns and Patterns of Enterprise Application Architecture. These books introduced abstractions for database like Active Record and Data Mapper. On Java platform, I used Hibernate that provided implementation of Data Mapper for mapping objects to database tables (also called O/R mapping). On Ruby on Rails platform, I used Active Record pattern for similar abstraction. I watched teams define elaborate object graphs with lazy loading, eager loading, and cascading relationships.
The result? What should have been a simple query became a performance catastrophe. You’d ask for a User object and get back an 800-pound gorilla holding your user—along with every related object, their related objects, and their related objects. This is also called the “N+1 problem,” and it destroyed application performance.
Here’s what I mean in Go with GORM:
// Looks innocent enough
type User struct {
    ID       uint
    Name     string
    Posts    []Post    // One-to-many relationship
    Profile  Profile   // One-to-one relationship
    Comments []Comment // One-to-many relationship
}

// Simple query, right?
var user User
db.Preload("Posts").Preload("Profile").Preload("Comments").First(&user, userId)

// But look at what actually executes:
// Query 1: SELECT * FROM users WHERE id = ?
// Query 2: SELECT * FROM posts WHERE user_id = ?
// Query 3: SELECT * FROM profiles WHERE user_id = ?
// Query 4: SELECT * FROM comments WHERE user_id = ?
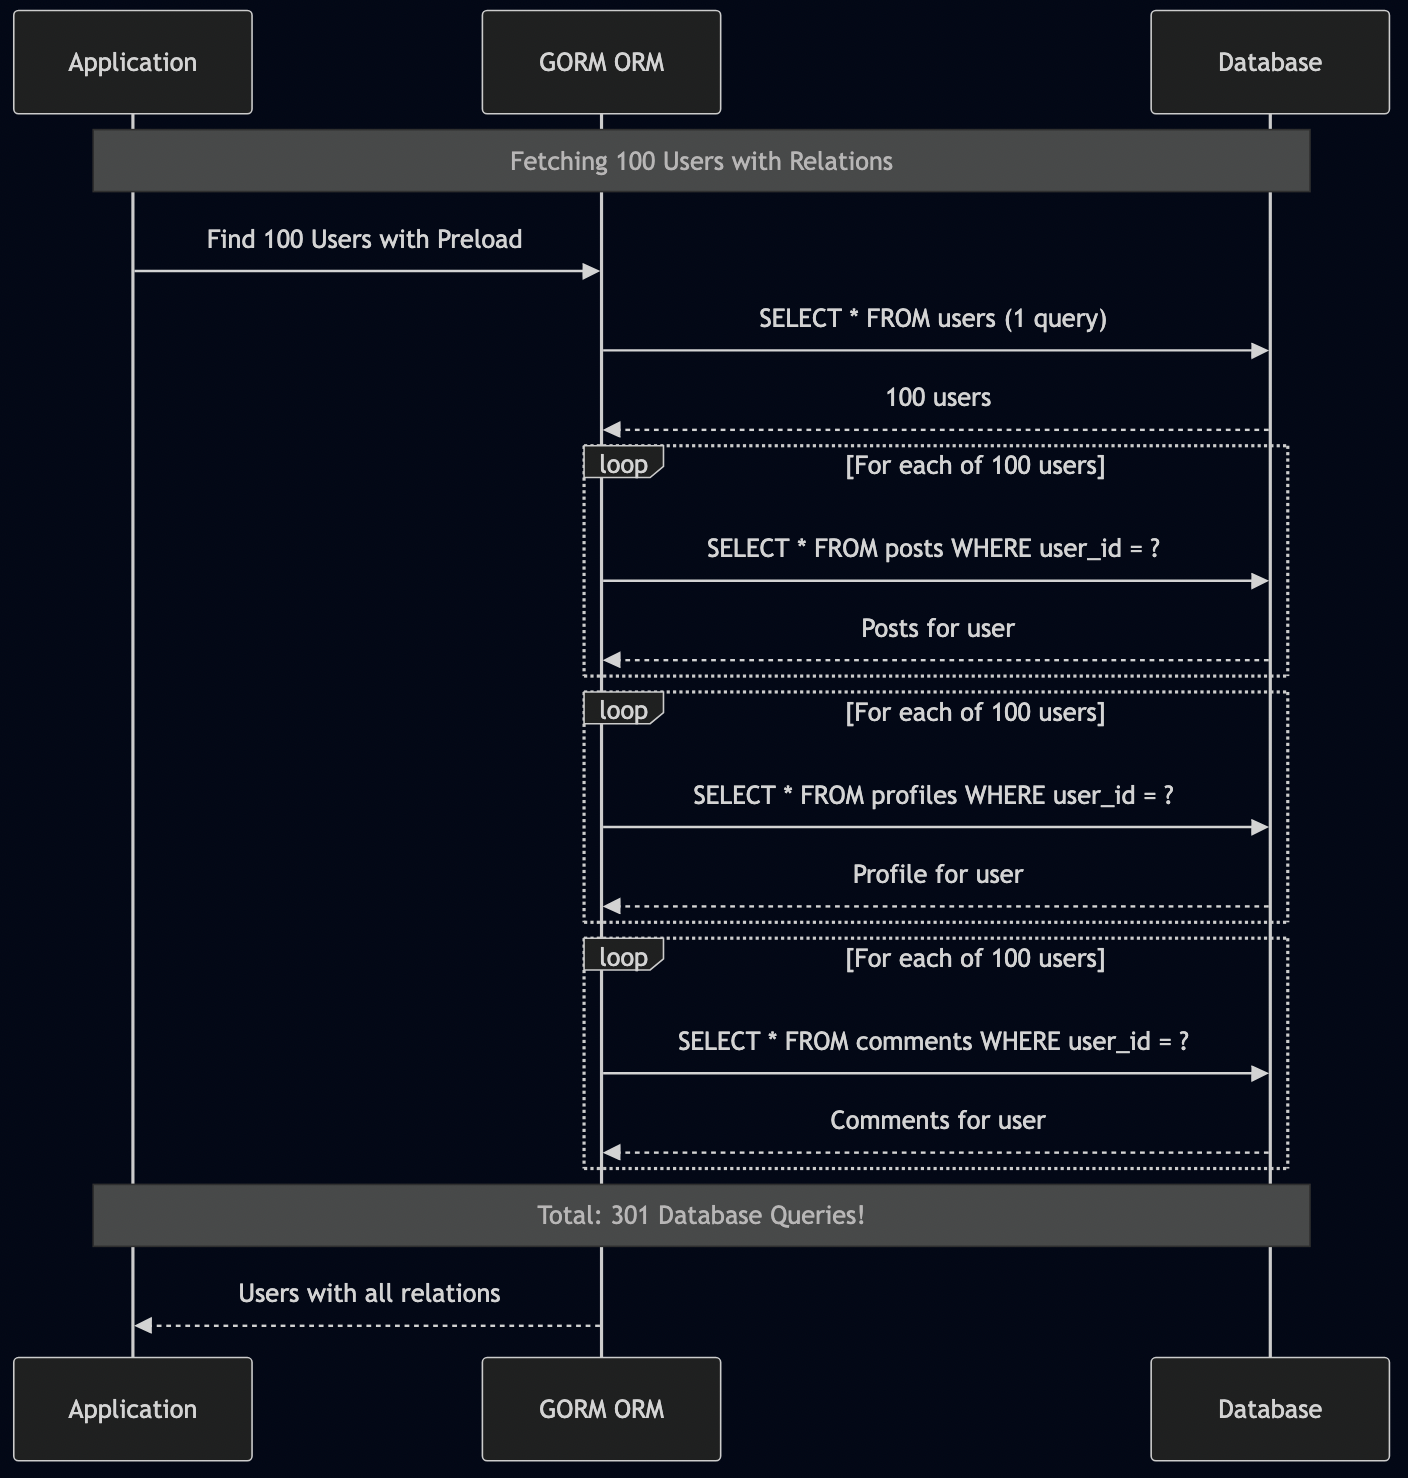
Now imagine fetching 100 users:
var users []User
db.Preload("Posts").Preload("Profile").Preload("Comments").Find(&users)

// That's potentially 301 database queries!
// 1 query for users
// 100 queries for posts (one per user)
// 100 queries for profiles
// 100 queries for comments
The abstraction leaked everywhere. To use GORM effectively, you needed to understand SQL, database indexes, query optimization, connection pooling, transaction isolation levels, and GORM’s caching strategies. The abstraction didn’t eliminate complexity; it added a layer you also had to master.
Compare this to someone who understands SQL:
type UserWithDetails struct {
    User
    PostCount    int
    CommentCount int
}

// One query with proper joins
query := `
    SELECT
        u.*,
        COUNT(DISTINCT p.id) as post_count,
        COUNT(DISTINCT c.id) as comment_count
    FROM users u
    LEFT JOIN posts p ON u.id = p.user_id
    LEFT JOIN comments c ON u.id = c.user_id
    GROUP BY u.id
`

var users []UserWithDetails
db.Raw(query).Scan(&users)
One query. 300x faster. But this requires understanding how databases work, not just how ORMs work.
The Container Revolution and Its Discontents
I started using VMware in the early 2000s. It was magical—entire operating systems running in isolation. When Amazon launched EC2 in 2006, it revolutionized infrastructure by making virtualization accessible at scale. EC2 was built on Xen hypervisor—an open-source virtualization technology that allowed multiple operating systems to run on the same physical hardware. Suddenly, everyone was deploying VM images: build an image, install your software, configure everything, and deploy it to AWS.
Docker simplified this in 2013. Instead of full VMs running complete operating systems, you had lightweight containers sharing the host kernel. Then Kubernetes arrived in 2014 to orchestrate those containers. Then service meshes like Istio appeared in 2017 to manage the networking between containers. Still solving real problems!
But look at what we’ve built:
# A "simple" Kubernetes deployment for a Go service
apiVersion: apps/v1
kind: Deployment
metadata:
  name: user-service
spec:
  replicas: 3
  template:
    metadata:
      annotations:
        # Istio: Wait for proxy to start before app
        sidecar.istio.io/holdApplicationUntilProxyStarts: "true"
        # Istio: Keep proxy alive during shutdown
        proxy.istio.io/config: '{"proxyMetadata":{"EXIT_ON_ZERO_ACTIVE_CONNECTIONS":"true"}}'
        # Istio: How long to drain connections
        sidecar.istio.io/terminationDrainDuration: "45s"
    spec:
      containers:
      - name: app
        image: user-service:latest
        ports:
        - containerPort: 8080
        # Delay shutdown to allow load balancer updates
        lifecycle:
          preStop:
            exec:
              command: ["/bin/sh", "-c", "sleep 15"]
        # Check if process is alive
        livenessProbe:
          httpGet:
            path: /healthz
            port: 8080
          initialDelaySeconds: 10
          periodSeconds: 30
        # Check if ready to receive traffic
        readinessProbe:
          httpGet:
            path: /ready
            port: 8080
          initialDelaySeconds: 5
          periodSeconds: 10
        # Check if startup completed
        startupProbe:
          httpGet:
            path: /healthz
            port: 8080
          failureThreshold: 30
          periodSeconds: 10
      # How long to wait before force-killing
      terminationGracePeriodSeconds: 65
This configuration is trying to solve one problem: gracefully shut down a service without dropping requests. But look at all the coordination required:
- The application needs to handle SIGTERM
- The readiness probe must stop returning healthy
- The Istio sidecar needs to drain connections
- The preStop hook delays shutdown
- Multiple timeout values must be carefully orchestrated
- If any of these are misconfigured, you drop requests or deadlock
I have encountered countless incidents at work due to misconfiguration of these parameters and teams end up spending endless hours to debug these issues. I explained some of these startup/shutdown coordination issues in Zero-Downtime Services with Lifecycle Management on Kubernetes and Istio.
The Learning Curve Crisis: From BASIC to “Full Stack”
When I Started: 1980s BASIC
10 PRINT "WHAT IS YOUR NAME?"
20 INPUT NAME$
30 PRINT "HELLO, "; NAME$
40 END
That was a complete program. I could write it, run it, understand every line, and explain to someone else how it worked—all in 10 minutes. When I learned programming in the 1980s, you could go from zero to writing useful programs in a few weeks. The entire BASIC language fit on a reference card that came with your computer. You didn’t need to install anything. You turned on the computer and you were programming.
Today’s “Hello World” in Go
Here’s what you need to know to build a modern web application:
Backend (Go):
package main

import (
    "context"
    "encoding/json"
    "log"
    "net/http"
    "os"
    "os/signal"
    "syscall"
    "time"

    "github.com/gorilla/mux"
    "go.opentelemetry.io/otel"
    "go.opentelemetry.io/otel/trace"
)

type GreetingRequest struct {
    Name string `json:"name"`
}

type GreetingResponse struct {
    Message string `json:"message"`
}

type Server struct {
    router *mux.Router
    tracer trace.Tracer
}

func NewServer() *Server {
    s := &Server{
        router: mux.NewRouter(),
        tracer: otel.Tracer("greeting-service"),
    }
    s.routes()
    return s
}

func (s *Server) routes() {
    s.router.HandleFunc("/api/greeting", s.handleGreeting).Methods("POST")
    s.router.HandleFunc("/healthz", s.handleHealth).Methods("GET")
    s.router.HandleFunc("/ready", s.handleReady).Methods("GET")
}

func (s *Server) handleGreeting(w http.ResponseWriter, r *http.Request) {
    ctx, span := s.tracer.Start(r.Context(), "handleGreeting")
    defer span.End()

    var req GreetingRequest
    if err := json.NewDecoder(r.Body).Decode(&req); err != nil {
        http.Error(w, err.Error(), http.StatusBadRequest)
        return
    }

    resp := GreetingResponse{
        Message: "Hello, " + req.Name + "!",
    }

    w.Header().Set("Content-Type", "application/json")
    json.NewEncoder(w).Encode(resp)
}

func (s *Server) handleHealth(w http.ResponseWriter, r *http.Request) {
    w.WriteHeader(http.StatusOK)
    w.Write([]byte("OK"))
}

func (s *Server) handleReady(w http.ResponseWriter, r *http.Request) {
    // Check if dependencies are ready
    // For now, just return OK
    w.WriteHeader(http.StatusOK)
    w.Write([]byte("READY"))
}

func (s *Server) Start(addr string) error {
    srv := &http.Server{
        Addr:         addr,
        Handler:      s.router,
        ReadTimeout:  15 * time.Second,
        WriteTimeout: 15 * time.Second,
        IdleTimeout:  60 * time.Second,
    }

    // Graceful shutdown
    go func() {
        sigint := make(chan os.Signal, 1)
        signal.Notify(sigint, os.Interrupt, syscall.SIGTERM)
        <-sigint

        log.Println("Shutting down server...")

        ctx, cancel := context.WithTimeout(context.Background(), 40*time.Second)
        defer cancel()

        if err := srv.Shutdown(ctx); err != nil {
            log.Printf("Server shutdown error: %v", err)
        }
    }()

    log.Printf("Starting server on %s", addr)
    return srv.ListenAndServe()
}

func main() {
    server := NewServer()
    if err := server.Start(":8080"); err != nil && err != http.ErrServerClosed {
        log.Fatalf("Server failed: %v", err)
    }
}
Dockerfile:
FROM golang:1.21-alpine AS builder
WORKDIR /app
COPY go.mod go.sum ./
RUN go mod download
COPY . .
RUN CGO_ENABLED=0 GOOS=linux go build -o /server

FROM alpine:latest
RUN apk --no-cache add ca-certificates
WORKDIR /root/
COPY --from=builder /server .
EXPOSE 8080
CMD ["./server"]
docker-compose.yml:
version: '3.8'
services:
  app:
    build: .
    ports:
      - "8080:8080"
    environment:
      - ENV=production
    healthcheck:
      test: ["CMD", "wget", "--quiet", "--tries=1", "--spider", "http://localhost:8080/healthz"]
      interval: 30s
      timeout: 10s
      retries: 3
To write that “Hello World” application, a new developer needs to understand:
| Languages & Syntax | Concepts & Patterns | Tools & Frameworks | Infrastructure & Deployment |
|---|---|---|---|
| Go language (types, interfaces, goroutines, channels) | HTTP request/response cycle | Go modules for dependency management | Container concepts |
| JSON for data serialization | RESTful API design | Gorilla Mux (or similar router) | Multi-stage Docker builds |
| YAML for configuration | Context propagation | OpenTelemetry for observability | Port mapping |
| Dockerfile syntax | Graceful shutdown | Docker for containerization | Health checks |
| Health checks and readiness probes | Docker Compose for local orchestration | Environment variables | |
| Structured logging | Build vs runtime separation | ||
| Distributed tracing | |||
| Signal handling (SIGTERM, SIGINT) |
Total concepts to learn: 27 (just to write a “Hello World” service)
And we haven’t even added:
- Database integration
- Authentication/authorization
- Testing frameworks
- CI/CD pipelines
- Kubernetes deployment
- Service mesh configuration
- Monitoring and alerting
- Rate limiting
- Circuit breakers
The Framework Treadmill
When I started, learning a language meant learning THE language. You learned C, and that knowledge was good for decades. Today in the Go ecosystem alone, you need to choose between:
| Web Frameworks | ORM/Database Libraries | Configuration Management | Logging |
|---|---|---|---|
| net/http (standard library – minimal) | database/sql (standard library) | Viper | log (standard library) |
| Gin (fast, minimalist) | GORM (full-featured ORM) | envconfig | logrus |
| Echo (feature-rich) | sqlx (extensions to database/sql) | figenv | zap |
| Fiber (Express-inspired) | sqlc (generates type-safe code from SQL) | kong | zerolog |
| Chi (lightweight, composable) | ent (entity framework) | ||
| Gorilla (toolkit of packages) |
Each choice cascades into more choices:
- “We use Gin with GORM, configured via Viper, logging with zap, deployed on Kubernetes with Istio, monitored with Prometheus and Grafana, traced with Jaeger, with CI/CD through GitHub Actions and ArgoCD.”
Junior developers need to learn 10+ tools/frameworks just to contribute their first line of code.
The Lost Art of Understanding the Stack
The Full Stack Illusion
We celebrate “full stack developers,” but what we often have are “full abstraction developers”—people who know frameworks but not fundamentals.
I’ve interviewed candidates who could build a Go microservice but couldn’t explain:
- How HTTP actually works
- What happens when you type a URL in a browser
- How a database index speeds up queries
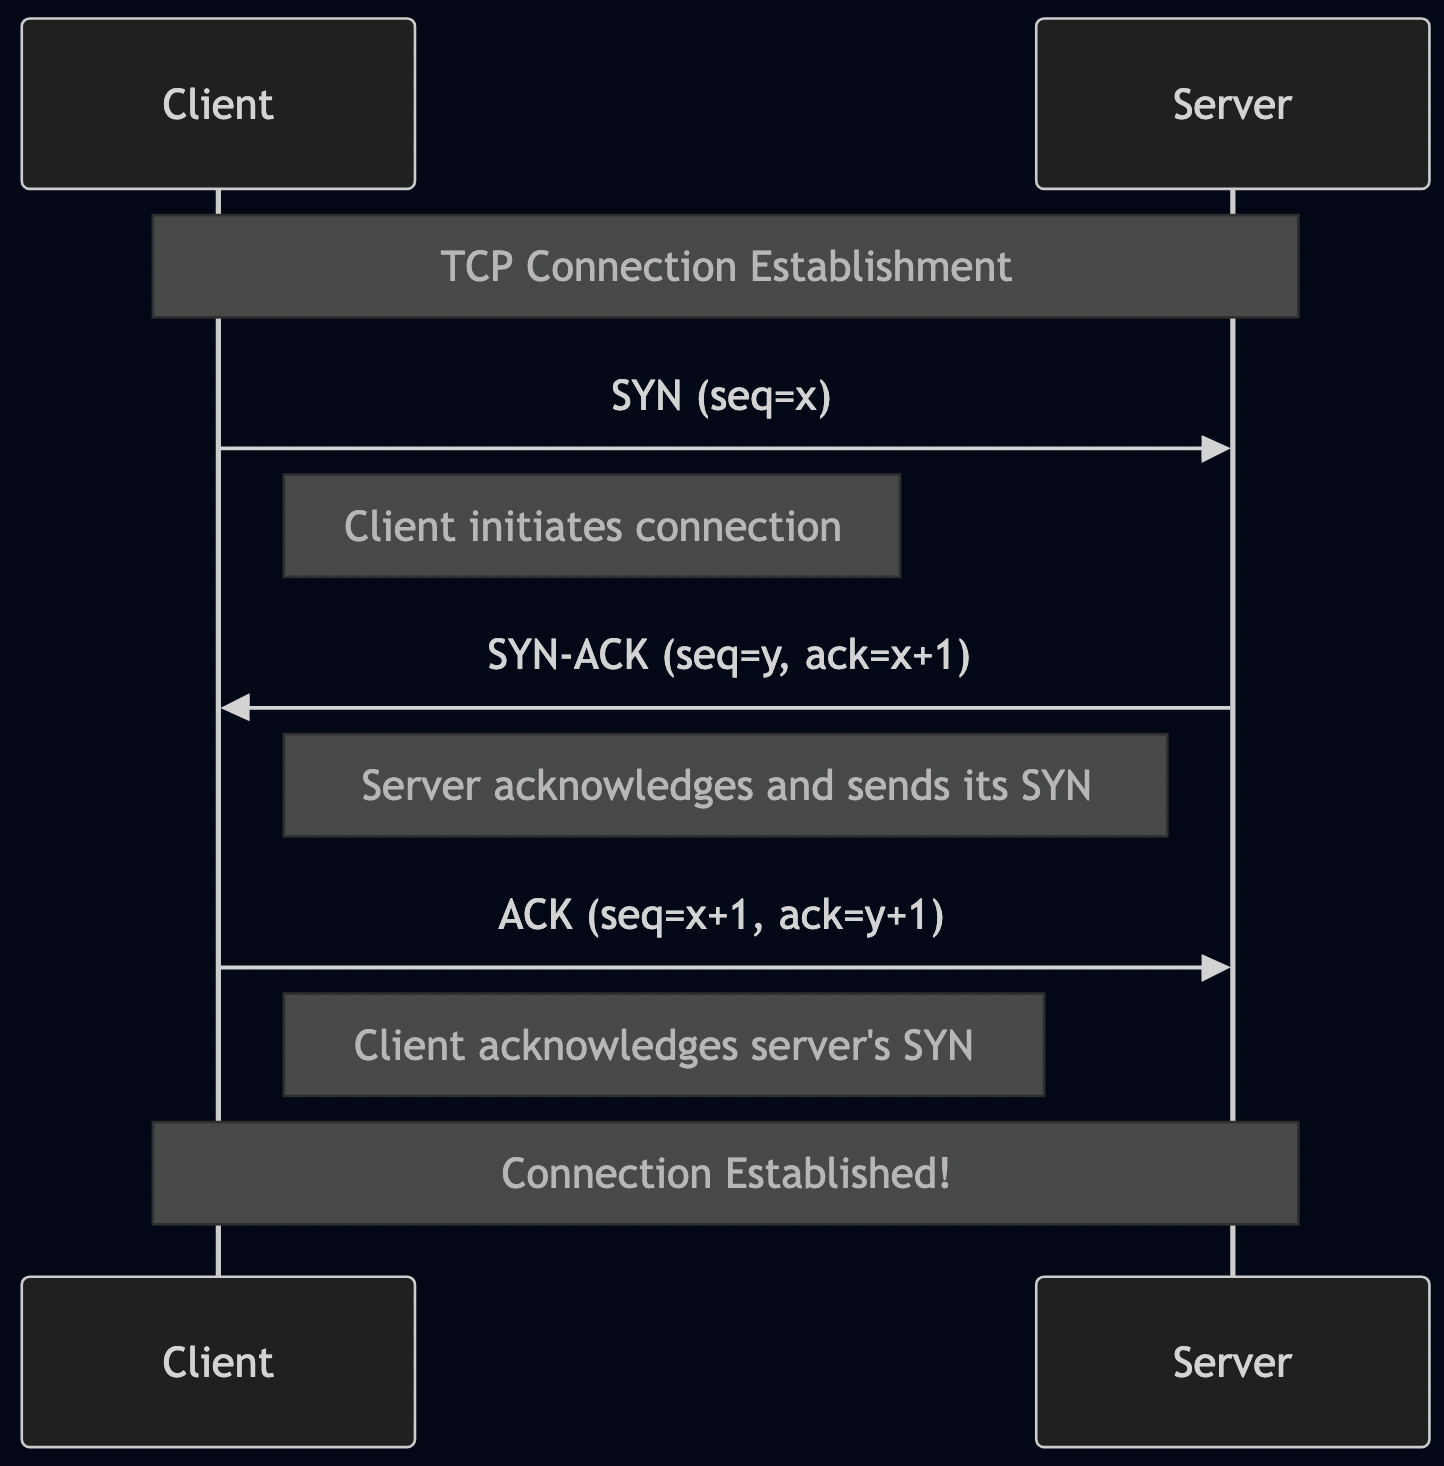
- Why you’d choose TCP vs UDP
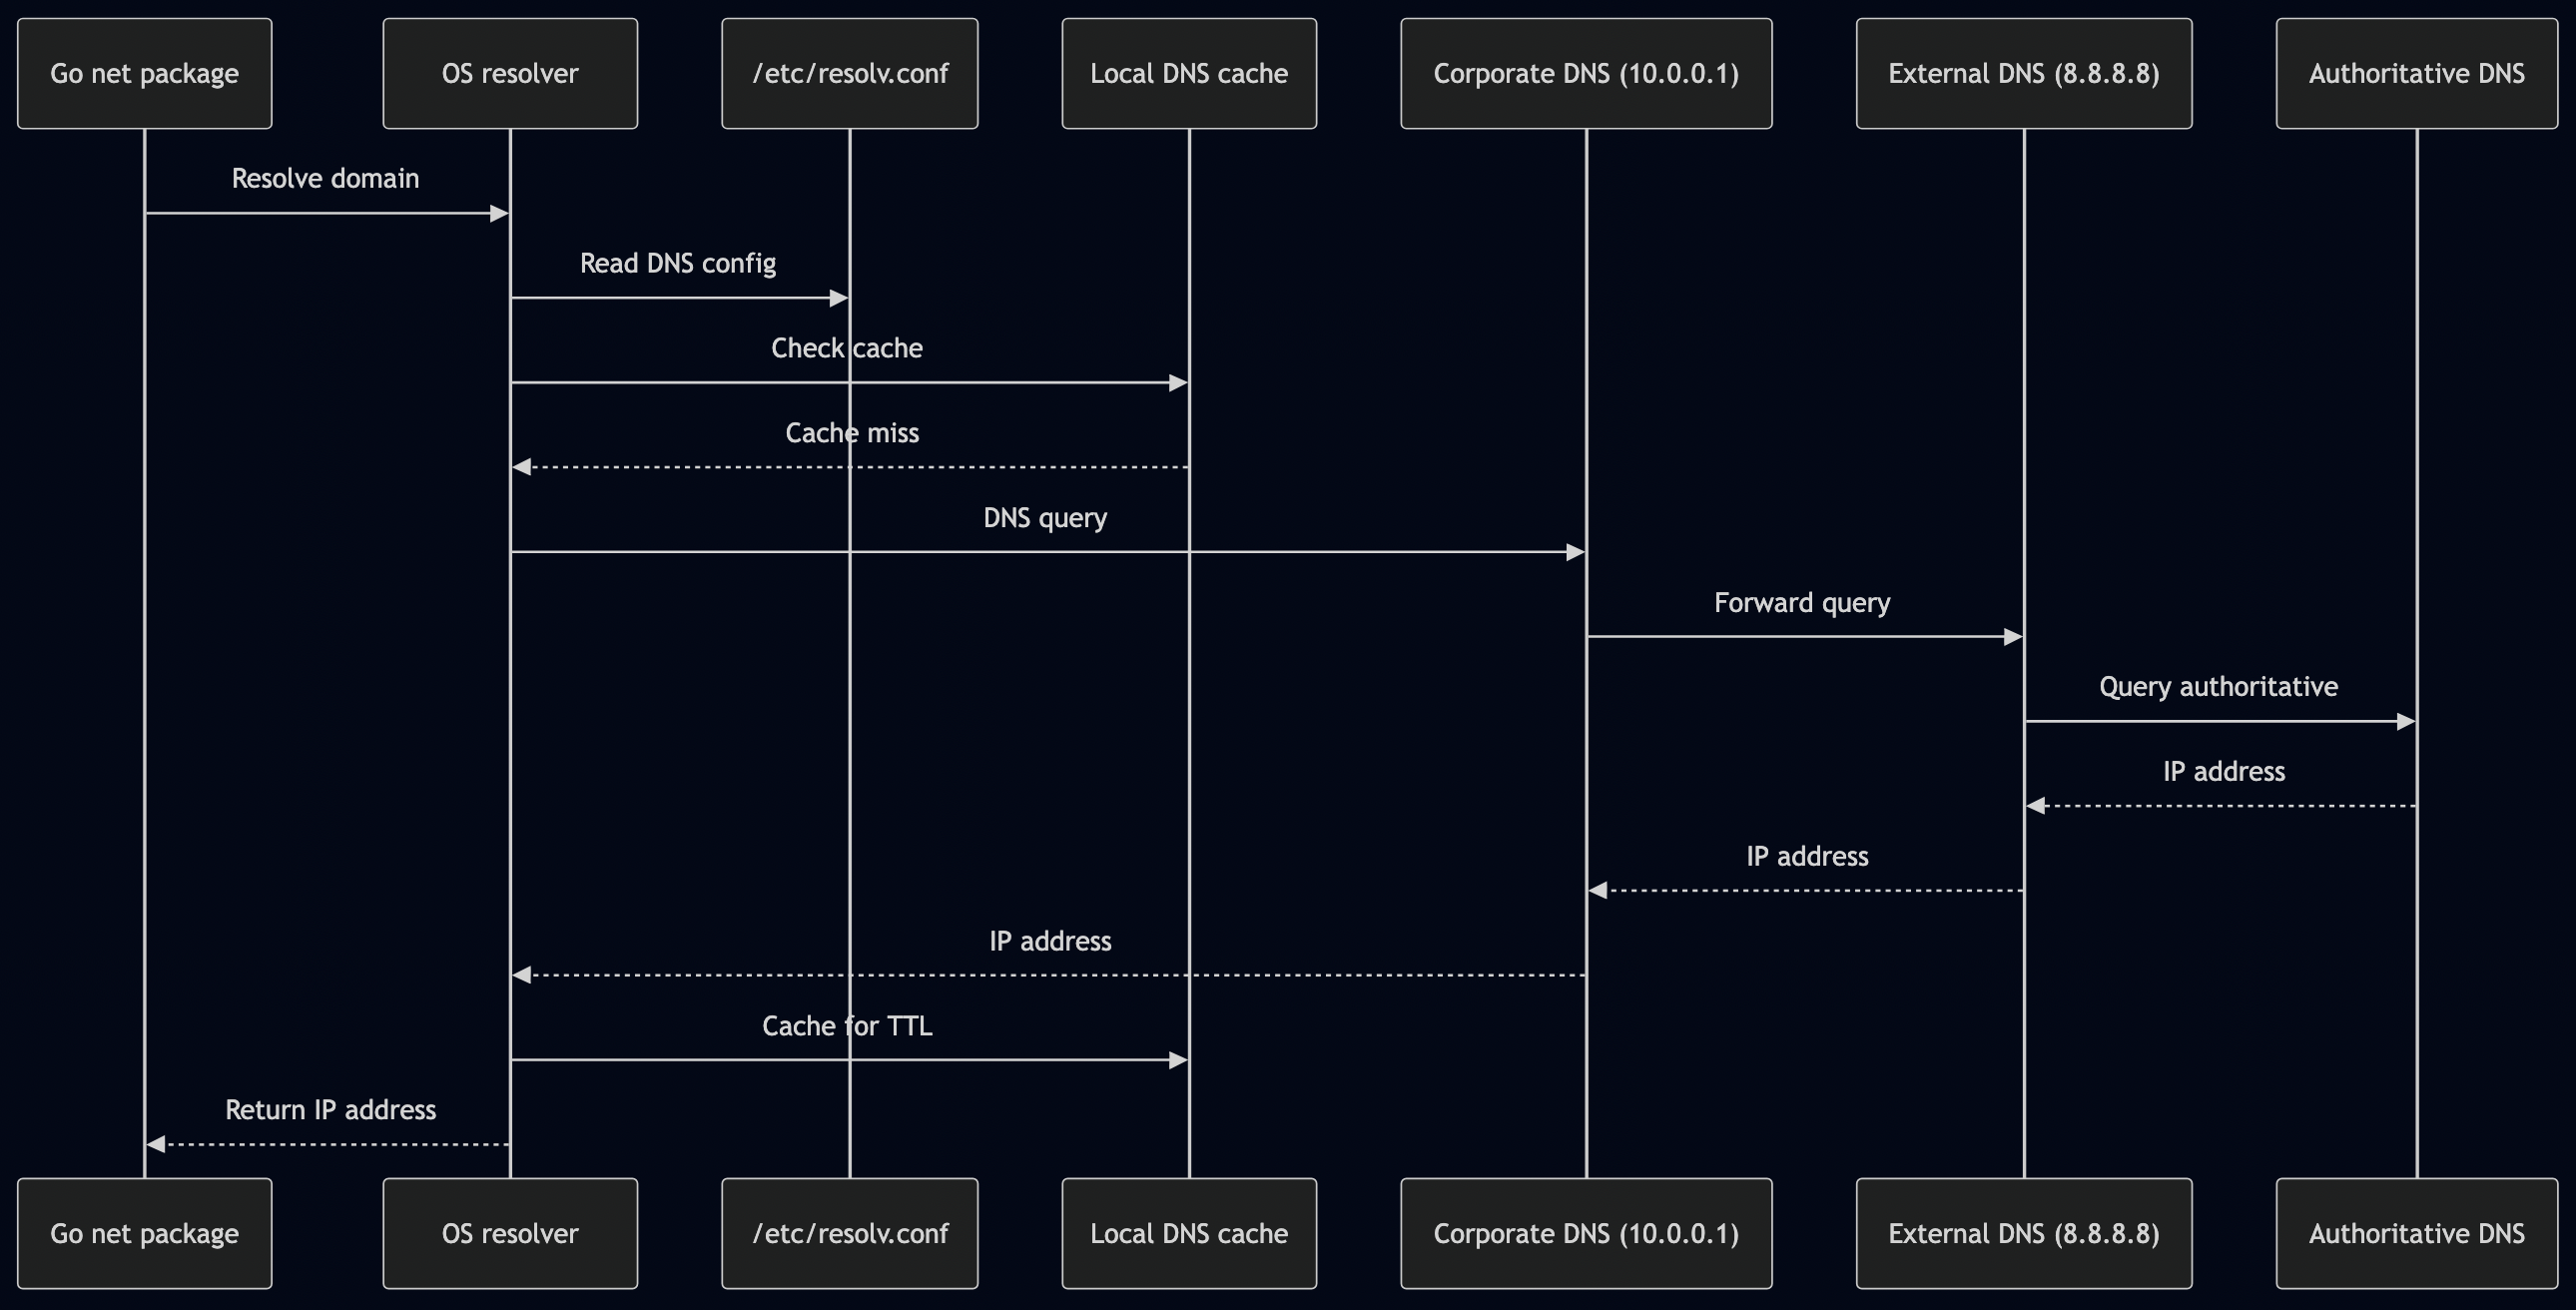
- What DNS resolution is
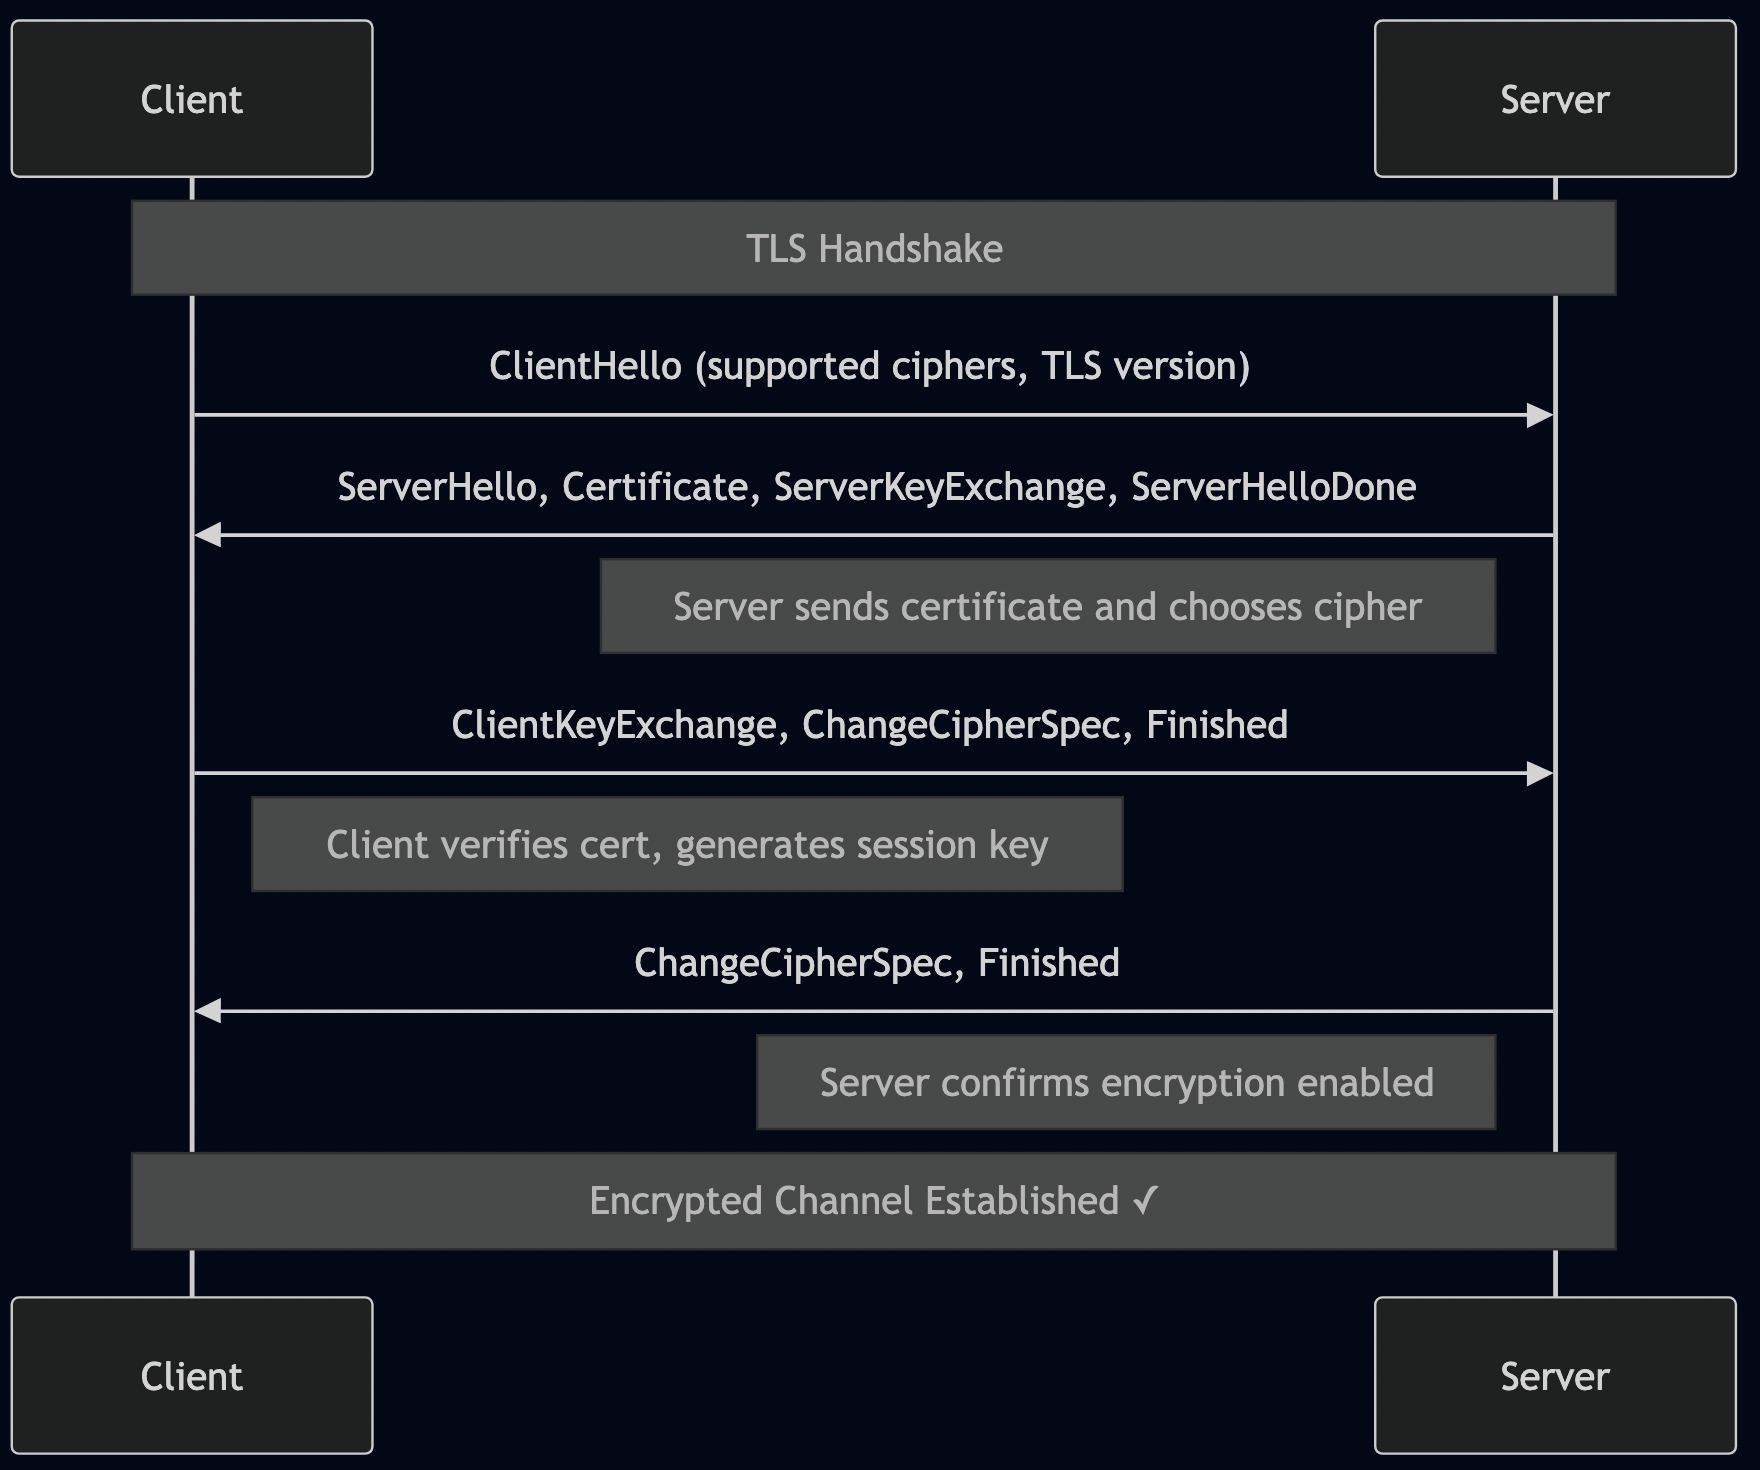
- How TLS handshakes work
They knew how to use the net/http package, but not what an HTTP request actually contains. They knew how to deploy to AWS, but not what happens when their code runs.
The Layers of Ignorance
Here’s what a request traverses, and how much the average developer knows about each layer:
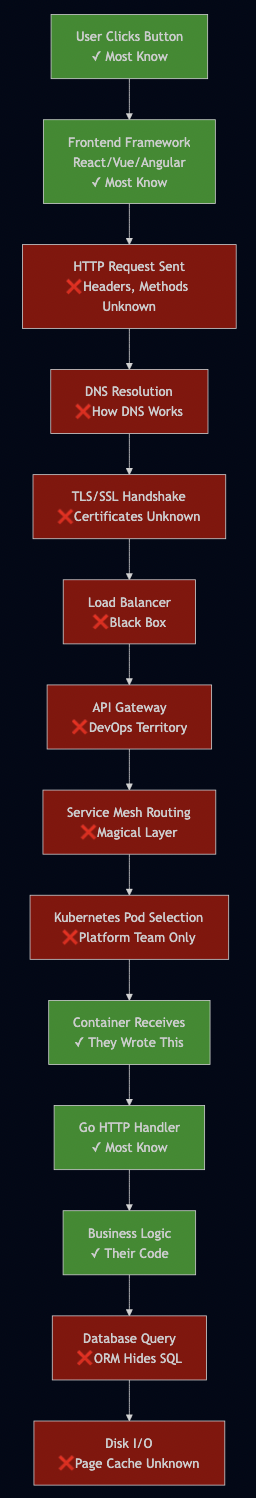
Developers understand 3-4 layers out of 15+. The rest is abstraction they trust blindly.
When Abstractions Break: The Debugging Nightmare
This shallow understanding becomes catastrophic during outages:
Incident: “API is slow, requests timing out”
Junior developer’s debugging process:
- Check application logs – nothing obvious
- Check if code changed recently – no
- Ask in Slack – no one knows
- Create “high priority” ticket
- Wait for senior engineer
Senior engineer’s debugging process:
- Check Go runtime metrics (goroutine leaks, GC pauses)
- Check database query performance with
EXPLAIN - Check database connection pool saturation
- Check network latency to database
- Check if database indexes missing
- Check Kubernetes pod resource limits (CPU throttling?)
- Check if auto-scaling triggered
- Check service mesh retry storms
- Check load balancer distribution
- Check if upstream dependencies slow
- Check for DNS resolution issues
- Check certificate expiration
- Check rate limiting configuration
- Use pprof to profile the actual code
- Find the issue (connection pool exhausted because MaxOpenConns was too low)
The senior engineer has mechanical empathy—they understand the full stack from code to silicon. The junior engineer knows frameworks but not fundamentals.
The Hardware Layer Amnesia
When I learned programming, we understood hardware constraints:
1980s mindset:
- “This loop will execute 1000 times, that’s 1000 memory accesses”
- “Disk I/O is 1000x slower than RAM”
- “Network calls are 100x slower than disk”
Modern mindset:
- “Just call the API”
- “Just query the database”
- “Just iterate over this slice”
No thought about:
- CPU cache locality
- Memory allocations and GC pressure
- Network round trips
- Database query plans
- Disk I/O patterns
Example 1: The GraphQL Resolver Nightmare
GraphQL promises elegant APIs where clients request exactly what they need. But the implementation often creates performance disasters:
// GraphQL resolver - looks clean!
type UserResolver struct {
    userRepo     *UserRepository
    postRepo     *PostRepository
    commentRepo  *CommentRepository
    followerRepo *FollowerRepository
}

func (r *UserResolver) User(ctx context.Context, args struct{ ID string }) (*User, error) {
    return r.userRepo.GetByID(ctx, args.ID)
}

func (r *UserResolver) Posts(ctx context.Context, user *User) ([]*Post, error) {
    // Called for EACH user!
    return r.postRepo.GetByUserID(ctx, user.ID)
}

func (r *UserResolver) Comments(ctx context.Context, user *User) ([]*Comment, error) {
    // Called for EACH user!
    return r.commentRepo.GetByUserID(ctx, user.ID)
}

func (r *UserResolver) Followers(ctx context.Context, user *User) ([]*Follower, error) {
    // Called for EACH user!
    return r.followerRepo.GetByUserID(ctx, user.ID)
}
Client queries this seemingly simple GraphQL:
query {
  users(limit: 100) {
    id
    name
    posts { title }
    comments { text }
    followers { name }
  }
}
What actually happens:
1 query:  SELECT * FROM users LIMIT 100
100 queries: SELECT * FROM posts WHERE user_id = ? (one per user)
100 queries: SELECT * FROM comments WHERE user_id = ? (one per user)
100 queries: SELECT * FROM followers WHERE user_id = ? (one per user)

Total: 301 database queries
Latency: 100ms (DB) × 301 = 30+ seconds!
The developer thought they built an elegant API. They created a performance catastrophe. Mechanical empathy would have recognized this N+1 pattern immediately.
The fix requires understanding data loading patterns:
// Use DataLoader to batch requests
type UserResolver struct {
    userLoader     *dataloader.Loader
    postLoader     *dataloader.Loader
    commentLoader  *dataloader.Loader
    followerLoader *dataloader.Loader
}

func (r *UserResolver) Posts(ctx context.Context, user *User) ([]*Post, error) {
    // Batches all user IDs, makes ONE query
    thunk := r.postLoader.Load(ctx, dataloader.StringKey(user.ID))
    return thunk()
}

// Batch function - called once with all user IDs
func batchGetPosts(ctx context.Context, keys dataloader.Keys) []*dataloader.Result {
    userIDs := keys.Keys()
    // Single query: SELECT * FROM posts WHERE user_id IN (?, ?, ?, ...)
    posts, err := repo.GetByUserIDs(ctx, userIDs)
    // Group by user_id and return
    return groupPostsByUser(posts, userIDs)
}

// Now: 4 queries total instead of 301
Example 2: The Permission Filtering Disaster
Another pattern I see constantly: fetching all data first, then filtering by permissions in memory.
// WRONG: Fetch everything, filter in application
func (s *DocumentService) GetUserDocuments(ctx context.Context, userID string) ([]*Document, error) {
    // Fetch ALL documents from database
    allDocs, err := s.repo.GetAllDocuments(ctx)
    if err != nil {
        return nil, err
    }

    // Filter in application memory
    var userDocs []*Document
    for _, doc := range allDocs {
        // Check permissions for each document
        if s.hasPermission(ctx, userID, doc.ID) {
            userDocs = append(userDocs, doc)
        }
    }

    return userDocs, nil
}

func (s *DocumentService) hasPermission(ctx context.Context, userID, docID string) bool {
    // ANOTHER database call for EACH document!
    perms, _ := s.permRepo.GetPermissions(ctx, docID)
    for _, perm := range perms {
        if perm.UserID == userID {
            return true
        }
    }
    return false
}
What happens with 10,000 documents in the system:
1 query:     SELECT * FROM documents (returns 10,000 rows)
10,000 queries: SELECT * FROM permissions WHERE document_id = ?

Database returns: 10,000 documents × average 2KB = 20MB over network
User can access: 5 documents
Result sent to client: 10KB

Waste: 20MB network transfer, 10,001 queries, ~100 seconds latency
Someone with mechanical empathy would filter at the database:
// CORRECT: Filter at database level
func (s *DocumentService) GetUserDocuments(ctx context.Context, userID string) ([]*Document, error) {
    query := `
        SELECT DISTINCT d.*
        FROM documents d
        INNER JOIN permissions p ON d.id = p.document_id
        WHERE p.user_id = ?
    `

    var docs []*Document
    err := s.db.Select(&docs, query, userID)
    return docs, err
}

// Result: 1 query, returns only 5 documents, 10KB transfer, <100ms latency
Example 3: Memory Allocation Blindness
Another common pattern—unnecessary allocations:
// Creates a new string on every iteration
func BuildMessage(names []string) string {
    message := ""
    for _, name := range names {
        message += "Hello, " + name + "! "  // Each += allocates new string
    }
    return message
}

// With 1000 names, this creates 1000 intermediate strings
// GC pressure increases
// Performance degrades
Someone with mechanical empathy would write:
// Uses strings.Builder which pre-allocates and reuses memory
func BuildMessage(names []string) string {
    var builder strings.Builder
    builder.Grow(len(names) * 20)  // Pre-allocate approximate size

    for _, name := range names {
        builder.WriteString("Hello, ")
        builder.WriteString(name)
        builder.WriteString("! ")
    }
    return builder.String()
}

// With 1000 names, this does 1 allocation
The difference? Understanding memory allocation and garbage collection pressure.
The Coordination Nightmare
Let me show you a real problem I encountered repeatedly in production.
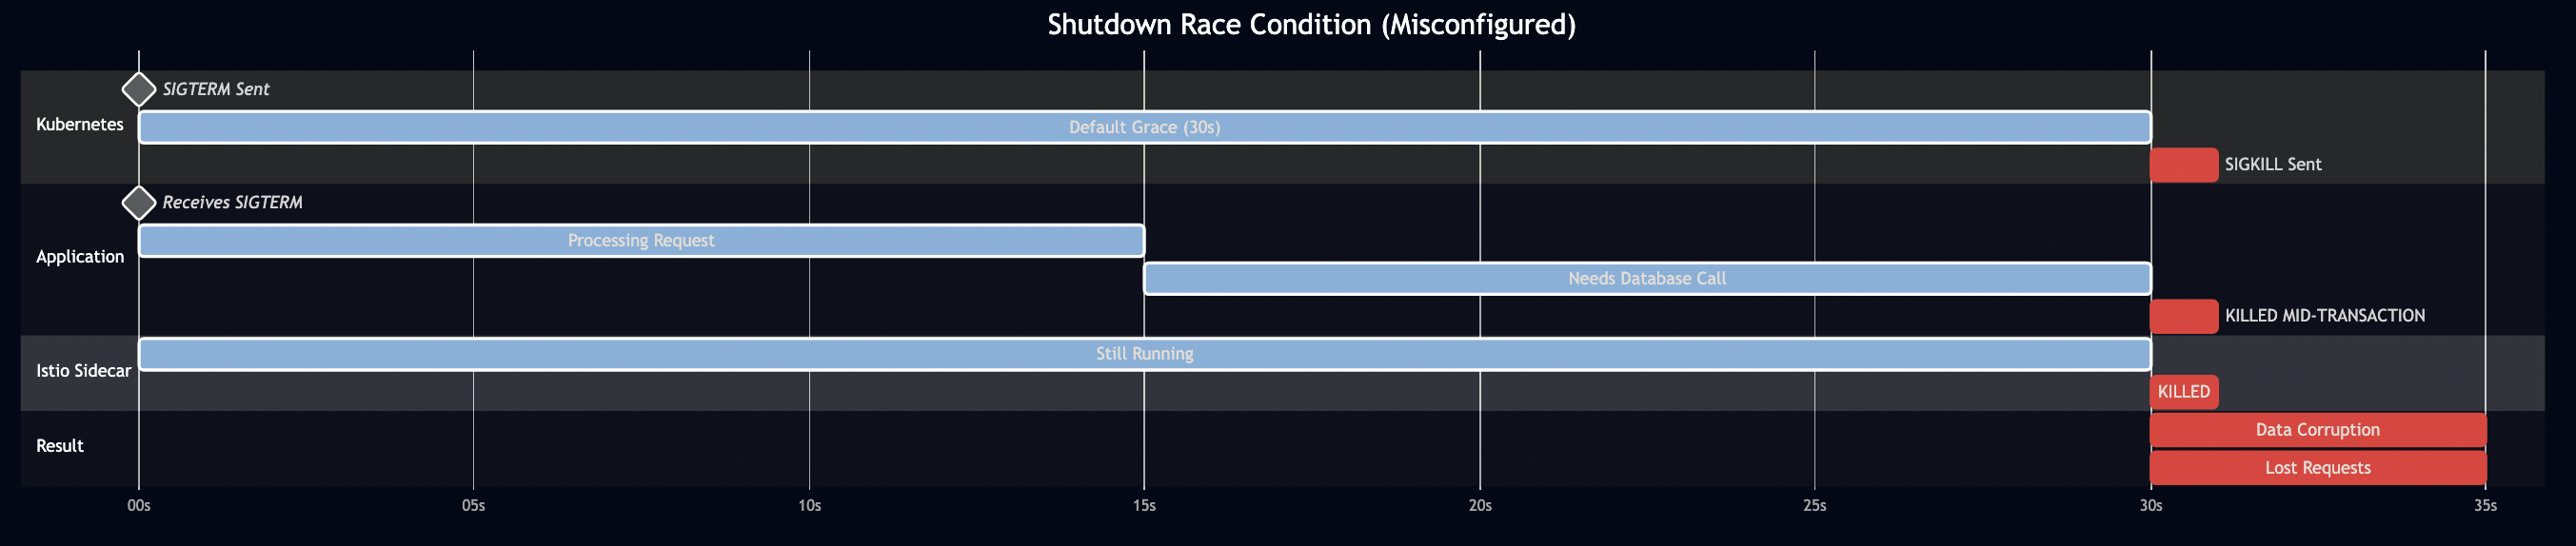
The Shutdown Race Condition
Here’s what should happen when Kubernetes shuts down a pod:
- Kubernetes sends SIGTERM to the pod
- Readiness probe immediately fails (stops receiving traffic)
- Application drains in-flight requests
- Istio sidecar waits for active connections to complete
- Everything shuts down cleanly
Here’s what actually happens when you misconfigure the timeouts:
Here’s the Go code that handles shutdown:
func main() {
    server := NewServer()

    // Channel to listen for interrupt signals
    quit := make(chan os.Signal, 1)
    signal.Notify(quit, syscall.SIGINT, syscall.SIGTERM)

    // Start server in goroutine
    go func() {
        log.Printf("Starting server on :8080")
        if err := server.ListenAndServe(); err != nil && err != http.ErrServerClosed {
            log.Fatalf("Server error: %v", err)
        }
    }()

    // Wait for interrupt signal
    <-quit
    log.Println("Shutting down server...")

    // CRITICAL: This timeout must be less than terminationGracePeriodSeconds
    // and less than Istio's terminationDrainDuration
    ctx, cancel := context.WithTimeout(context.Background(), 40*time.Second)
    defer cancel()

    if err := server.Shutdown(ctx); err != nil {
        log.Fatalf("Server forced to shutdown: %v", err)
    }

    log.Println("Server exited")
}
The fix requires coordinating multiple timeout values across different layers:
# Kubernetes Deployment
spec:
  template:
    metadata:
      annotations:
        # Istio waits for connections to drain for 45 seconds
        sidecar.istio.io/terminationDrainDuration: "45s"
    spec:
      containers:
      - name: app
        lifecycle:
          preStop:
            exec:
              # Sleep 15 seconds to allow load balancer updates to propagate
              command: ["/bin/sh", "-c", "sleep 15"]
      # Kubernetes waits 65 seconds before sending SIGKILL
      terminationGracePeriodSeconds: 65
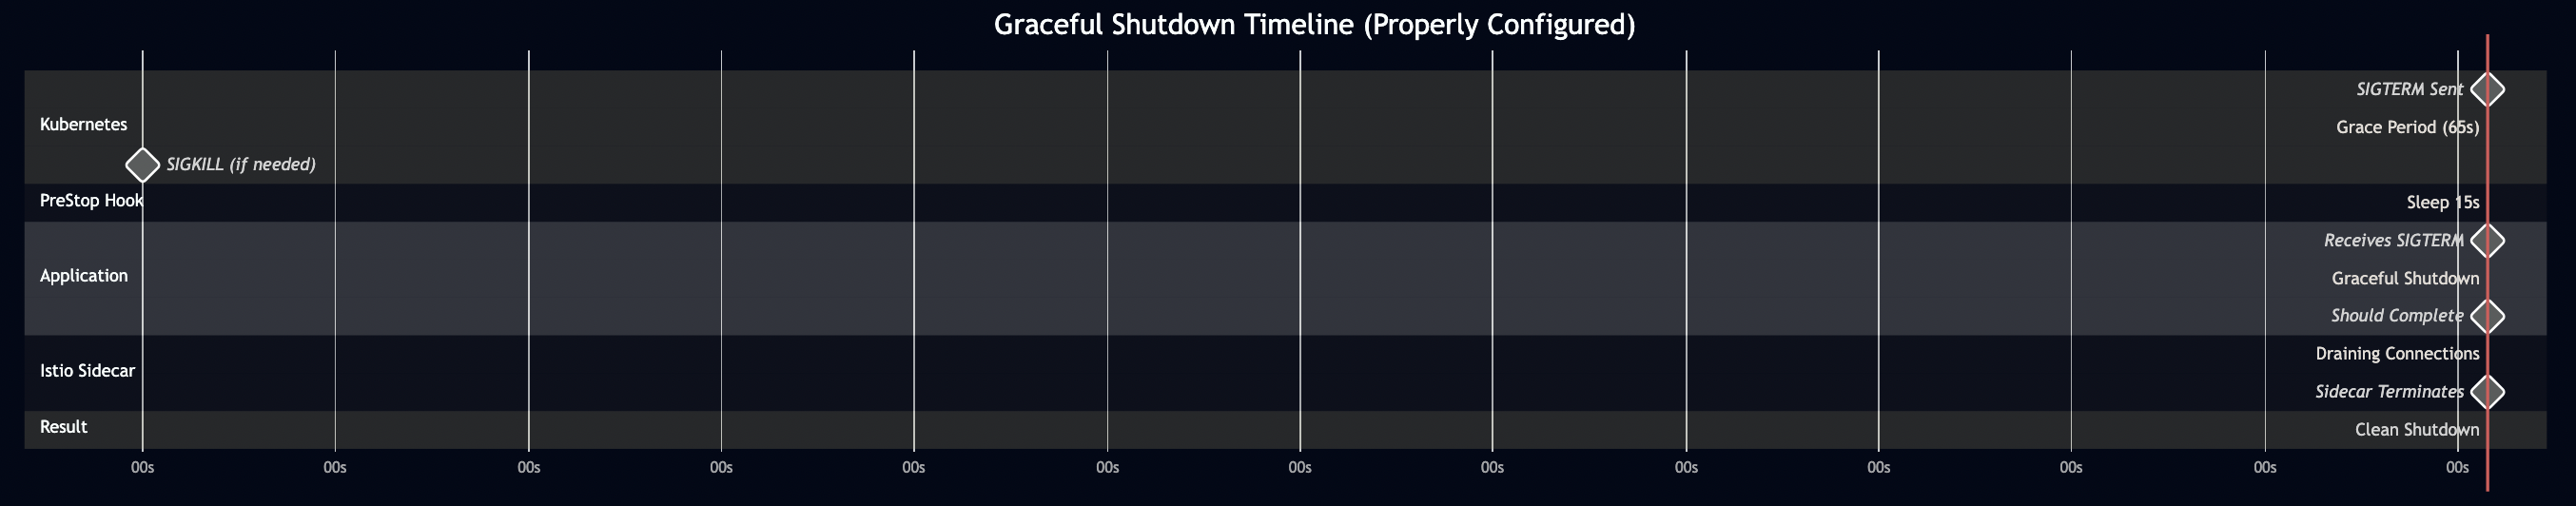
Why these specific numbers?
Total grace period: 65 seconds (Kubernetes level)

Timeline:
0s:  SIGTERM sent
0s:  preStop hook runs (sleeps 15s) - allows LB updates
15s: preStop completes, SIGTERM reaches application
15s: Application begins graceful shutdown (max 40s in code)
55s: Application should be done (15s preStop + 40s app shutdown)
65s: Istio sidecar terminates (has been draining since 0s)
65s: If anything is still running, SIGKILL

Istio drain: 45s (must be < 65s total grace period)
App shutdown: 40s (must be < 45s Istio drain)
PreStop delay: 15s (for load balancer updates)
Buffer: 10s (for safety: 15 + 40 + 10 = 65)
Get any of these wrong, and your service drops requests or deadlocks during deployments.
The Startup Coordination Problem
Here’s another incident pattern:
func main() {
    log.Println("Application starting...")

    // Connect to auth service
    authConn, err := grpc.Dial(
        "auth-service:50051",
        grpc.WithInsecure(),
        grpc.WithBlock(),  // Wait for connection
        grpc.WithTimeout(5*time.Second),
    )
    if err != nil {
        log.Fatalf("Failed to connect to auth service: %v", err)
    }
    defer authConn.Close()

    log.Println("Connected to auth service")
    // ... rest of startup
}
The logs show:
[2024-01-15 10:23:15] Application starting...
[2024-01-15 10:23:15] Failed to connect to auth service:
    context deadline exceeded
[2024-01-15 10:23:15] Application exit code: 1
[2024-01-15 10:23:16] Pod restarting (CrashLoopBackOff)
What happened? The application container started before the Istio sidecar was ready. The application tried to make an outbound gRPC call, but there was no network proxy yet.
The fix:
apiVersion: apps/v1
kind: Deployment
metadata:
  name: my-service
spec:
  template:
    metadata:
      annotations:
        # Critical annotation - wait for Istio proxy to be ready
        sidecar.istio.io/holdApplicationUntilProxyStarts: "true"
But here’s the thing: this annotation was missing from 93% of services in one production environment I analyzed. Why? Because:
- It’s not the default
- It’s easy to forget
- The error only happens during pod startup
- It might work in development (no Istio) but fail in production
The cognitive load is crushing. Developers need to remember:
- Istio startup annotations
- Kubernetes probe configurations
- Application shutdown timeouts
- Database connection pool settings
- gRPC keepalive settings
- Load balancer health check requirements
Any one of these, misconfigured, causes production incidents.
Network Hops: The Hidden Tax
Every network hop adds more than just latency. Let me break down what actually happens:
The Anatomy of a Network Call

When your Go code makes a simple HTTP request:
resp, err := http.Get("https://api.example.com/users")
if err != nil {
    return err
}
defer resp.Body.Close()
Here’s what actually happens:
1. DNS Resolution (10-100ms)
2. TCP Connection (30-100ms for new connection)
3. TLS Handshake (50-200ms for new connection)
4. HTTP Request (actual request time)
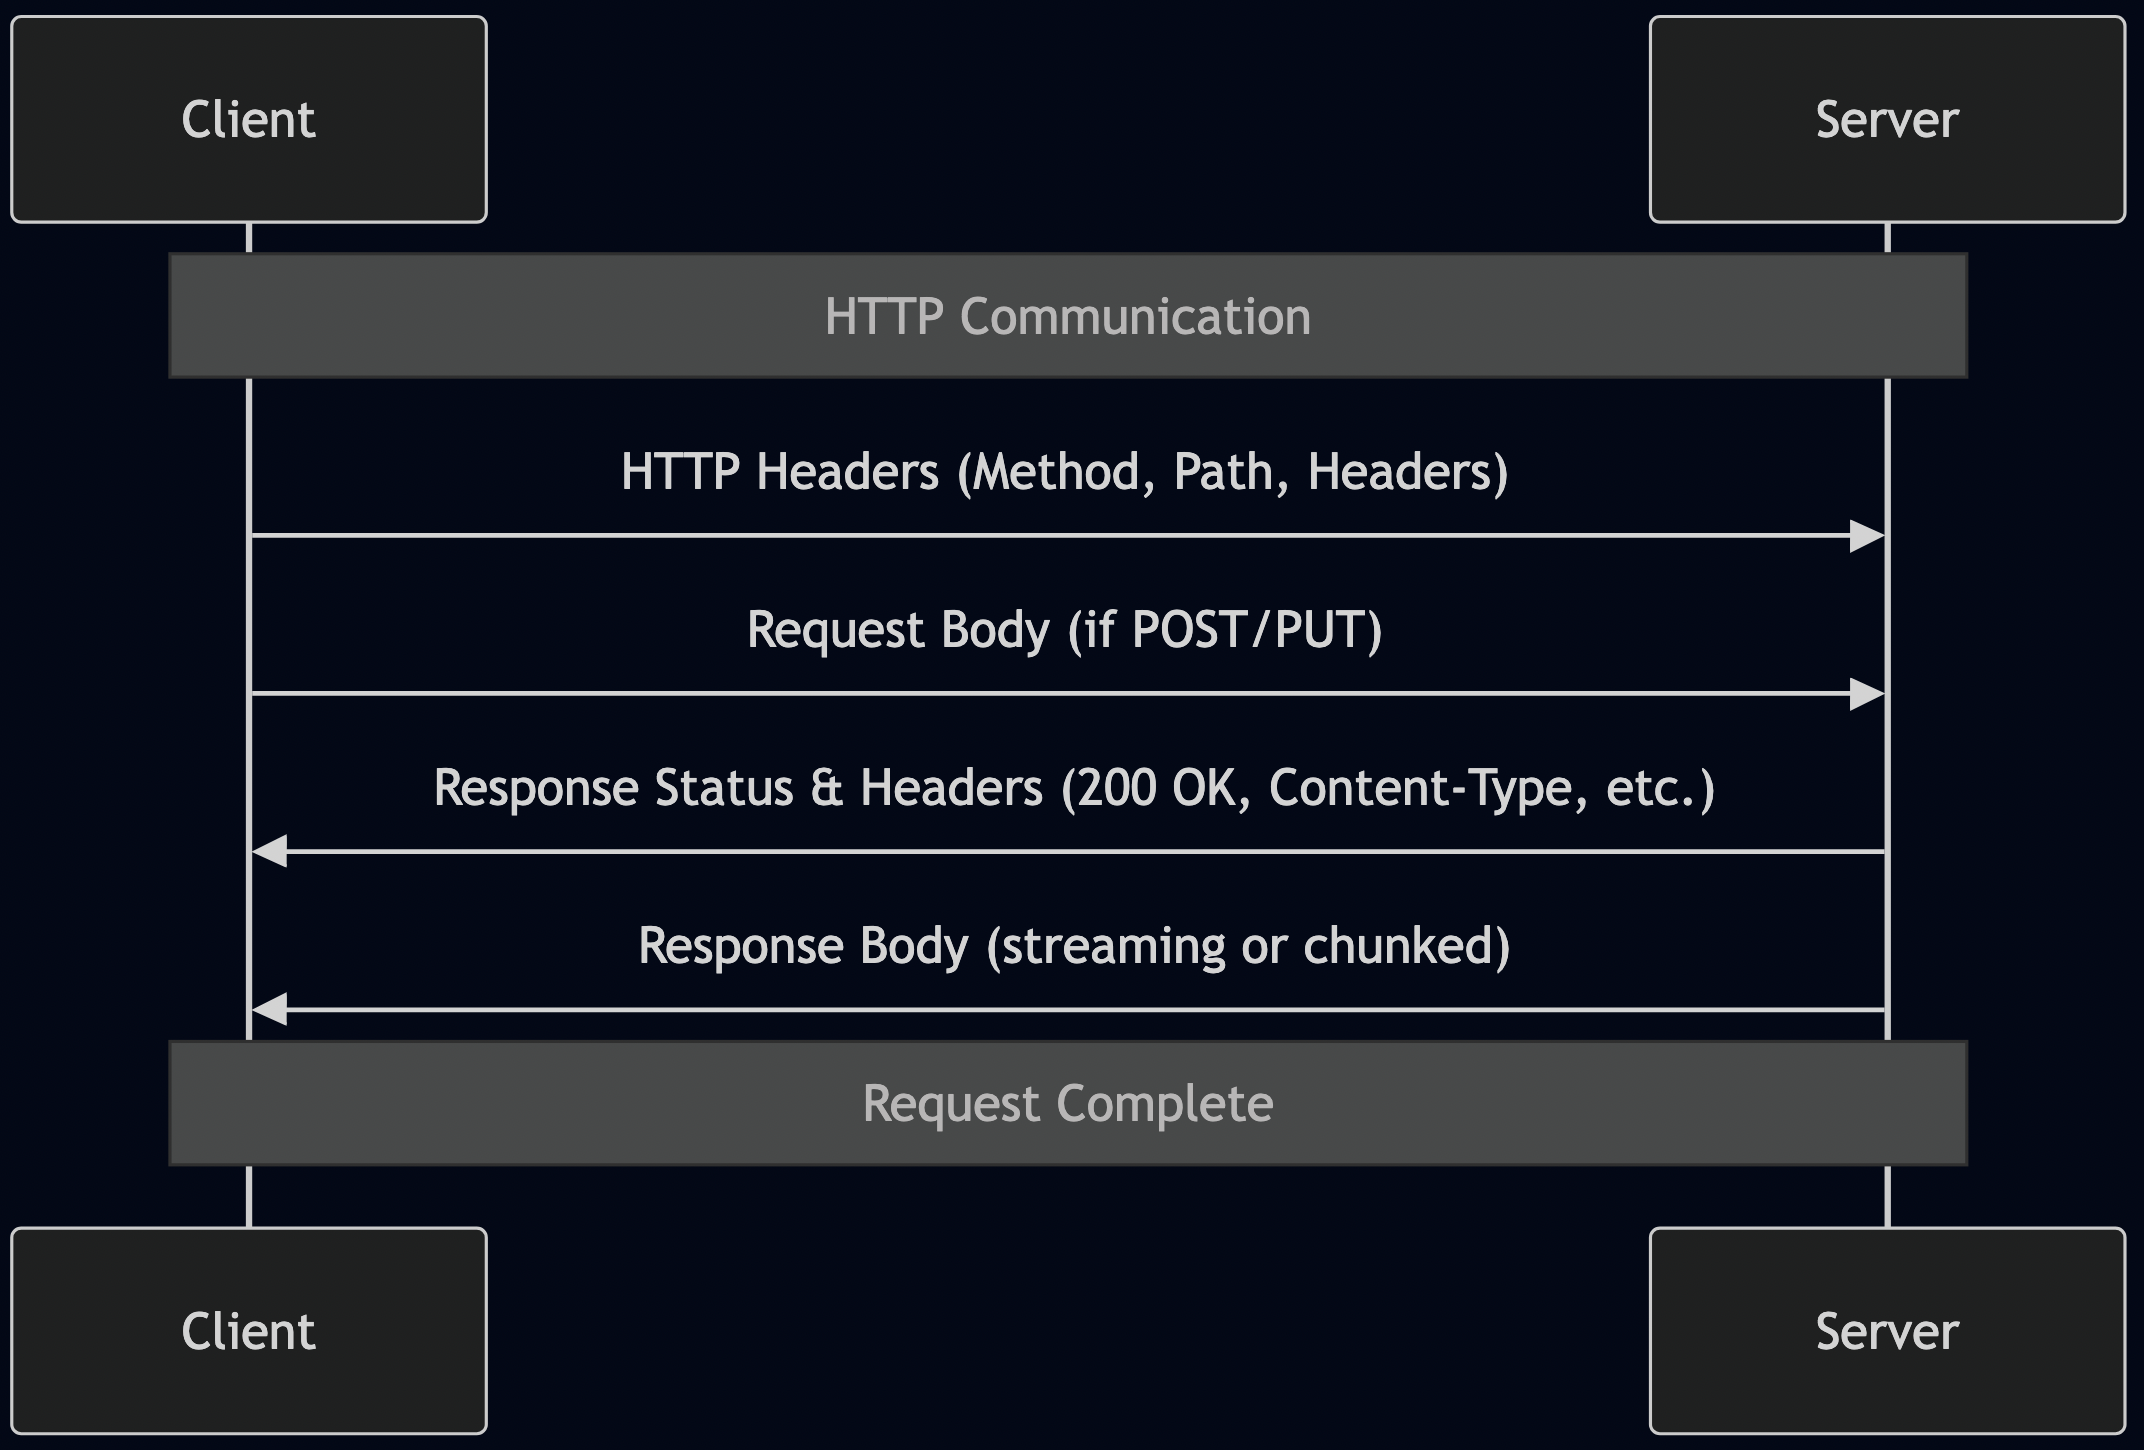
5. Connection Reuse or Teardown
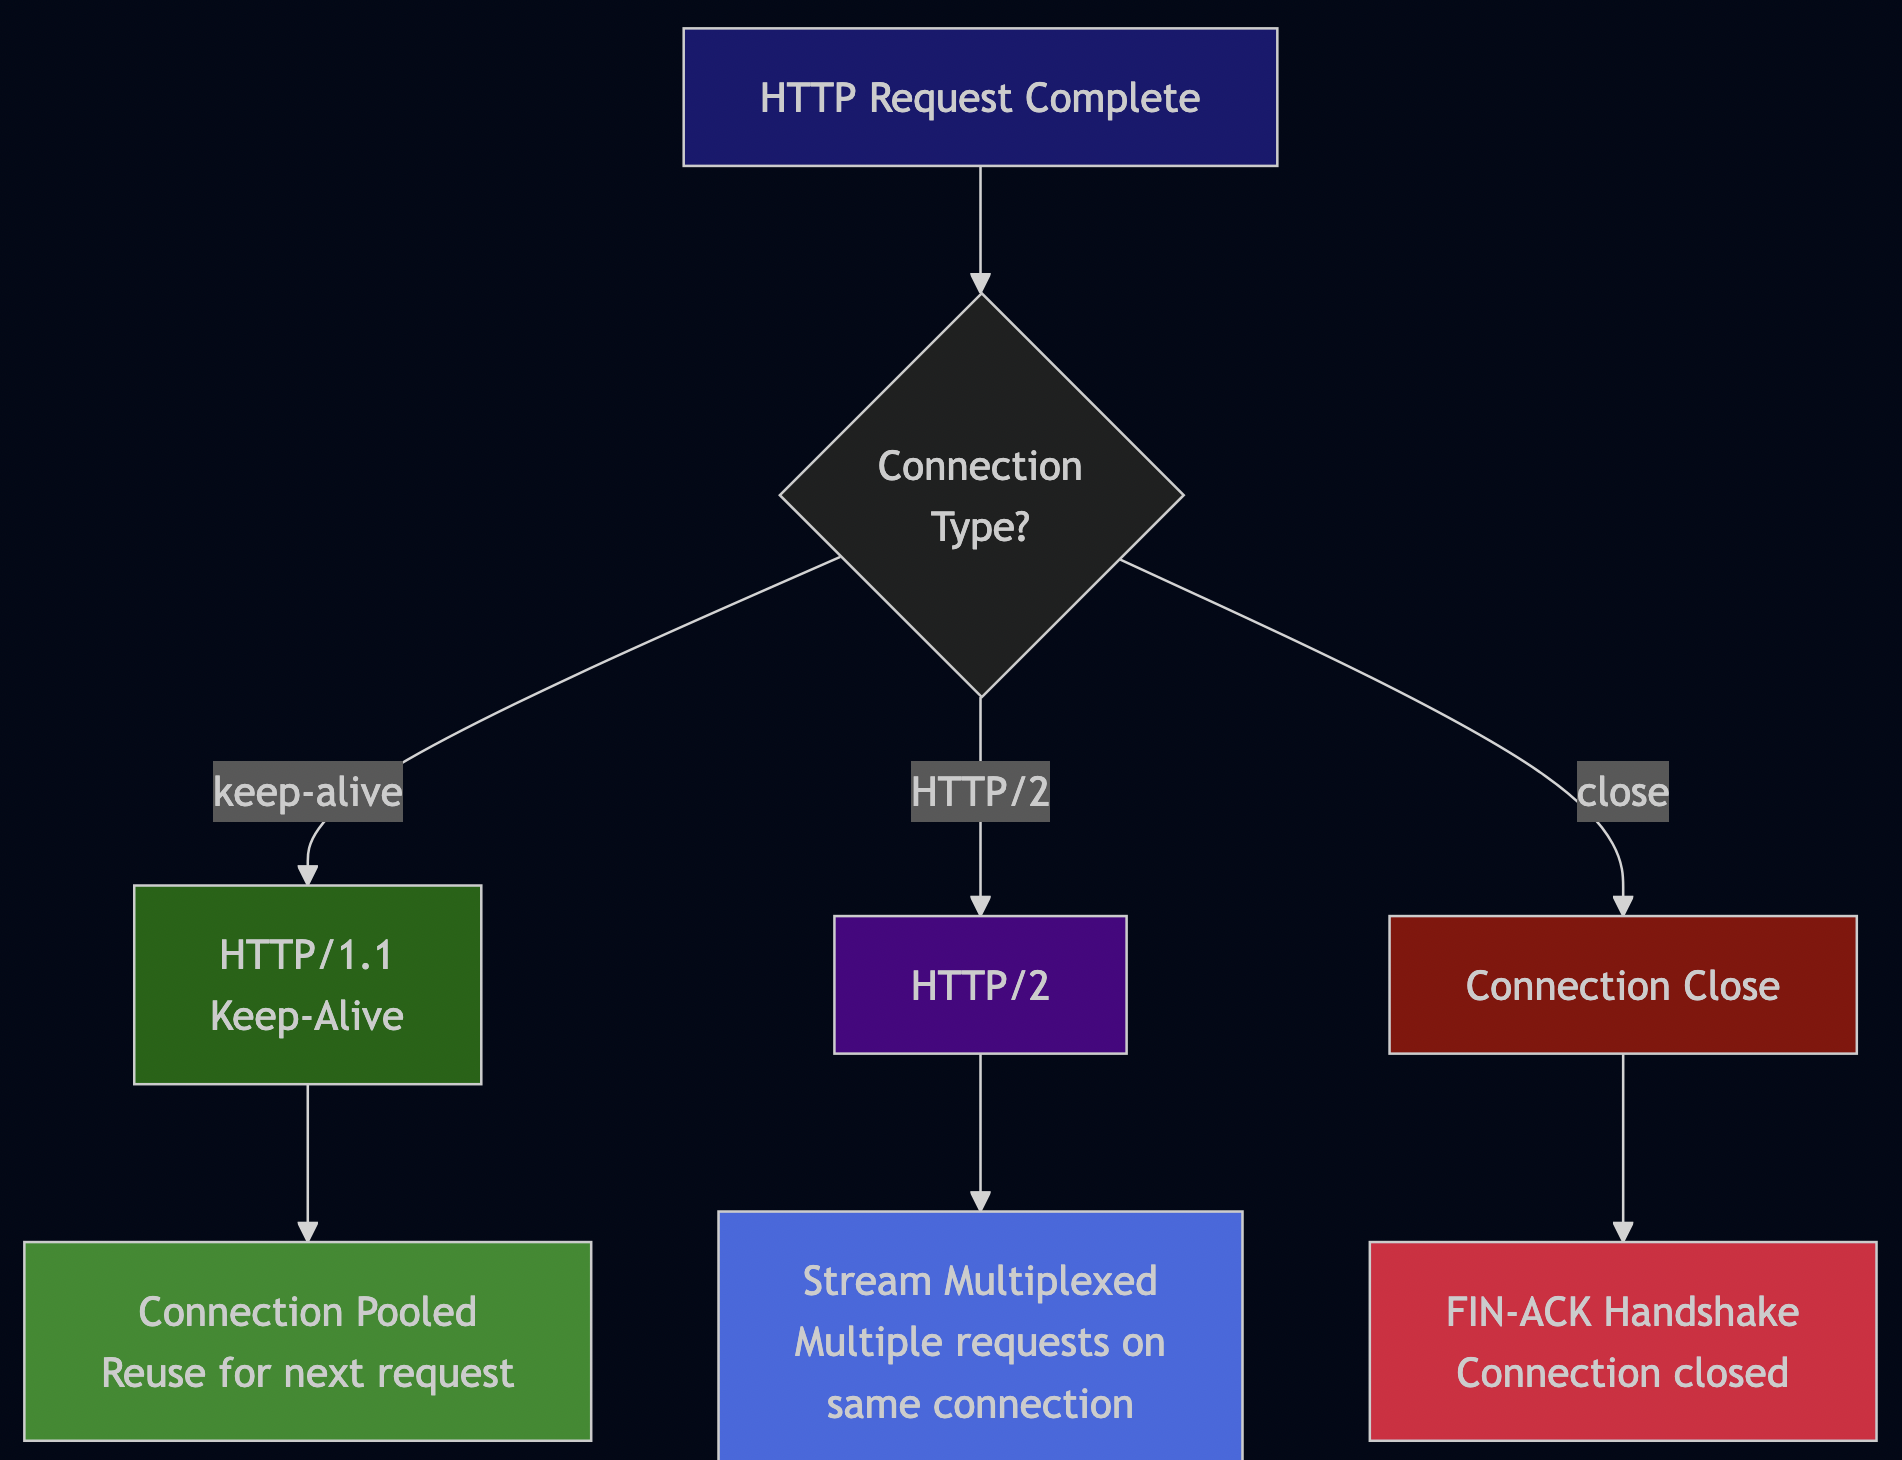
Total time for a “simple” API call: 100-500ms before your code even executes.
Now multiply this by your architecture:
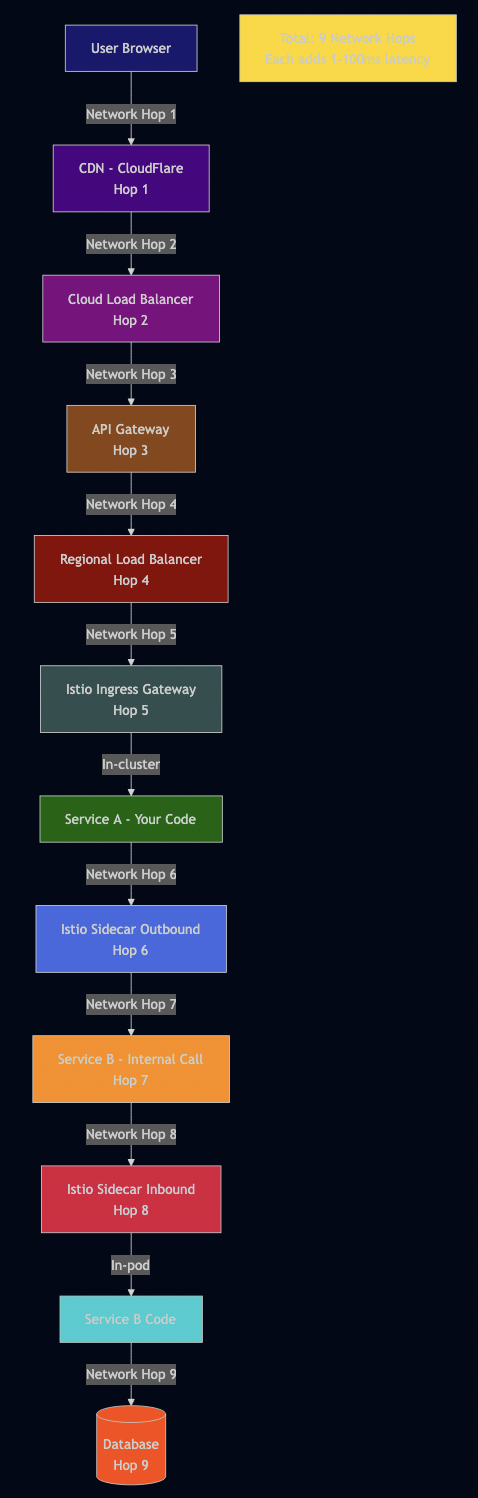
Nine network hops for what should be one database query.
Each hop adds:
- Latency: 1-10ms minimum per hop (P50), 10-100ms (P99)
- Failure probability: If each hop is 99.9% reliable, nine hops = 99.1% reliability
- Serialization overhead: JSON/Protobuf encoding/decoding at each boundary
- Authentication/authorization: Each service validates tokens
- Logging overhead: Each layer logs the request
- Monitoring overhead: Each layer emits metrics
- Retry logic: Each layer might retry on failure
Let me show you how this looks in Go code:
// Service A
func (s *ServiceA) ProcessOrder(ctx context.Context, orderID string) error {
    // Network hop 1: Call auth service
    authClient := pb.NewAuthServiceClient(s.authConn)
    authResp, err := authClient.ValidateToken(ctx, &pb.ValidateRequest{
        Token: getTokenFromContext(ctx),
    })
    if err != nil {
        return fmt.Errorf("auth failed: %w", err)
    }

    // Network hop 2: Call inventory service
    invClient := pb.NewInventoryServiceClient(s.inventoryConn)
    invResp, err := invClient.CheckStock(ctx, &pb.StockRequest{
        OrderID: orderID,
    })
    if err != nil {
        return fmt.Errorf("inventory check failed: %w", err)
    }

    // Network hop 3: Call payment service
    payClient := pb.NewPaymentServiceClient(s.paymentConn)
    payResp, err := payClient.ProcessPayment(ctx, &pb.PaymentRequest{
        OrderID: orderID,
        Amount:  invResp.TotalPrice,
    })
    if err != nil {
        return fmt.Errorf("payment failed: %w", err)
    }

    // Network hop 4: Save to database
    _, err = s.db.ExecContext(ctx,
        "INSERT INTO orders (id, status) VALUES (?, ?)",
        orderID, "completed",
    )
    if err != nil {
        return fmt.Errorf("database save failed: %w", err)
    }

    return nil
}

// Each of those function calls crosses multiple network boundaries:
// ServiceA ? Istio sidecar ? Istio ingress ? Target service ? Target's sidecar ? Target code
The Retry Storm
Here’s a real incident pattern I’ve debugged:
// API Gateway configuration
client := &http.Client{
    Timeout: 30 * time.Second,
    Transport: &retryTransport{
        maxRetries: 3,
        backoff:    100 * time.Millisecond,
    },
}

// Service A configuration
grpcClient := grpc.Dial(
    "service-b:50051",
    grpc.WithUnaryInterceptor(grpcretry.UnaryClientInterceptor(
        grpcretry.WithMax(2),
        grpcretry.WithBackoff(grpcretry.BackoffLinear(100*time.Millisecond)),
    )),
)

// Service B configuration
dbClient := &sql.DB{
    MaxOpenConns: 10,
    MaxIdleConns: 5,
}
// With retry logic in ORM
db.AutoMigrate(&User{}).
    Session(&gorm.Session{
        PrepareStmt: true,
        RetryOnConflict: 2,
    })
Here’s what happens:
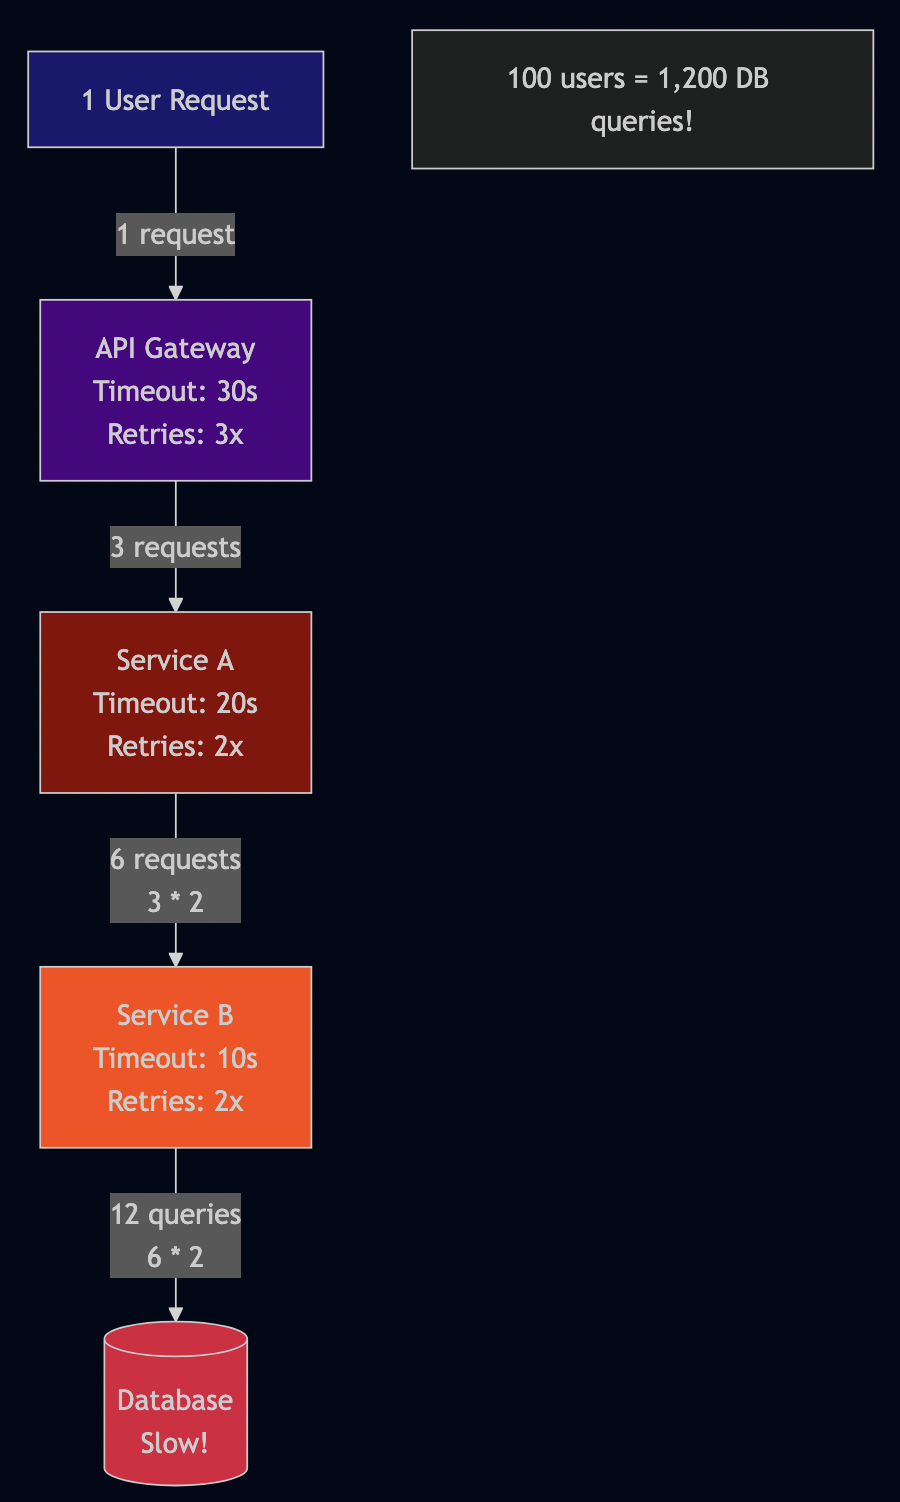
One user request became 12 database queries due to cascading retries.
If 100 users hit this endpoint simultaneously:
- API Gateway sees: 100 requests
- Service A sees: 300 requests (3x due to API gateway retries)
- Service B sees: 600 requests (2x more retries from Service A)
- Database sees: 1200 queries (2x more retries from Service B)
The database melts down, not from actual load, but from retry amplification.
The Latency Budget Illusion
Your SLA says “99% of requests under 500ms.” Let’s see how you spend that budget:
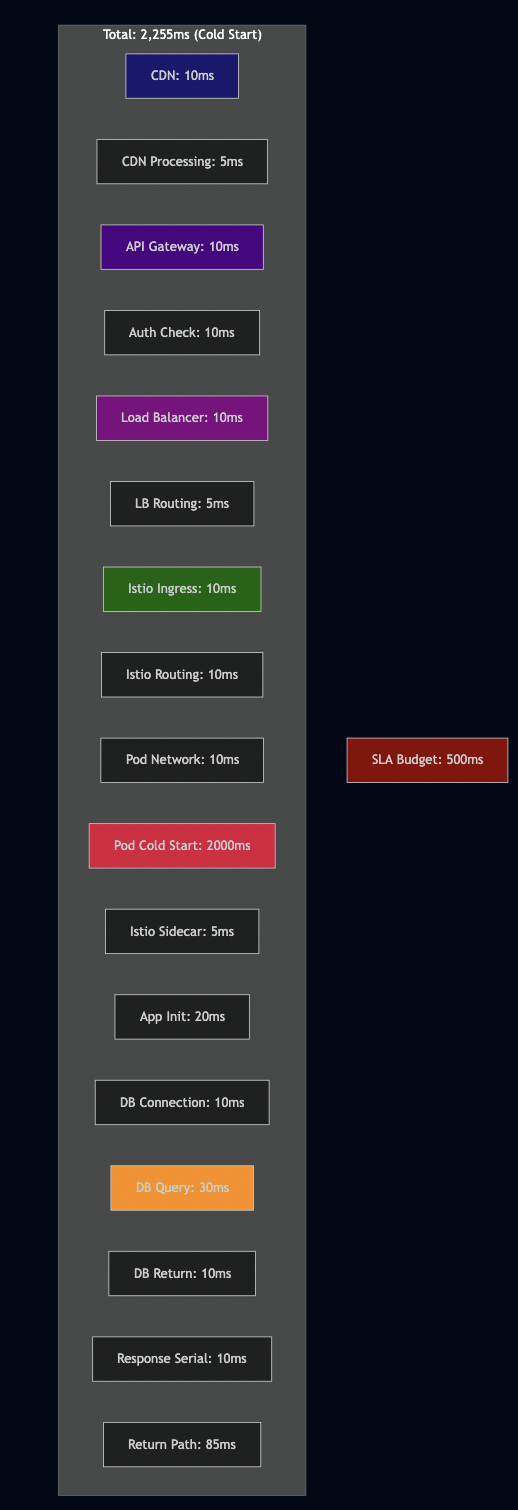
You’ve blown your latency budget before your code even runs if the pod is cold-starting.
This is why you see mysterious timeout patterns:
- First request after deployment: 2-3 seconds
- Next requests: 200-300ms
- After scaling up: Some pods hit, some miss (inconsistent latency)
The Debugging Multiplication
When something goes wrong, you need to check logs at every layer:
# 1. Check API Gateway logs
kubectl logs -n gateway api-gateway-7d8f9-xyz

# 2. Check Istio Ingress Gateway logs
kubectl logs -n istio-system istio-ingressgateway-abc123

# 3. Check your application pod logs
kubectl logs -n production user-service-8f7d6-xyz

# 4. Check Istio sidecar logs (same pod, different container)
kubectl logs -n production user-service-8f7d6-xyz -c istio-proxy

# 5. Check downstream service logs
kubectl logs -n production auth-service-5g4h3-def

# 6. Check downstream service's sidecar
kubectl logs -n production auth-service-5g4h3-def -c istio-proxy

# 7. Check database logs (if you have access)
# Usually in a different system entirely

# 8. Check cloud load balancer logs
# In AWS CloudWatch / GCP Cloud Logging / Azure Monitor

# 9. Check CDN logs
# In CloudFlare/Fastly/Akamai dashboard
You need access to 9+ different log sources. Each with:
- Different query syntaxes
- Different retention periods
- Different access controls
- Different time formats
- Different log levels
- Different structured logging formats
Now multiply this by the fact that logs aren’t synchronized—each system has clock drift. Correlating events requires:
// Propagating trace context through every layer
import (
    "go.opentelemetry.io/otel"
    "go.opentelemetry.io/otel/propagation"
    "go.opentelemetry.io/otel/trace"
)

func HandleRequest(w http.ResponseWriter, r *http.Request) {
    // Extract trace context from incoming request
    ctx := otel.GetTextMapPropagator().Extract(
        r.Context(),
        propagation.HeaderCarrier(r.Header),
    )

    // Start a new span
    tracer := otel.Tracer("user-service")
    ctx, span := tracer.Start(ctx, "HandleRequest")
    defer span.End()

    // Propagate to downstream calls
    req, _ := http.NewRequestWithContext(ctx, "GET", "http://auth-service/validate", nil)
    otel.GetTextMapPropagator().Inject(ctx, propagation.HeaderCarrier(req.Header))

    // Make the call
    resp, err := http.DefaultClient.Do(req)
    // ...
}
And this is just for distributed tracing. You also need:
- Request IDs (different from trace IDs)
- User IDs (for user-specific debugging)
- Session IDs (for session tracking)
- Correlation IDs (for async operations)
Each must be propagated through every layer, logged at every step, and indexed in your log aggregation system.
Logical vs Physical Layers: The Diagnosis Problem
There’s a critical distinction between logical abstraction (like modular code architecture) and physical abstraction (like network boundaries).
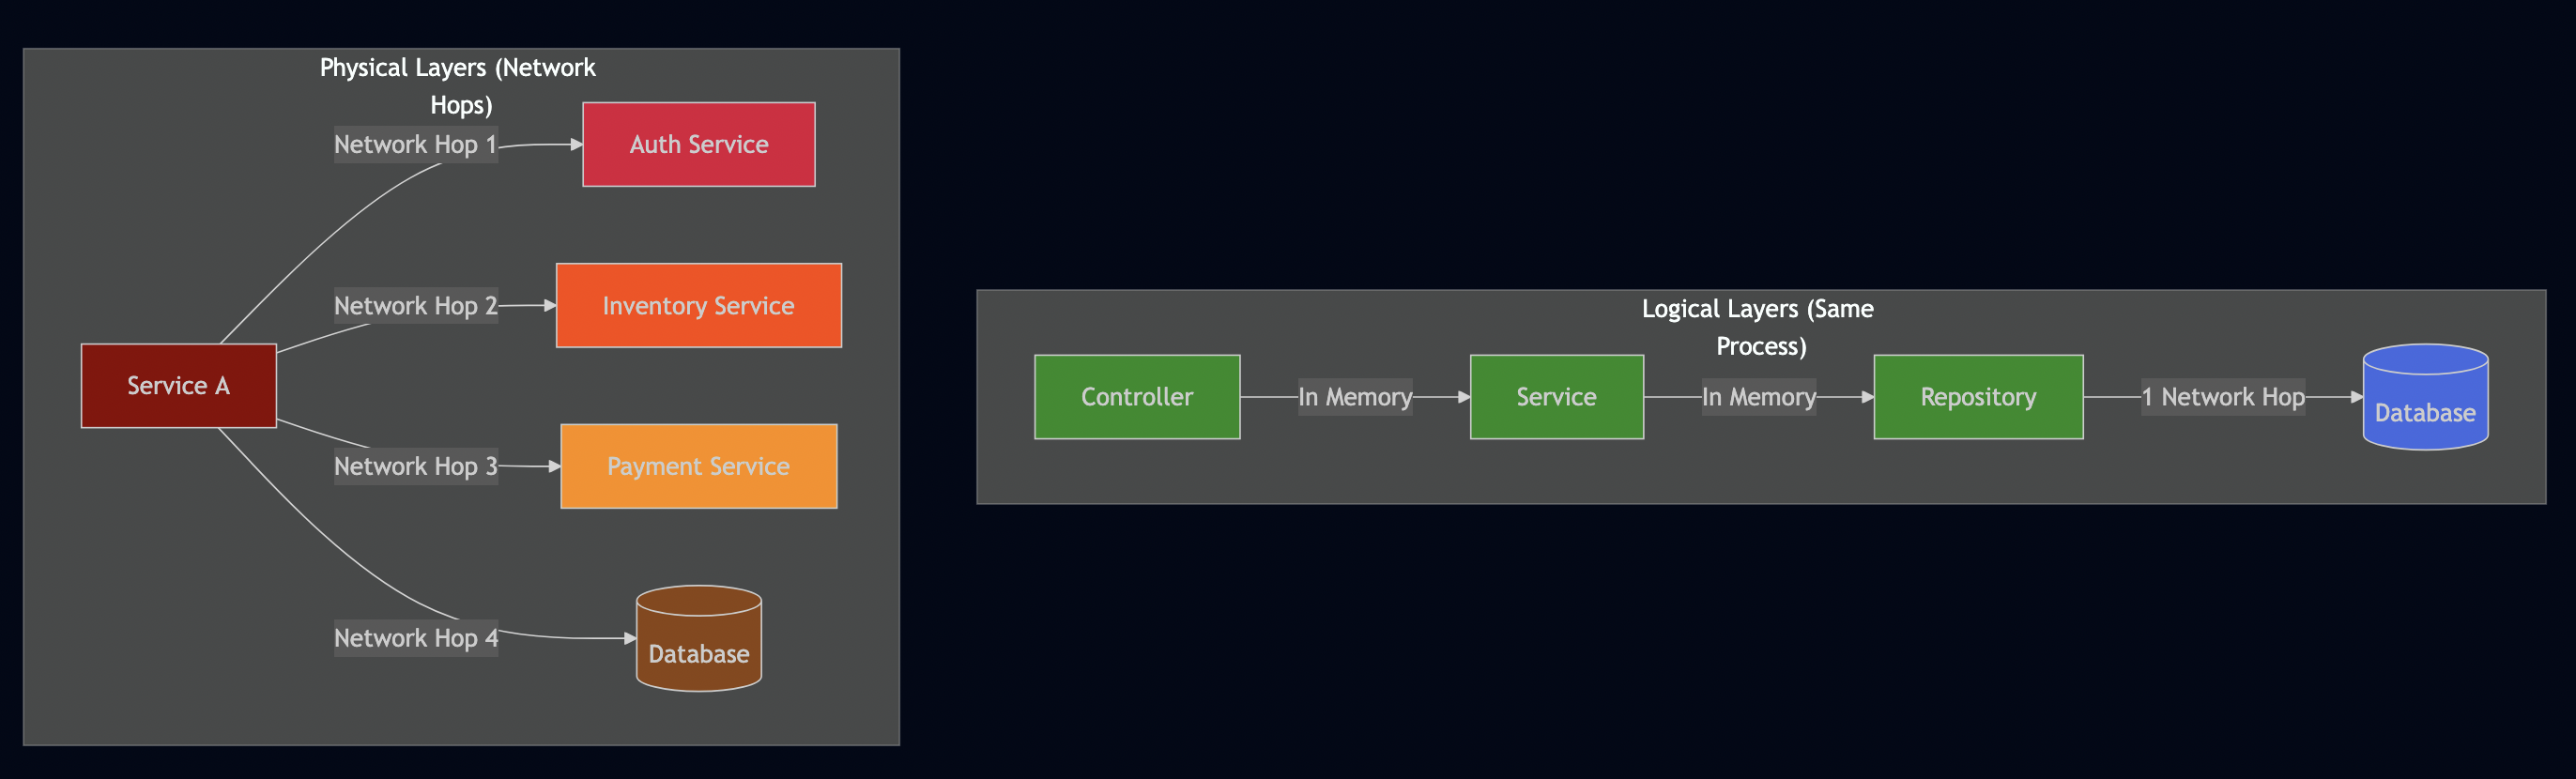
Logical layers add cognitive complexity but don’t add latency:
// Controller layer
func (c *UserController) GetUser(w http.ResponseWriter, r *http.Request) {
    userID := mux.Vars(r)["id"]
    user, err := c.service.GetUser(r.Context(), userID)
    if err != nil {
        http.Error(w, err.Error(), http.StatusInternalServerError)
        return
    }
    json.NewEncoder(w).Encode(user)
}

// Service layer
func (s *UserService) GetUser(ctx context.Context, id string) (*User, error) {
    return s.repo.FindByID(ctx, id)
}

// Repository layer
func (r *UserRepository) FindByID(ctx context.Context, id string) (*User, error) {
    var user User
    err := r.db.GetContext(ctx, &user, "SELECT * FROM users WHERE id = ?", id)
    return &user, err
}
This is three logical layers (Controller ? Service ? Repository) but zero network hops. Everything runs in the same process. Debugging is straightforward—add breakpoints or log statements.
Physical layers add both complexity AND latency:
// Service A
func (s *ServiceA) ProcessOrder(ctx context.Context, orderID string) error {
    // Physical layer 1: Network call to auth service
    if err := s.authClient.Validate(ctx); err != nil {
        return err
    }

    // Physical layer 2: Network call to inventory service
    items, err := s.inventoryClient.GetItems(ctx, orderID)
    if err != nil {
        return err
    }

    // Physical layer 3: Network call to payment service
    if err := s.paymentClient.Charge(ctx, items.Total); err != nil {
        return err
    }

    // Physical layer 4: Network call to database
    return s.db.SaveOrder(ctx, orderID)
}
Each physical layer adds:
- Network latency: 1-100ms per call
- Network failures: timeouts, connection refused, DNS failures
- Serialization: Marshal/unmarshal data (CPU + memory)
- Authentication: Validate tokens/certificates
- Observability overhead: Logging, metrics, tracing
When I started my career, debugging meant checking if the database query was slow. Now it means:
- Check if the request reached the API gateway (CloudWatch logs, different AWS account)
- Check if authentication passed (Auth service logs, different namespace)
- Check if rate limiting triggered (API gateway metrics)
- Check if the service mesh routed correctly (Istio access logs)
- Check if Kubernetes readiness probes passed (kubectl events)
- Check if the application pod received the request (app logs, may be on a different node)
- Check if the sidecar proxy was ready (istio-proxy logs)
- Check if downstream services responded (distributed tracing in Jaeger)
- Check database query performance (database slow query log)
- Finally check if your actual code has a bug (pprof, debugging)
My professor back in college taught us to use binary search for debugging—cut the problem space in half with each test. But when you have 10+ layers, you can’t easily bisect. You need:
- Centralized log aggregation (ELK, Splunk, Loki)
- Distributed tracing with correlation IDs (Jaeger, Zipkin)
- Service mesh observability (Kiali, Grafana)
- APM (Application Performance Monitoring) tools (Datadog, New Relic)
- Kubernetes event logging
- Network traffic analysis (Wireshark, tcpdump)
And this is for a service that just saves data to a database.
The Dependency Explosion: Transitive Complexity

The Go Modules Reality
There’s a famous joke that node_modules is the heaviest object in the universe. Go modules are lighter, but the problem persists:
$ go mod init myapp
$ go get github.com/gin-gonic/gin
$ go get gorm.io/gorm
$ go get gorm.io/driver/postgres
$ go get go.uber.org/zap
$ go get github.com/spf13/viper

$ go mod graph | wc -l
247

$ go list -m all
myapp
github.com/gin-gonic/gin v1.9.1
github.com/gin-contrib/sse v0.1.0
github.com/go-playground/validator/v10 v10.14.0
github.com/goccy/go-json v0.10.2
github.com/json-iterator/go v1.1.12
github.com/mattn/go-isatty v0.0.19
github.com/pelletier/go-toml/v2 v2.0.8
github.com/ugorji/go/codec v1.2.11
golang.org/x/net v0.10.0
golang.org/x/sys v0.8.0
golang.org/x/text v0.9.0
google.golang.org/protobuf v1.30.0
gopkg.in/yaml.v3 v3.0.1
... (234 more)
247 dependencies for a “simple” web service.
Let’s visualize what you’re actually depending on:
myapp
|-- github.com/gin-gonic/gin v1.9.1
|   |-- github.com/gin-contrib/sse v0.1.0
|   |-- github.com/go-playground/validator/v10 v10.14.0
|   |   |-- github.com/go-playground/universal-translator v0.18.1
|   |   |-- github.com/leodido/go-urn v1.2.4
|   |   +-- golang.org/x/crypto v0.9.0
|   |-- github.com/goccy/go-json v0.10.2
|   |-- github.com/json-iterator/go v1.1.12
|   |   |-- github.com/modern-go/concurrent v0.0.0-20180306012644-bacd9c7ef1dd
|   |   +-- github.com/modern-go/reflect2 v1.0.2
|   +-- ... (15 more)
|-- gorm.io/gorm v1.25.2
|   |-- github.com/jinzhu/inflection v1.0.0
|   |-- github.com/jinzhu/now v1.1.5
|   +-- ... (8 more)
|-- gorm.io/driver/postgres v1.5.2
|   |-- github.com/jackc/pgx/v5 v5.3.1
|   |   |-- github.com/jackc/pgpassfile v1.0.0
|   |   |-- github.com/jackc/pgservicefile v0.0.0-20221227161230-091c0ba34f0a
|   |   +-- ... (12 more)
|   +-- ... (5 more)
+-- ... (200+ more)

Total unique packages: 247
The Update Nightmare
Now imagine you need to update one dependency:
$ go get -u github.com/gin-gonic/gin

go: github.com/gin-gonic/gin@v1.10.0 requires
    github.com/go-playground/validator/v10@v10.16.0 requires
        golang.org/x/crypto@v0.15.0 requires
            golang.org/x/sys@v0.14.0

go: myapp@v0.0.0 requires
    github.com/some-old-package@v1.2.3 requires
        golang.org/x/sys@v0.8.0

go: github.com/some-old-package@v1.2.3 is incompatible with golang.org/x/sys@v0.14.0
Translation: “One of your dependencies requires an older version of golang.org/x/sys that’s incompatible with what Gin needs. You’re stuck until some-old-package updates.”
Your options:
- Don’t upgrade (stay vulnerable to any security issues)
- Fork
some-old-packageand update it yourself - Find an alternative library (and rewrite code)
- Use
replacedirective in go.mod (and hope nothing breaks)
// go.mod
module myapp

go 1.21

require (
    github.com/gin-gonic/gin v1.10.0
    github.com/some-old-package v1.2.3
)

// Force using compatible version (dangerous)
replace github.com/some-old-package => github.com/some-old-package v1.2.4-compatible
The Supply Chain Attack Surface
Every dependency is a potential security vulnerability:
Real incidents in the Go ecosystem:
- github.com/golang/protobuf: Multiple CVEs requiring version updates
- golang.org/x/crypto: SSH vulnerabilities requiring immediate patches
- golang.org/x/net/http2: HTTP/2 rapid reset attack (CVE-2023-39325)
- github.com/docker/docker: Container escape vulnerabilities
- Compromised GitHub accounts: Attackers gaining access to maintainer accounts
The attack vectors:
- Direct compromise: Attacker gains push access to repository
- Typosquatting: Package named
github.com/gin-gonig/ginvsgithub.com/gin-gonic/gin - Dependency confusion: Internal package name conflicts with public one
- Transitive attacks: Compromise a dependency of a popular package
- Maintainer burnout: Unmaintained packages become vulnerable over time
Let’s say you’re using this Go code:
import (
    "github.com/gin-gonic/gin"
    _ "github.com/lib/pq"  // PostgreSQL driver
    "gorm.io/gorm"
)
You’re trusting:
- The Gin framework maintainers (and their 15 dependencies)
- The PostgreSQL driver maintainers
- The GORM maintainers (and their 8 dependencies)
- All their transitive dependencies (200+ packages)
- The Go standard library maintainers
- The Go module proxy (proxy.golang.org)
- GitHub’s infrastructure
- Your company’s internal proxy/mirror
- The TLS certificate authorities
Any of these could be compromised, introducing malicious code into your application.
The Compatibility Matrix from Hell
Dependency upgrades create cascading nightmares. Upgrading Go from 1.20 to 1.21 means checking all 247 transitive dependencies for compatibility—their go.mod files, CI configs, and issue trackers. Inevitably, conflicts emerge: Package A supports Go 1.18-1.21, but Package B only works with 1.16-1.19 and hasn’t been updated in two years. Package C requires golang.org/x/sys v0.8.0, but Package A needs v0.14.0. Your simple upgrade becomes a multi-day investigation of what to fork, replace, or rewrite.
I’ve seen this pattern repeatedly: upgrading one dependency triggers a domino effect. A security patch in a logging library forces an HTTP framework update, which needs a new database driver, which conflicts with your metrics library. Each brings breaking API changes requiring code modifications.
You can’t ignore these updates. When a critical CVE drops, you have hours to patch. But that “simple” security fix might be incompatible with your stack, forcing emergency upgrades across everything while production is vulnerable.
The maintenance cost is relentless. Teams spend 20-30% of development time managing dependencies—reviewing Dependabot PRs, testing compatibility, fixing breaking changes. It’s a treadmill you can never leave. The alternative—pinning versions and ignoring updates—accumulates technical debt requiring eventual massive, risky “dependency catch-up” projects.
Every imported package adds to an ever-growing compatibility matrix that no human can fully comprehend. Each combination potentially has different bugs or incompatibilities—multiply this across Go versions, architectures (amd64/arm64), operating systems, CGO settings, race detector modes, and build tags.
The Continuous Vulnerability Treadmill
Using Dependabot or similar tools:
Week 1:
- 3 security vulnerabilities found
- Update github.com/gin-gonic/gin
- Update golang.org/x/net
- Update golang.org/x/crypto

Week 2:
- 2 new security vulnerabilities found
- Update gorm.io/gorm
- Update github.com/lib/pq

Week 3:
- 5 new security vulnerabilities found
- Update breaks API compatibility
- Spend 2 days fixing breaking changes
- Deploy, monitor, rollback, fix, deploy again

Week 4:
- 4 new security vulnerabilities found
- Team exhausted from constant updates
- Security team pressuring for compliance
- Product team pressuring for features
This never ends. The security treadmill is a permanent feature of modern software development.
I’ve seen teams that:
- Spend 30% of development time updating dependencies
- Have dozens of open Dependabot PRs that no one reviews
- Pin all versions and ignore security updates (dangerous)
- Create “update weeks” where the entire team does nothing but update dependencies
The Observability Complexity Tax
To manage all this complexity, we added… more complexity.
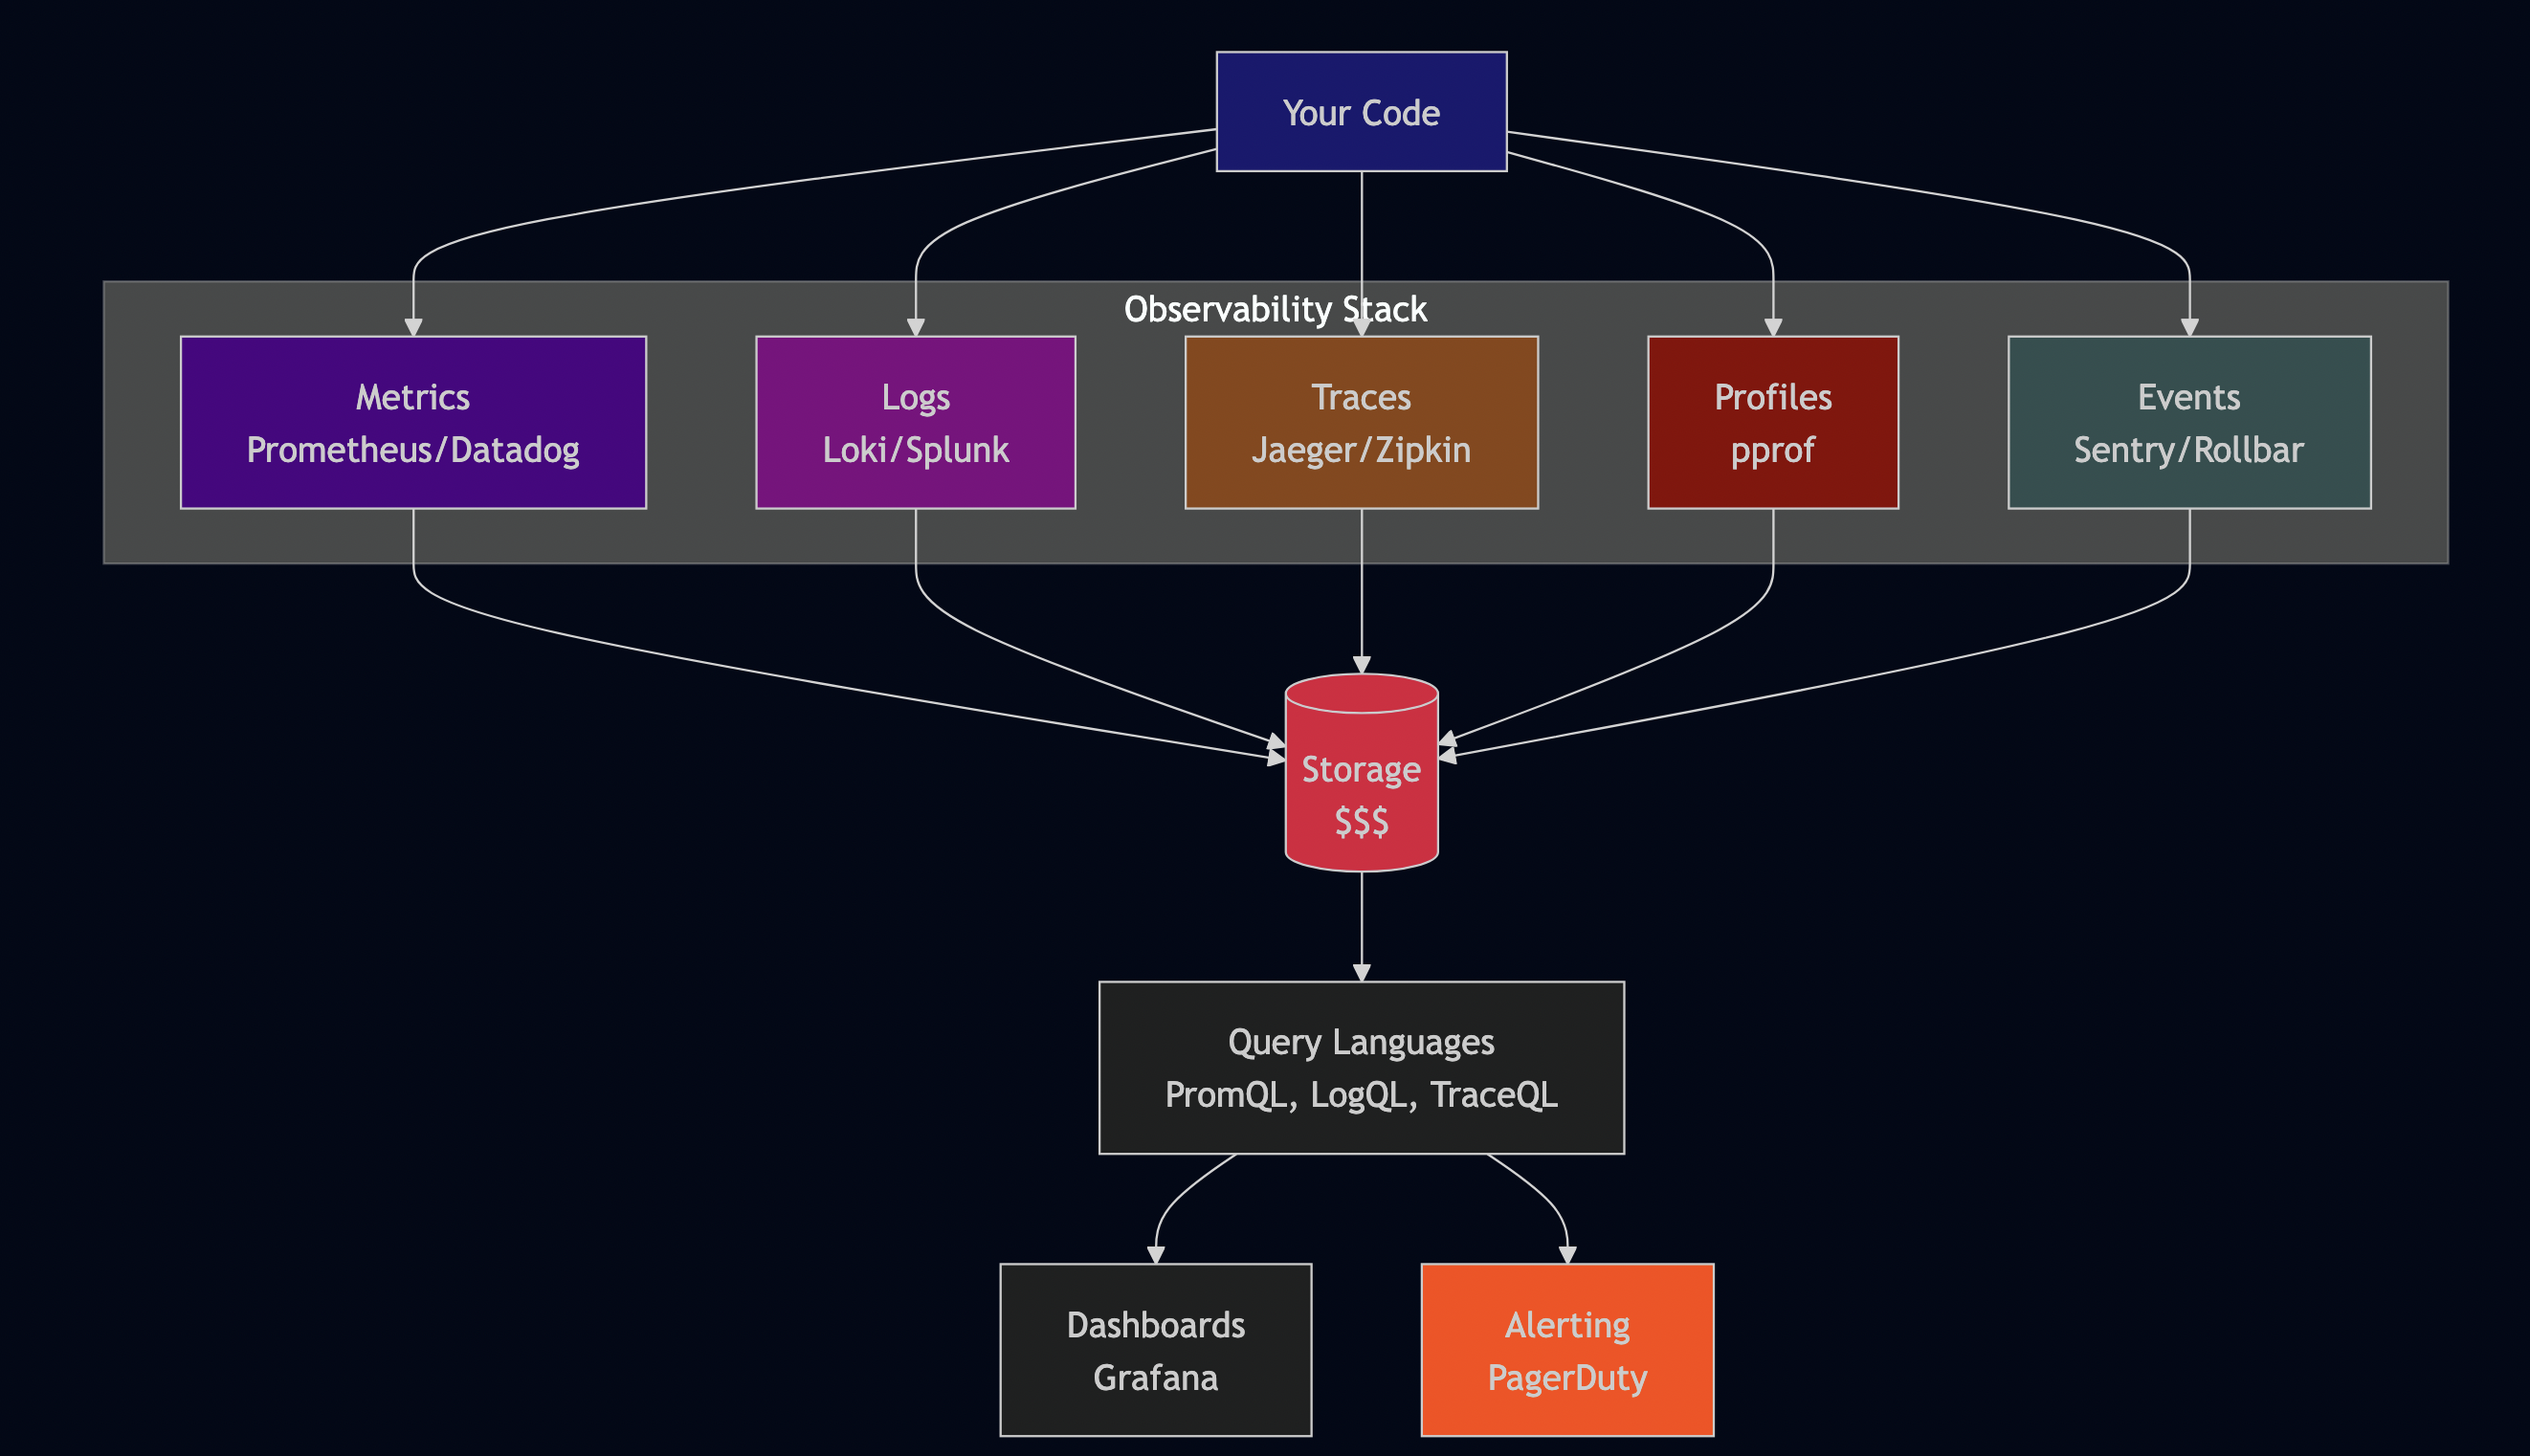
The Three Pillars (That Became Five)
The observability industry says you need:
- Metrics (Prometheus, Datadog, CloudWatch)
- Logs (ELK stack, Loki, Splunk)
- Traces (Jaeger, Zipkin, Tempo)
- Profiles (pprof, continuous profiling)
- Events (error tracking, alerting)
Each requires:
- Installation (agents, sidecars, instrumentation)
- Configuration (what to collect, retention, sampling)
- Integration (SDK, auto-instrumentation, manual instrumentation)
- Storage (expensive, grows infinitely)
- Querying (learning PromQL, LogQL, TraceQL)
- Alerting (thresholds, routing, escalation)
- Cost management (easily $10K-$100K+ per month)
The Instrumentation Tax
To get observability, you instrument your code:
import (
    "go.opentelemetry.io/otel"
    "go.opentelemetry.io/otel/attribute"
    "go.opentelemetry.io/otel/codes"
    "go.opentelemetry.io/otel/trace"
    "go.uber.org/zap"
)

func (s *OrderService) ProcessOrder(ctx context.Context, order *Order) error {
    // Start tracing span
    tracer := otel.Tracer("order-service")
    ctx, span := tracer.Start(ctx, "ProcessOrder",
        trace.WithAttributes(
            attribute.String("order.id", order.ID),
            attribute.Float64("order.total", order.Total),
            attribute.String("user.id", order.UserID),
        ),
    )
    defer span.End()

    // Log the start
    s.logger.Info("Processing order",
        zap.String("order_id", order.ID),
        zap.Float64("total", order.Total),
        zap.String("user_id", order.UserID),
    )

    // Increment metric
    s.metrics.OrdersProcessed.Inc()

    // Start timer for duration metric
    timer := s.metrics.OrderProcessingDuration.Start()
    defer timer.ObserveDuration()

    // === Actual business logic starts here ===

    // Validate order (with nested span)
    ctx, validateSpan := tracer.Start(ctx, "ValidateOrder")
    if err := s.validator.Validate(ctx, order); err != nil {
        validateSpan.SetStatus(codes.Error, err.Error())
        validateSpan.RecordError(err)
        validateSpan.End()

        s.logger.Error("Order validation failed",
            zap.String("order_id", order.ID),
            zap.Error(err),
        )
        s.metrics.OrderValidationFailures.Inc()

        span.SetStatus(codes.Error, err.Error())
        span.RecordError(err)
        return fmt.Errorf("validation failed: %w", err)
    }
    validateSpan.End()

    // Process payment (with nested span)
    ctx, paymentSpan := tracer.Start(ctx, "ProcessPayment",
        trace.WithAttributes(
            attribute.Float64("payment.amount", order.Total),
        ),
    )
    if err := s.paymentClient.Charge(ctx, order.Total); err != nil {
        paymentSpan.SetStatus(codes.Error, err.Error())
        paymentSpan.RecordError(err)
        paymentSpan.End()

        s.logger.Error("Payment processing failed",
            zap.String("order_id", order.ID),
            zap.Float64("amount", order.Total),
            zap.Error(err),
        )
        s.metrics.PaymentFailures.Inc()

        span.SetStatus(codes.Error, err.Error())
        span.RecordError(err)
        return fmt.Errorf("payment failed: %w", err)
    }
    paymentSpan.End()

    // Update inventory (with nested span)
    ctx, inventorySpan := tracer.Start(ctx, "UpdateInventory")
    if err := s.inventoryClient.Reserve(ctx, order.Items); err != nil {
        inventorySpan.SetStatus(codes.Error, err.Error())
        inventorySpan.RecordError(err)
        inventorySpan.End()

        s.logger.Error("Inventory update failed",
            zap.String("order_id", order.ID),
            zap.Error(err),
        )
        s.metrics.InventoryFailures.Inc()

        span.SetStatus(codes.Error, err.Error())
        span.RecordError(err)

        // Compensating transaction: refund payment
        if refundErr := s.paymentClient.Refund(ctx, order.Total); refundErr != nil {
            s.logger.Error("Refund failed during compensation",
                zap.String("order_id", order.ID),
                zap.Error(refundErr),
            )
        }

        return fmt.Errorf("inventory failed: %w", err)
    }
    inventorySpan.End()

    // === Actual business logic ends here ===

    // Log success
    s.logger.Info("Order processed successfully",
        zap.String("order_id", order.ID),
    )

    // Record metrics
    s.metrics.OrdersSuccessful.Inc()
    s.metrics.OrderValue.Observe(order.Total)

    // Set span status
    span.SetStatus(codes.Ok, "Order processed")

    return nil
}
Count the instrumentation code vs business logic:
- Lines of business logic: ~15
- Lines of instrumentation: ~85
- Ratio: 1:5.6
Instrumentation code is 5.6x larger than business logic. And this is a simplified example. Real production code has:
- Metrics collection (counters, gauges, histograms)
- Structured logging (with correlation IDs, user IDs, session IDs)
- Custom span attributes
- Error tracking integration
- Performance profiling
- Security audit logging
The business logic disappears in the observability boilerplate.
Compare this to how I wrote code in the 1990s:
// C code from 1995
int process_order(Order *order) {
    if (!validate_order(order)) {
        return ERROR_VALIDATION;
    }

    if (!charge_payment(order->total)) {
        return ERROR_PAYMENT;
    }

    if (!update_inventory(order->items)) {
        refund_payment(order->total);
        return ERROR_INVENTORY;
    }

    return SUCCESS;
}
12 lines. No instrumentation. Easy to understand. When something went wrong, you looked at error codes and maybe some log files.
Was it harder to debug? Sometimes. But the code was simpler, and the system had fewer moving parts.
The Path Forward: Pragmatic Abstraction
I’m not suggesting we abandon abstraction and return to writing assembly language. But we need to apply abstraction more judiciously:
1. Start Concrete, Refactor to Abstract
Follow the Rule of Three: write it once, write it twice, refactor on the third time. This ensures your abstraction is based on actual patterns, not speculative ones.
// First time: Write it directly
func GetUser(db *sql.DB, userID string) (*User, error) {
    var user User
    err := db.QueryRow(
        "SELECT id, name, email FROM users WHERE id = ?",
        userID,
    ).Scan(&user.ID, &user.Name, &user.Email)
    return &user, err
}

// Second time: Still write it directly
func GetOrder(db *sql.DB, orderID string) (*Order, error) {
    var order Order
    err := db.QueryRow(
        "SELECT id, user_id, total FROM orders WHERE id = ?",
        orderID,
    ).Scan(&order.ID, &order.UserID, &order.Total)
    return &order, err
}

// Third time: Now abstract
type Repository struct {
    db *sql.DB
}

func (r *Repository) QueryRow(ctx context.Context, dest interface{}, query string, args ...interface{}) error {
    // Common query logic
    return r.db.QueryRowContext(ctx, query, args...).Scan(dest)
}

// Now use the abstraction
func (r *Repository) GetUser(ctx context.Context, userID string) (*User, error) {
    var user User
    err := r.QueryRow(ctx, &user,
        "SELECT id, name, email FROM users WHERE id = ?",
        userID,
    )
    return &user, err
}
2. Minimize Physical Layers
Do you really need a service mesh for 5 services? Do you really need an API gateway when your load balancer can handle routing? Each physical layer should justify its existence with a clear, measurable benefit.
Questions to ask:
- What problem does this layer solve?
- Can we solve it with a logical layer instead?
- What’s the latency cost?
- What’s the operational complexity cost?
- What’s the debugging cost?
3. Make Abstractions Observable
Every abstraction layer should provide visibility into what it’s doing:
// Bad: Black box
func (s *Service) ProcessData(data []byte) error {
    return s.processor.Process(data)
}

// Good: Observable
func (s *Service) ProcessData(ctx context.Context, data []byte) error {
    start := time.Now()
    defer func() {
        s.metrics.ProcessingDuration.Observe(time.Since(start).Seconds())
    }()

    s.logger.Debug("Processing data",
        zap.Int("size", len(data)),
    )

    if err := s.processor.Process(ctx, data); err != nil {
        s.logger.Error("Processing failed",
            zap.Error(err),
            zap.Int("size", len(data)),
        )
        s.metrics.ProcessingFailures.Inc()
        return fmt.Errorf("processing failed: %w", err)
    }

    s.metrics.ProcessingSuccesses.Inc()
    s.logger.Info("Processing completed",
        zap.Int("size", len(data)),
        zap.Duration("duration", time.Since(start)),
    )

    return nil
}
4. Coordination by Convention
Instead of requiring developers to manually configure 6+ timeout values, provide templates that are correct by default:
// Bad: Manual configuration
type ServerConfig struct {
    ReadTimeout              time.Duration
    WriteTimeout             time.Duration
    IdleTimeout              time.Duration
    ShutdownTimeout          time.Duration
    KubernetesGracePeriod    time.Duration
    IstioTerminationDrain    time.Duration
    PreStopDelay             time.Duration
}

// Good: Convention-based
type ServerConfig struct {
    // Single source of truth
    GracefulShutdownSeconds int // Default: 45
}

func (c *ServerConfig) Defaults() {
    if c.GracefulShutdownSeconds == 0 {
        c.GracefulShutdownSeconds = 45
    }
}

func (c *ServerConfig) KubernetesGracePeriod() int {
    // Calculated: shutdown + buffer
    return c.GracefulShutdownSeconds + 20
}

func (c *ServerConfig) IstioTerminationDrain() int {
    // Same as graceful shutdown
    return c.GracefulShutdownSeconds
}

func (c *ServerConfig) PreStopDelay() int {
    // Fixed value for LB updates
    return 15
}

func (c *ServerConfig) ApplicationShutdownTimeout() time.Duration {
    // Calculated: grace period - prestop - buffer
    return time.Duration(c.GracefulShutdownSeconds-5) * time.Second
}
5. Invest in Developer Experience
The complexity tax is paid in developer hours. Make it easier:
// Bad: Complex local setup
// 1. Install Docker
// 2. Install Kubernetes (minikube/kind)
// 3. Install Istio
// 4. Configure service mesh
// 5. Deploy database
// 6. Deploy auth service
// 7. Deploy your service
// 8. Configure networking
// 9. Finally, test your code

// Good: One command
$ make dev
# Starts all dependencies with docker-compose
# Configures everything automatically
# Provides real-time logs
# Hot-reloads on code changes
Makefile:
.PHONY: dev
dev:
	docker-compose up -d postgres redis
	go run cmd/server/main.go

.PHONY: test
test:
	go test -v ./...

.PHONY: lint
lint:
	golangci-lint run

.PHONY: build
build:
	go build -o bin/server cmd/server/main.go
6. Embrace Mechanical Empathy
Understand what your abstractions are doing. Profile your applications. Use observability tools. Don’t cargo-cult patterns without understanding their costs.
// Use pprof to understand what your code is actually doing
import _ "net/http/pprof"

func main() {
    // Enable profiling endpoint
    go func() {
        log.Println(http.ListenAndServe("localhost:6060", nil))
    }()

    // Your application code
    server.Run()
}

// Then analyze:
// CPU profile: go tool pprof http://localhost:6060/debug/pprof/profile?seconds=30
// Heap profile: go tool pprof http://localhost:6060/debug/pprof/heap
// Goroutine profile: go tool pprof http://localhost:6060/debug/pprof/goroutine
Learn to read the profiles. Understand where time is spent. Question assumptions.
A Glimpse of Hope: WebAssembly?
There’s an interesting thought experiment: what if we could replace Docker, Kubernetes, and service meshes by compiling code to WebAssembly and injecting necessary capabilities as logical layers without network hops?
The Promise (Where Java Failed)
Java promised “Write Once, Run Anywhere” (WORA) in the 1990s. It failed. Why?
- Heavy JVM runtime overhead
- Platform-specific JNI libraries
- GUI frameworks that looked different on each OS
- “Write once, debug everywhere” became the joke
WebAssembly might actually deliver on this promise because: It is a stack-based virtual machine with WASI (WebAssembly System Interface)—a standardized system API similar to POSIX. Solomon Hykes, creator of Docker, famously said:
“If WASM+WASI existed in 2008, we wouldn’t have needed to create Docker. That’s how important it is. WebAssembly on the server is the future of computing. A standardized system interface was the missing link. Let’s hope WASI is up to the task!” — Solomon Hykes, March 2019
Eliminating Network Hops
Current architecture (9 network hops):

WebAssembly architecture (1-2 network hops):
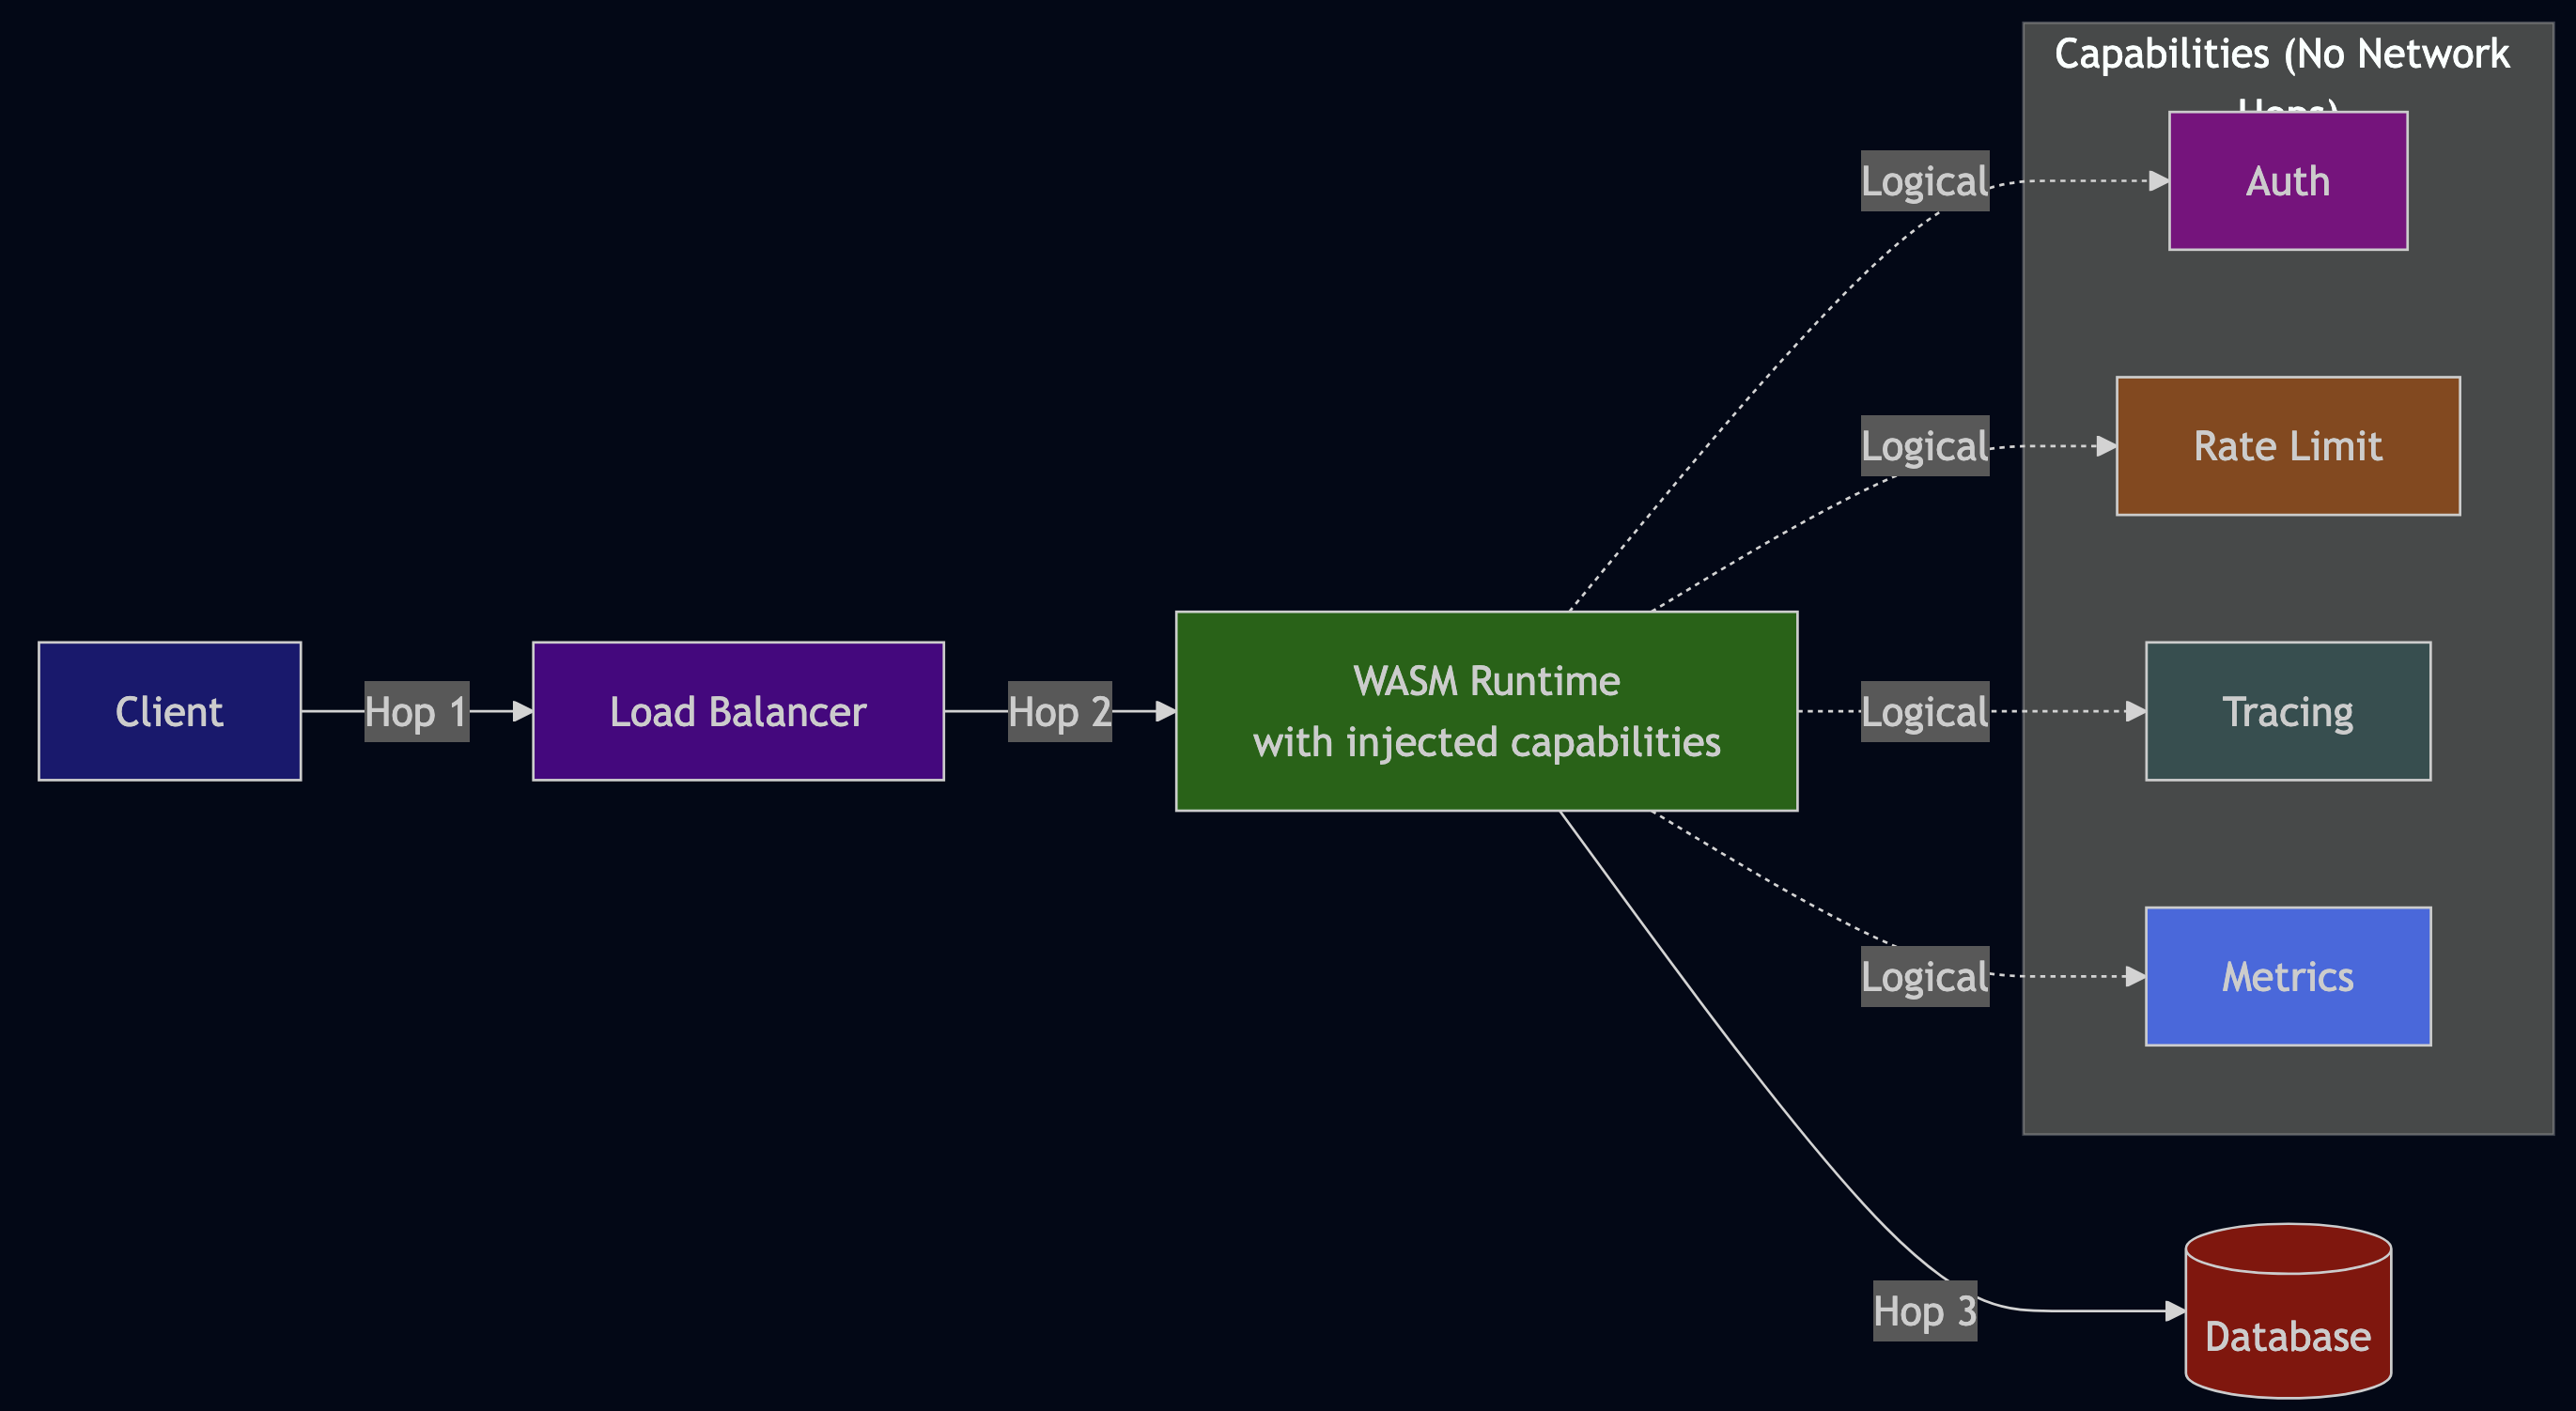
What changes:
- Container (500MB) ? WASM binary (2-5MB)
- Cold start (2-5 seconds) ? Instant (<100ms)
- Sidecars eliminated ? Capabilities injected logically
- 9 network hops ? 2-3 network hops
- No coordination nightmare ? Single runtime config
The Instrumentation Problem Solved
Remember the 85 lines of observability code for 15 lines of business logic? With WASM:
// Your code - just business logic
func ProcessOrder(order Order) error {
    validateOrder(order)
    chargePayment(order)
    saveOrder(order)
}

// Runtime injects at deployment:
// - Authentication
// - Rate limiting
// - Distributed tracing
// - Metrics
// - Logging
// All without code changes
What’s Missing?
WebAssembly isn’t ready yet. Critical gaps:
- WASI maturity: Still evolving (Preview 2 in development)
- Async I/O: Limited compared to native runtimes
- Database drivers: Many don’t support WASM
- Networking: WASI sockets still experimental
- Ecosystem tooling: Debugging, profiling still primitive
But the trajectory is promising:
- Cloudflare Workers, Fastly Compute@Edge (production WASM)
- Major cloud providers investing heavily
- CNCF projects (wasmCloud, Spin, WasmEdge)
- Active development of Component Model and WASI
Why This Might Succeed (Unlike Java)
- Smaller runtime footprint (10-50MB vs 100-500MB JVM)
- True sandboxing (capability-based security, not just process isolation)
- No platform-specific dependencies (WASI standardizes system access)
- Native performance (AOT compilation, not JIT)
- Industry backing (Google, Microsoft, Mozilla, Fastly, Cloudflare)
The promise: compile once, run anywhere with the performance of native code and the security of containers—without the complexity. If WebAssembly fills these gaps, we could eliminate:
- Docker images and registries
- Kubernetes complexity
- Service mesh overhead
- Sidecar coordination nightmares
- Most of the network hops we’ve accumulated
Conclusion: Abstraction as a Tool, Not a Goal
Abstraction should serve us, not the other way around. Every layer should earn its place by solving a problem better than the alternatives—considering both the benefits it provides and the complexity it introduces.
We’ve built systems so complex that:
- Learning to code takes 10x longer than it did in the 1980s
- New developers only understand top layers, lacking mechanical empathy
- Frameworks multiply faster than developers can learn them
- Network hops add latency, failure points, and debugging complexity
- Dependencies create supply chain vulnerabilities and compatibility nightmares
- Observability adds as much complexity as it solves
- Coordinating timeout values across layers causes production incidents
- Debugging requires access to 9+ different log sources
The industry will eventually swing back toward simplicity, as it always does. Monoliths are already making a comeback in certain contexts. “Majestic monoliths” are being celebrated. The pendulum swings. Until then, be ruthless about abstraction. Question every layer. Measure its costs. And remember:
The best code is not the most elegant or abstract—it’s the code that solves the problem clearly and can be understood by the team that has to maintain it.
In my career of writing software for over 30 years, I’ve learned one thing for certain: the code you write today will outlive your employment at the company. Make it simple enough that someone else can understand it when you’re gone. Make it observable enough that they can debug it when it breaks. And make it maintainable enough that they don’t curse your name when they have to change it.