Modern distributed systems face a fundamental challenge: how to efficiently schedule and execute thousands of tasks across heterogeneous resources while maximizing throughput, minimizing latency, and ensuring fair resource allocation. This challenge becomes even more complex when dealing with workflows, dependencies, and varying resource requirements. I have written about building Formicary, an open-source distributed orchestration engine before and in this post, I’ll explore task scheduling algorithms for executing background tasks, jobs, and workflows through the lens of Formicary. We’ll examine how theoretical scheduling concepts translate into practical implementations in a production-ready system.
Formicary Architecture Overview
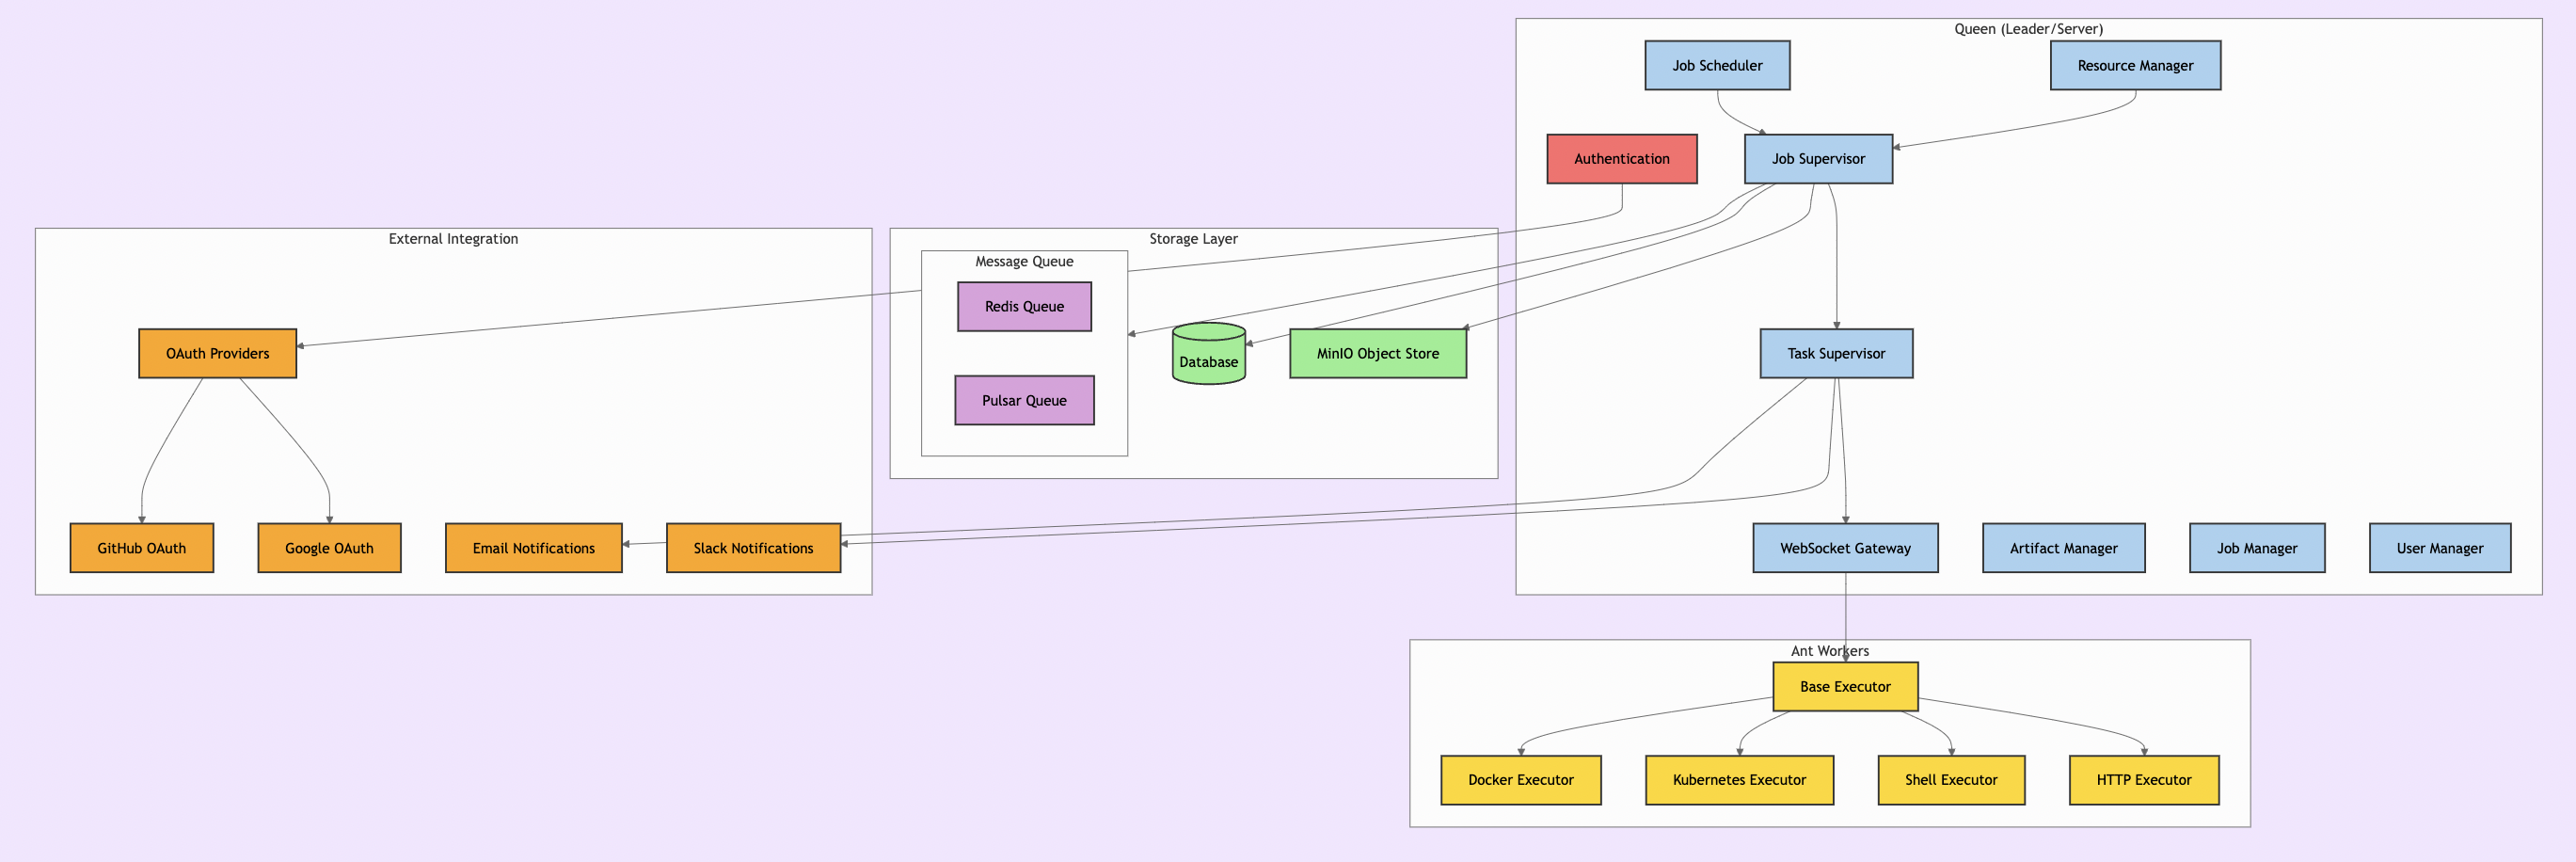
Before diving into scheduling algorithms, let’s understand Formicary’s architecture. The system follows a Leader-Follower pattern with two main components:
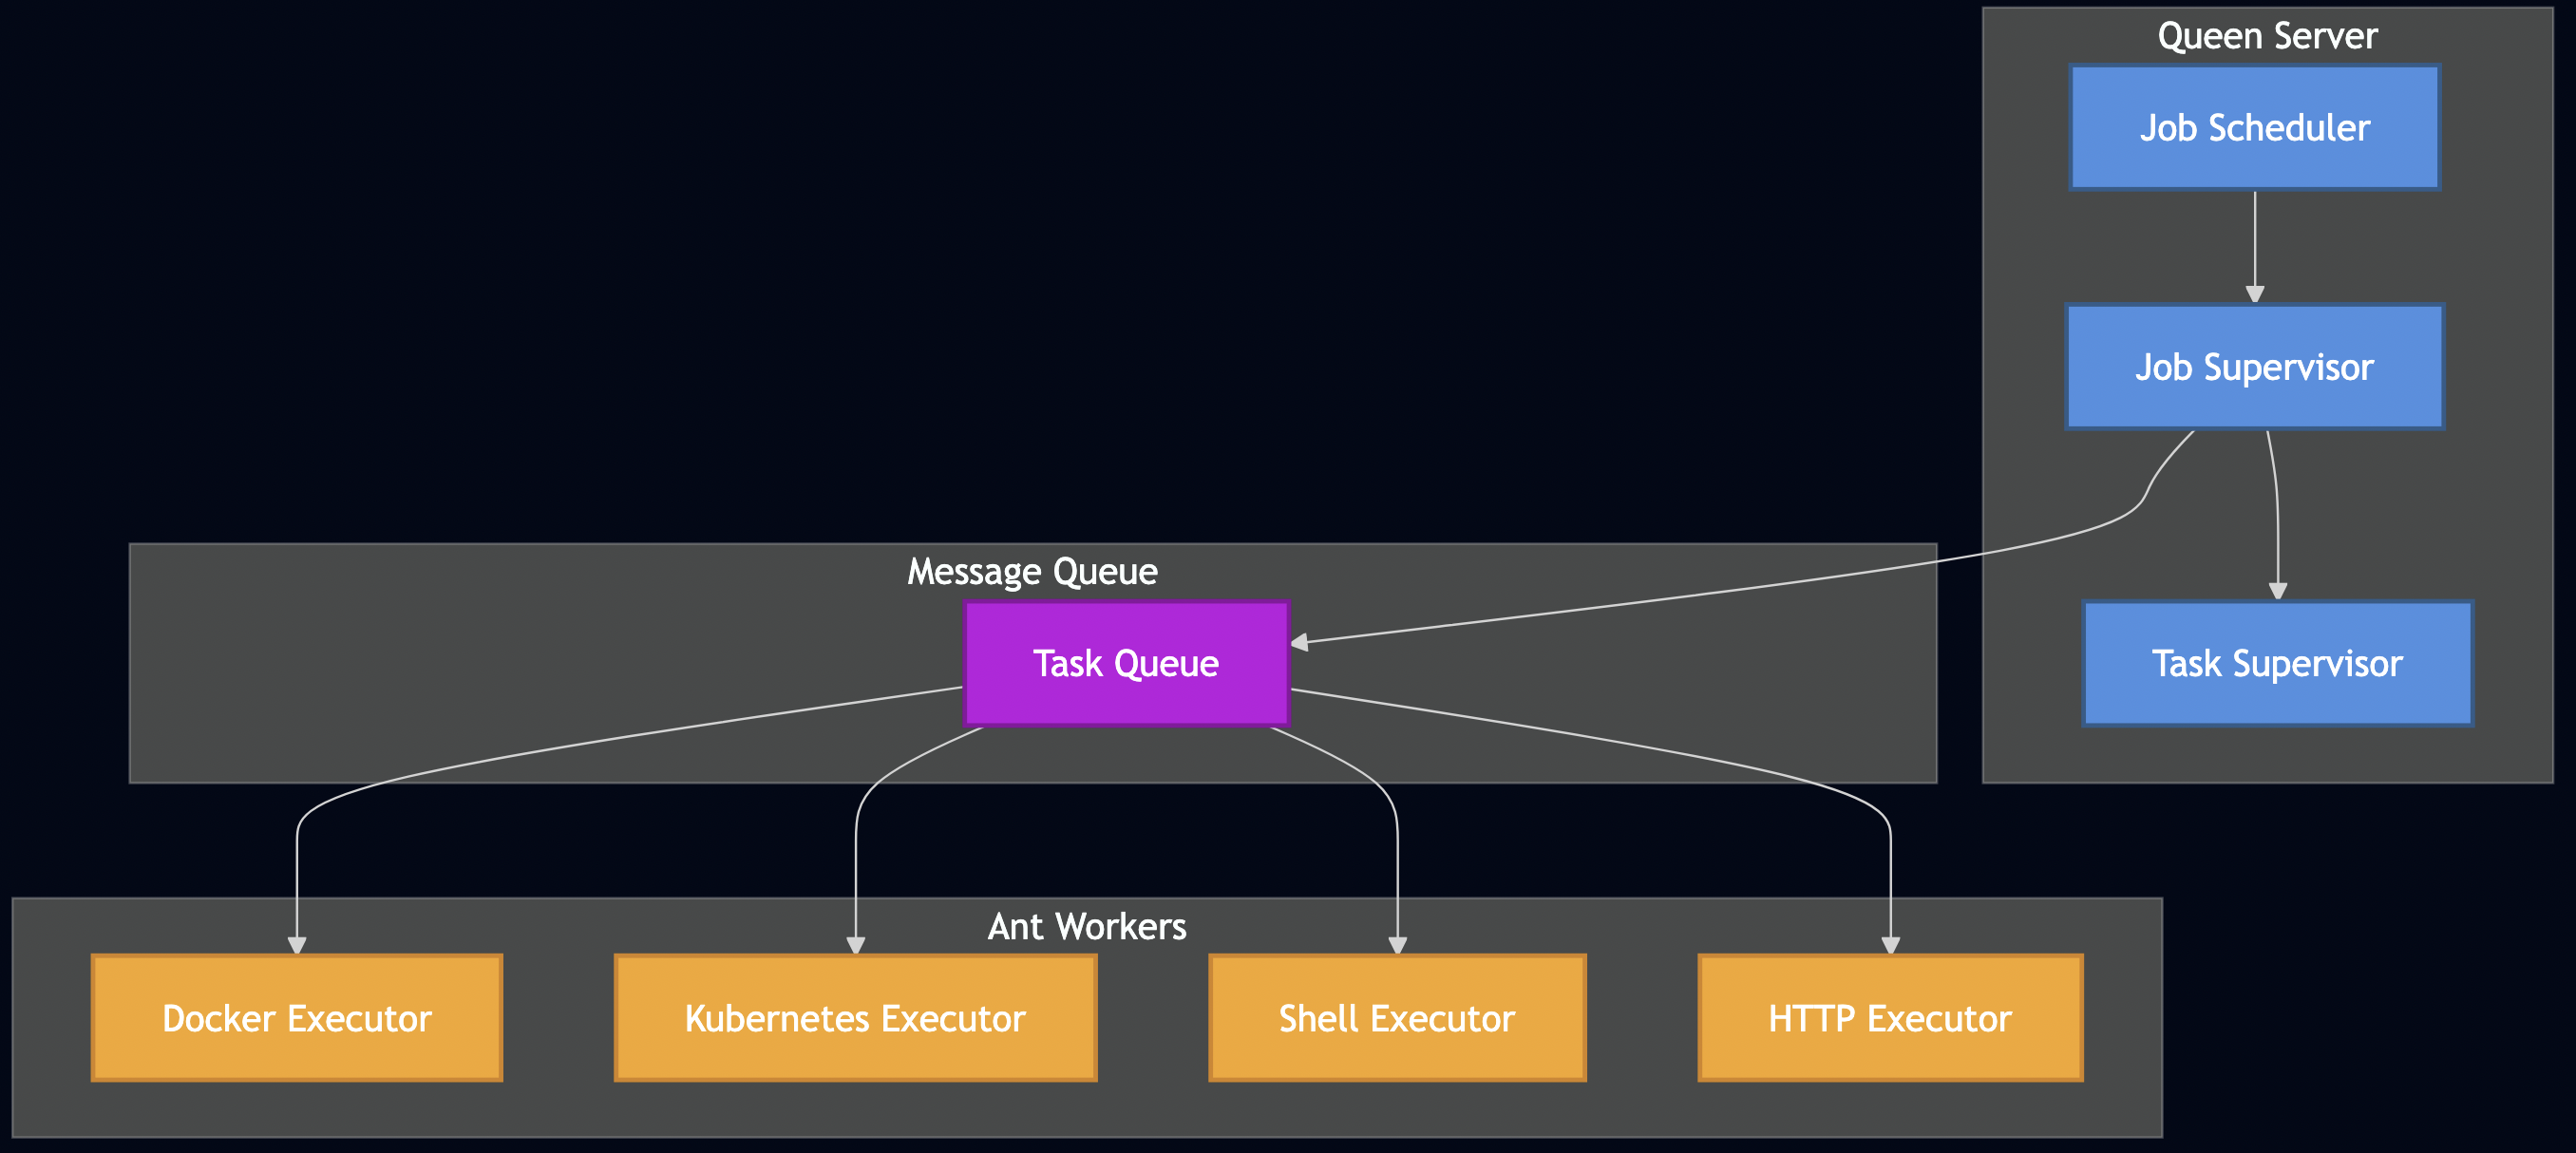
The Queen (Leader/Server)
- API & UI Controllers: RESTful APIs and web dashboard
- Job Scheduler: Leader-elected service that polls for pending jobs
- Resource Manager: Tracks available ant workers and their capabilities
- Job Supervisor: Orchestrates job execution as a DAG
- Task Supervisor: Manages individual task lifecycle
The Ants (Followers/Workers)
- Executors: Support for Docker, Kubernetes, Shell, HTTP, WebSocket, and custom protocols
- Registration System: Workers advertise capabilities via tags and methods
- Artifact Management: Handle dependencies and outputs
Key Features Supporting Advanced Scheduling
Formicary includes several features that enable sophisticated scheduling strategies:
- Tags & Labels: Route tasks to specific workers based on capabilities
- Priority Levels: Jobs can have different priority levels for execution order
- Resource Constraints: Define CPU, memory, and storage requirements
- Tenant Isolation: Multi-tenant support with quota management
- Cron Scheduling: Time-based job scheduling
- Concurrent Limits: Control maximum parallel job execution
- Dynamic Scaling: Kubernetes-based auto-scaling support
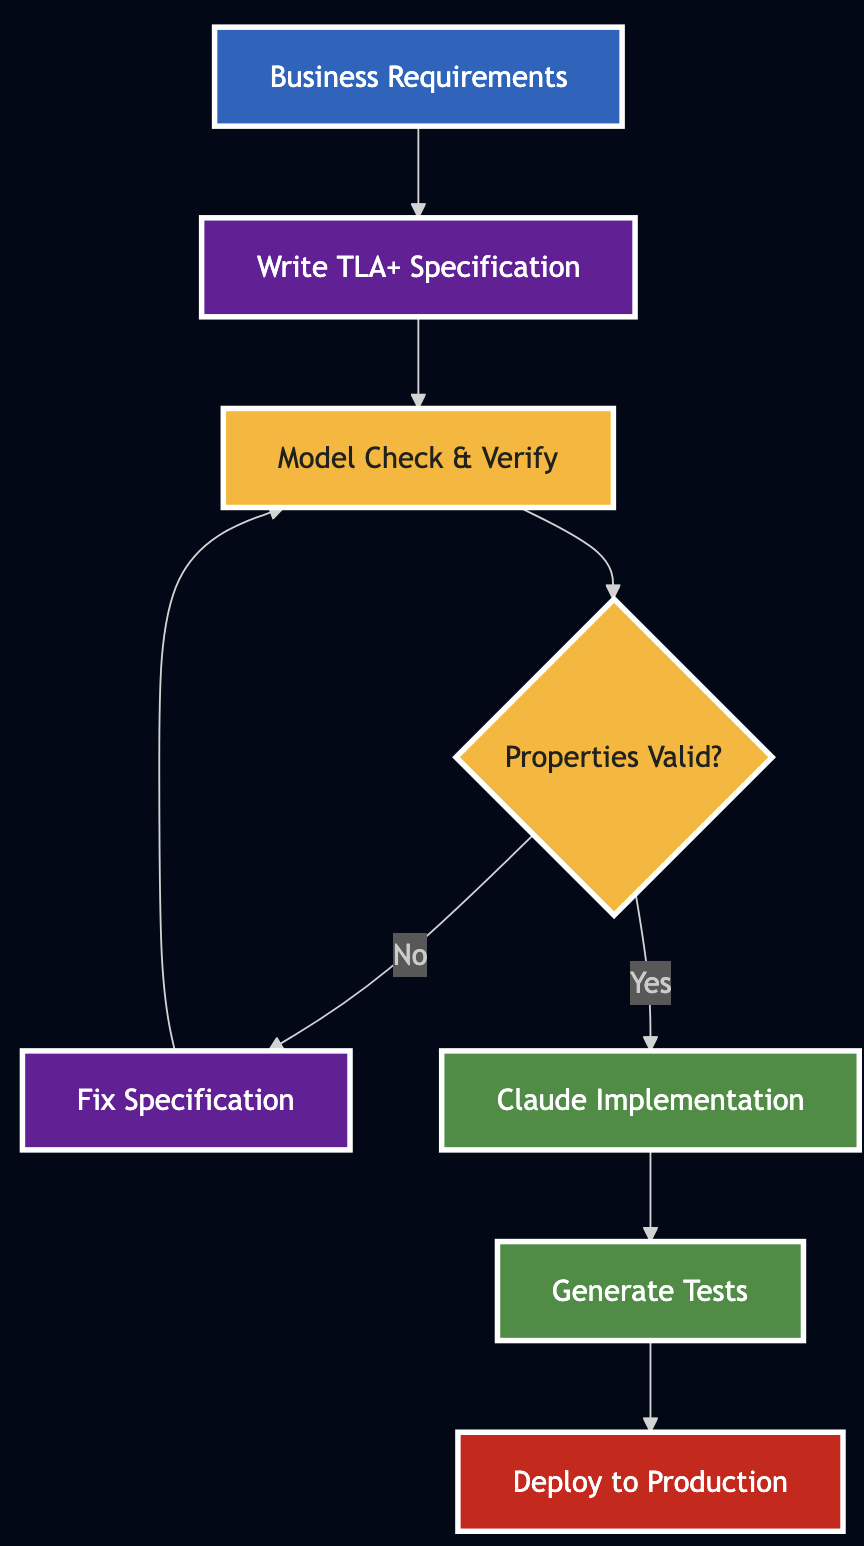
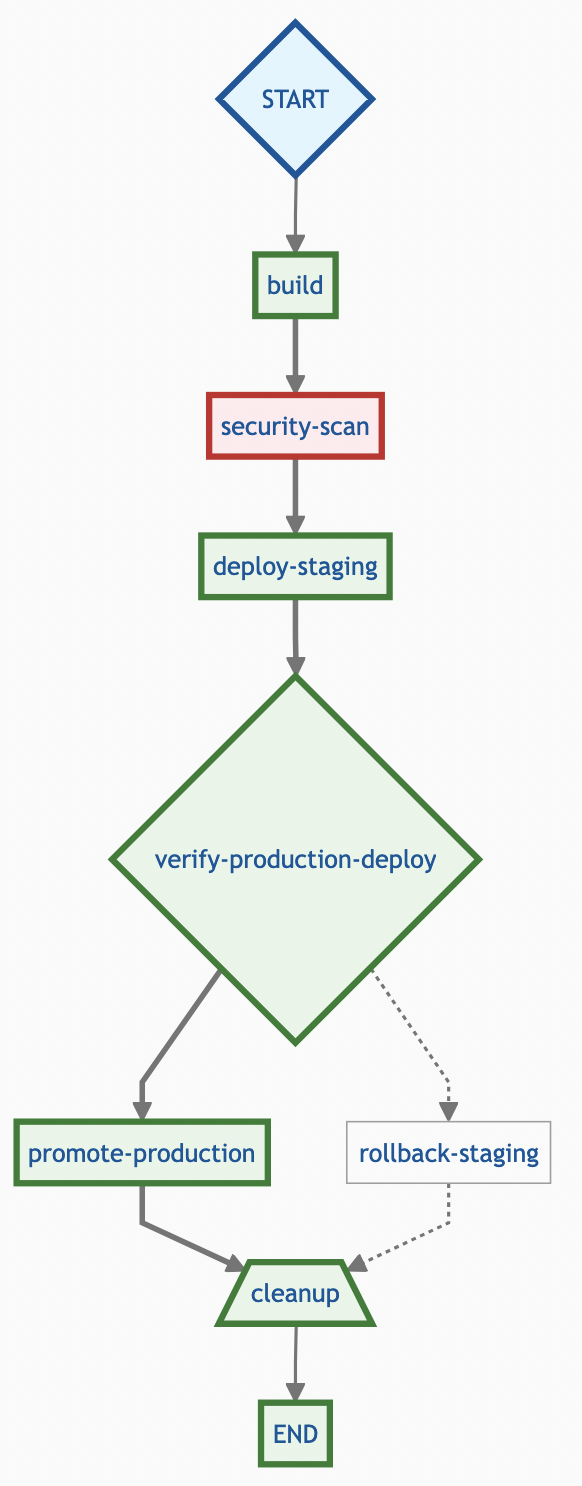
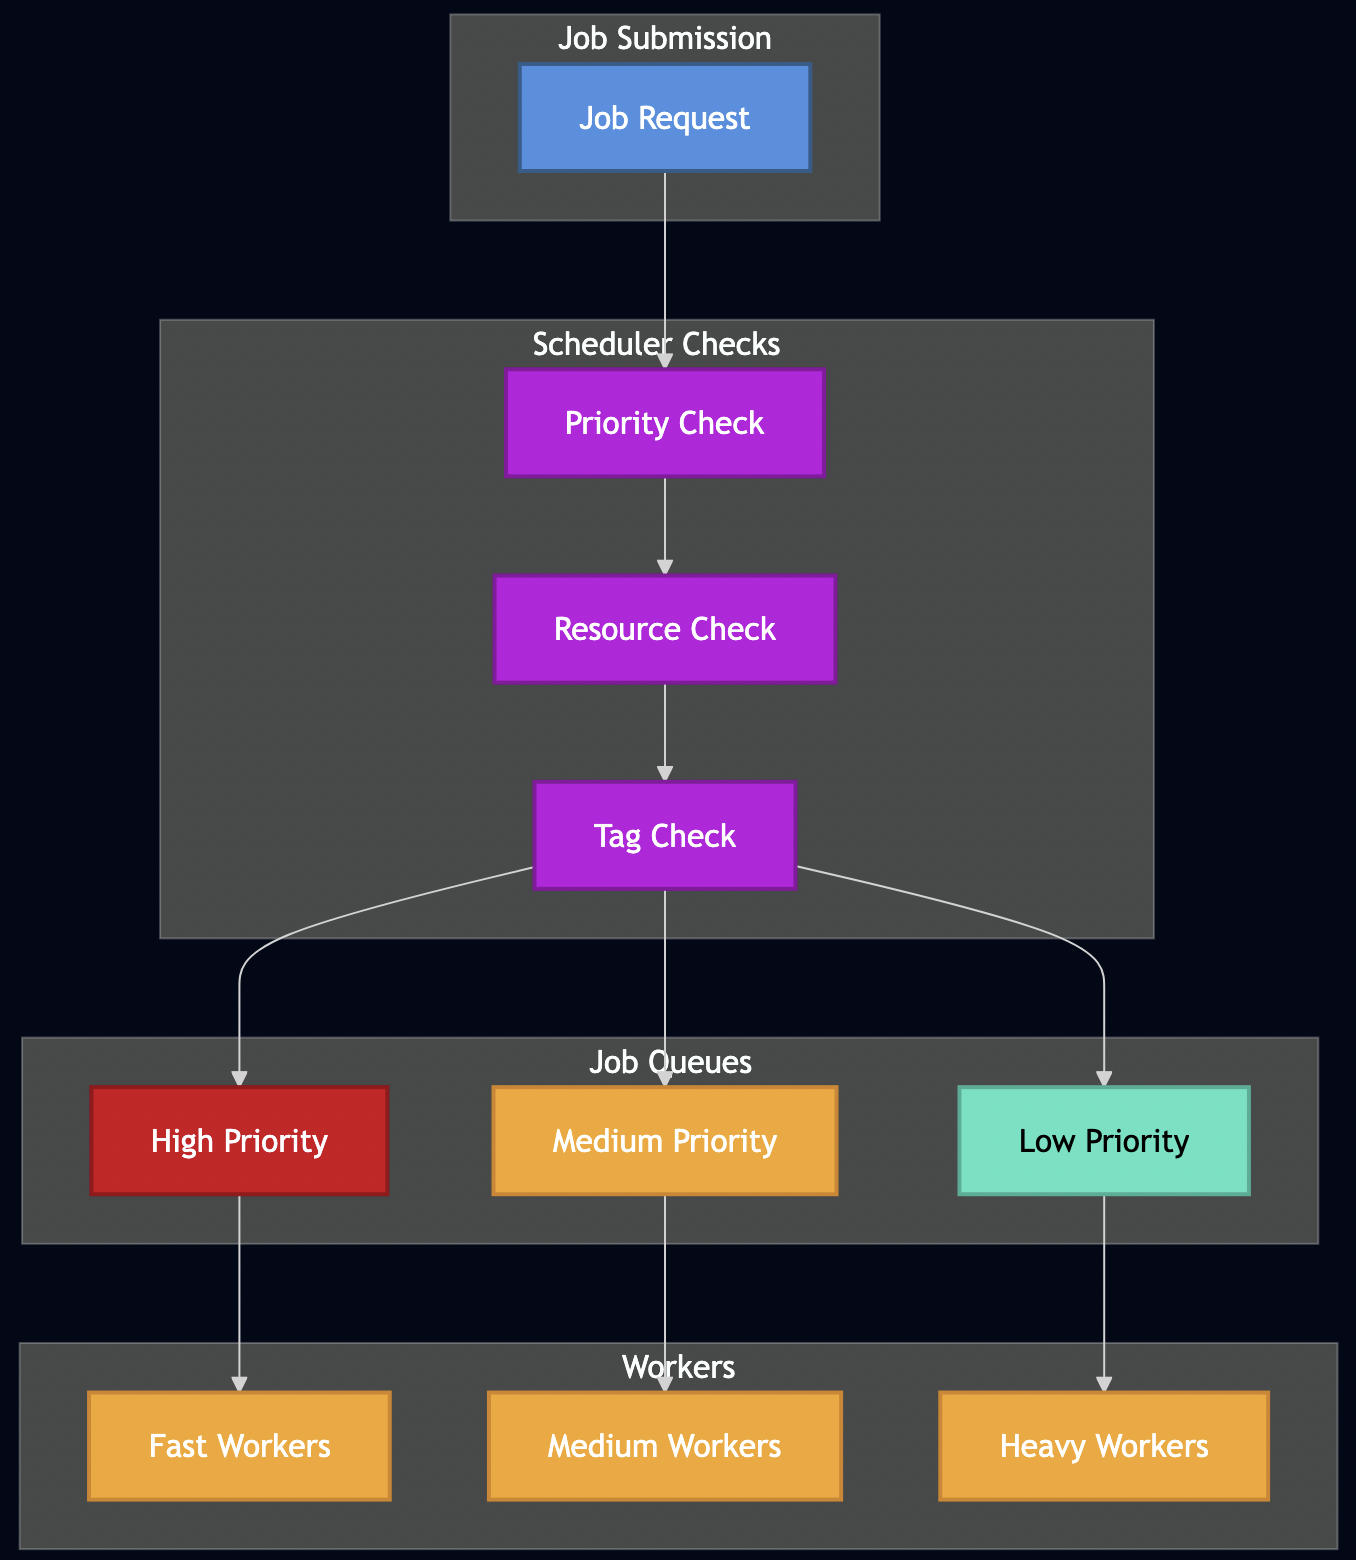
Scheduling Algorithm Decision Flow
Before diving into specific algorithms, let’s visualize how different scheduling strategies route jobs through the system:
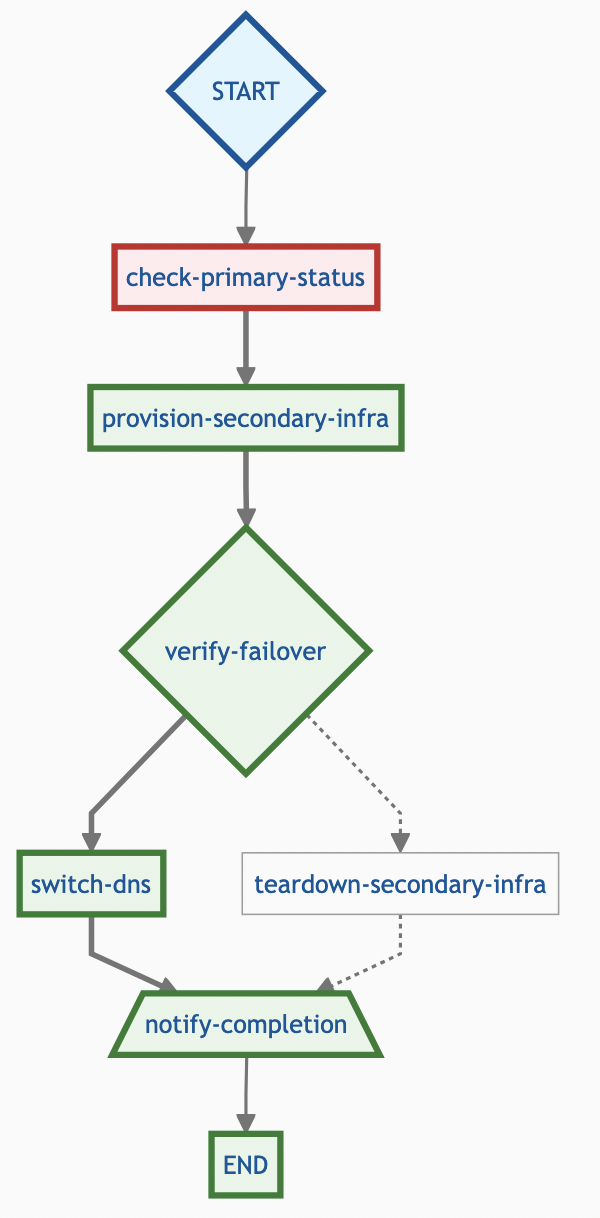
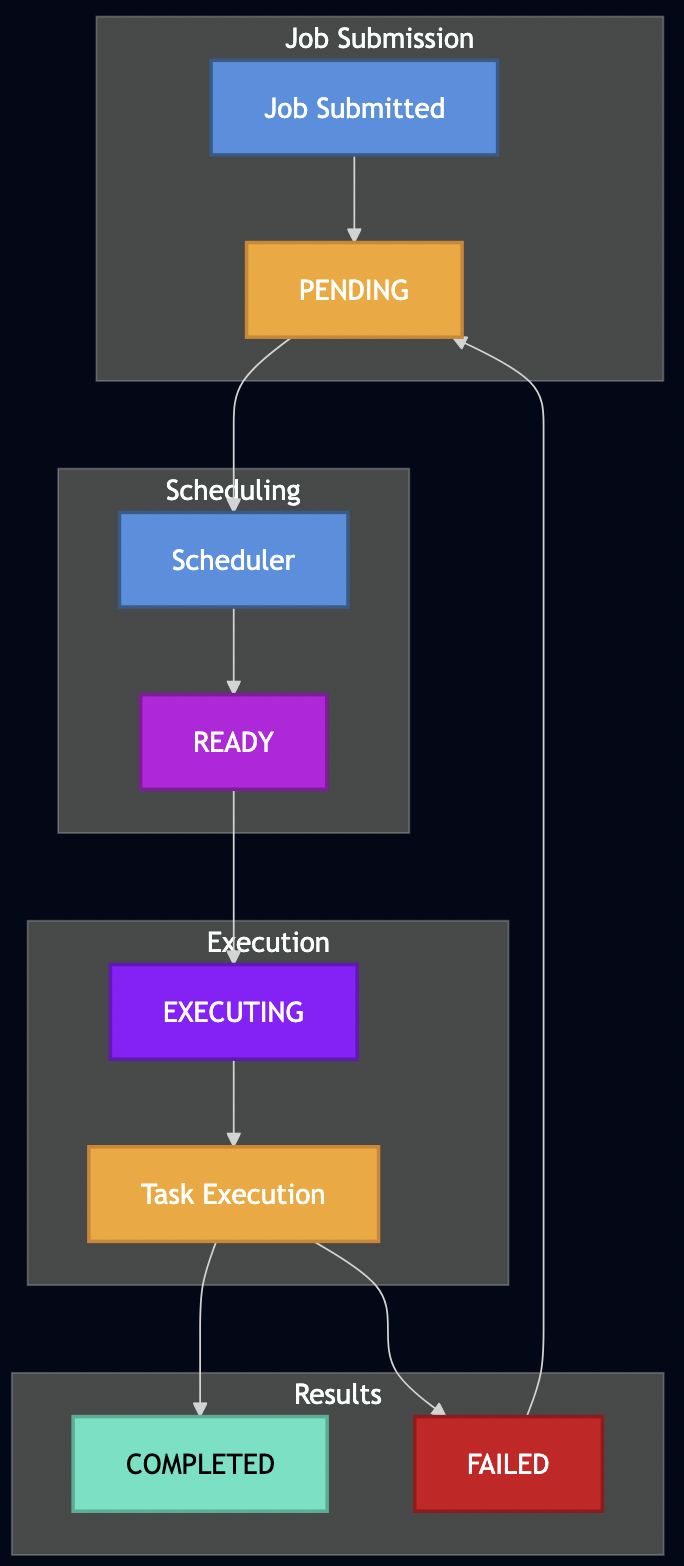
Job Execution Lifecycle
Understanding how jobs flow through the system helps illustrate where different scheduling algorithms take effect:
Wait Time Estimation Algorithm
Formicary implements a sophisticated wait time estimation system that helps users understand queue delays and plan accordingly. The algorithm considers multiple factors:
// Simplified wait time calculation
func CalculateWaitTime(jobRequest, queuePosition, historicalStats, availableWorkers) time.Duration {
    // 1. Find position in priority-ordered queue
    queuePosition := findQueuePosition(jobRequest.Priority, jobRequest.SubmissionTime)

    // 2. Calculate jobs ahead in queue (70% of executing jobs assumed near completion)
    jobsAhead := queuePosition + int(float64(executingJobs) * 0.7)

    // 3. Estimate based on historical average execution time
    if historicalAverage > 0 && availableWorkers > 0 {
        estimatedWait := time.Duration(float64(jobsAhead) / float64(availableWorkers)) *
                        time.Duration(historicalAverage) * time.Millisecond
    }

    // 4. Account for scheduled future execution
    if jobRequest.ScheduledAt.After(time.Now()) {
        scheduleDiff := time.Until(jobRequest.ScheduledAt)
        if scheduleDiff > estimatedWait {
            estimatedWait = scheduleDiff
        }
    }

    return estimatedWait
}
Formicary uses JobStatsRegistry to track execution patterns:
type JobStats struct {
    SucceededJobsAverage int64  // Average execution time
    ExecutingJobs       int32   // Currently running
    AntsCapacity        int     // Available worker capacity
    AntsAvailable       bool    // Worker availability status
}
It considers worker availability and capacity constraints:
- Calculates minimum available workers across all required task types
- Accounts for tag-based routing restrictions
- Factors in Kubernetes resource quotas
Formicary orders pending jobs by priority and submission time:
sort.Slice(pendingJobs, func(i, j int) bool {
    if job1.Priority == job2.Priority {
        return job1.CreatedAt.Before(job2.CreatedAt)  // FCFS within priority
    }
    return job1.Priority > job2.Priority  // Higher priority first
})
This estimation helps with:
- SLA Management: Predict if jobs will meet deadlines
- Capacity Planning: Identify when to scale worker pools
- User Experience: Provide realistic wait time expectations
- Load Balancing: Route jobs to less congested worker pools
Task Scheduling Algorithms in Practice
Now let’s examine how various scheduling algorithms are implemented or can be achieved in Formicary:
1. First-Come First-Serve (FCFS)
FCFS processes tasks in arrival order using a simple FIFO queue. The algorithm maintains fairness by ensuring no task is starved, but suffers from the “convoy effect” where short jobs wait behind long-running ones. Its characteristics include:
- Average waiting time:
(sum of waiting times) / number of jobs - Turnaround time:
completion_time - arrival_time - No preemption – jobs run to completion
Formicary Implementation: This is Formicary’s default behavior. When jobs are submitted, they’re placed in a PENDING state and processed by the Job Scheduler in submission order.
# Job requests are processed in submission order
job_type: data-processing
description: FCFS example - processed in submission order
tasks:
  - task_type: process-data
    method: DOCKER
    container:
      image: python:3.9
    script:
      - python process_data.py
Pros: Simple, predictable, no starvation Cons: Long-running jobs can block shorter ones, poor average wait times
2. Priority Scheduling
Each job has an assigned priority, with higher priority jobs scheduled first. Priority assignment can be static or dynamic based on various factors. A drawback of of this algorithm is starvation of low-priority jobs but it can be addressed with following techniques:
- Aging: Gradually increase priority of waiting jobs
- Priority Inversion Protection: Temporary priority boost for resource holders
- Fair Share: Ensure each user/tenant gets minimum resource allocation
Formicary Implementation: Jobs support priority levels, and the scheduler considers priority when selecting the next job to execute.
job_type: critical-analysis
priority: 10  # Higher priority job
description: Critical security analysis
tasks:
  - task_type: vulnerability-scan
    method: KUBERNETES
    container:
      image: security-scanner:latest
# Submitting jobs with different priorities
curl -H "Authorization: Bearer $TOKEN" \
  -H "Content-Type: application/json" \
  --data '{"job_type": "critical-analysis", "job_priority": 10}' \
  $SERVER/api/jobs/requests

curl -H "Authorization: Bearer $TOKEN" \
  -H "Content-Type: application/json" \
  --data '{"job_type": "routine-backup", "job_priority": 1}' \
  $SERVER/api/jobs/requests
Implementation Details: The Job Scheduler queries pending jobs ordered by priority, ensuring high-priority jobs are scheduled first when resources become available.
3. Multilevel Queues – Tag-Based Routing
This algorithm partitions jobs into separate queues based on characteristics (interactive, batch, system). Each queue can use different scheduling algorithms, with inter-queue scheduling typically using fixed priorities or time slicing. Common queue classification strategies include:
- Job Type: Interactive, batch, system, real-time
- Resource Requirements: CPU-intensive, I/O-intensive, memory-intensive
- Duration: Short, medium, long-running jobs
- User Class: Premium, standard, background users
Formicary Implementation: Using tags and labels, we can effectively create multilevel queues by routing different job types to specialized worker pools.
# Short-running analysis jobs
job_type: quick-scan
tags: ["fast-worker", "analysis"]
tasks:
  - task_type: preflight-check
    method: DOCKER
    tags: ["cpu-optimized"]
    container:
      image: lightweight-scanner:latest

---
# Medium-duration static analysis
job_type: static-analysis
tags: ["medium-worker", "analysis"]
tasks:
  - task_type: code-analysis
    method: KUBERNETES
    tags: ["memory-optimized"]
    container:
      image: static-analyzer:latest
      memory_limit: "4Gi"

---
# Long-running dynamic analysis
job_type: dynamic-analysis
tags: ["heavy-worker", "analysis"]
tasks:
  - task_type: device-testing
    method: KUBERNETES
    tags: ["gpu-enabled", "device-farm"]
    container:
      image: dynamic-analyzer:latest
      resources:
        cpu_limit: "8"
        memory_limit: "16Gi"
At a mobile security company, I implemented this pattern with three distinct worker pools:
- Fast Workers: Preflight analysis (seconds to minutes)
- Medium Workers: Static analysis (a few minutes)
- Heavy Workers: Dynamic analysis on device farms (multiple minutes to hours)
4. Resource-Aware Scheduling
This algorithm makes scheduling decisions based on current and predicted resource availability (CPU, memory, storage, network). It considers both resource requirements and system capacity to prevent oversubscription:
- Multi-dimensional: CPU, memory, storage, network, custom resources
- Quality of Service: Guaranteed, burstable, best-effort resource classes
- Affinity/Anti-affinity (e.g.,Kubernetes Scheduler): Placement preferences and constraints
Advanced techniques include:
- Bin Packing: First-fit, best-fit, worst-fit algorithms
- Resource Fragmentation: Avoid unusable resource leftovers
- Overcommitment: Schedule based on statistical usage patterns
Formicary Implementation: Integration with Kubernetes resource management and custom resource tracking.
job_type: ml-training
description: Resource-aware ML model training
tasks:
  - task_type: train-model
    method: KUBERNETES
    tags: ["gpu-node", "ml-workload"]
    container:
      image: tensorflow/tensorflow:latest-gpu
      cpu_request: "4"
      cpu_limit: "8"
      memory_request: "8Gi"
      memory_limit: "16Gi"
      ephemeral_storage_request: "10Gi"
    node_selector:
      hardware: "gpu-enabled"
      instance-type: "ml-optimized"
    tolerations:
      - key: "gpu-workload"
        operator: "Equal"
        value: "true"
        effect: "NoSchedule"
The Resource Manager tracks worker capabilities and current load, ensuring tasks are only scheduled when adequate resources are available.
5. Matchmaking Scheduler – Affinity-Based Routing
It matches jobs to workers based on capabilities, data locality, and preferences. Uses constraint satisfaction to find optimal job-worker pairings. Matching algorithms include:
- Hungarian Algorithm: Optimal assignment for bipartite matching
- Market-based: Economic models with bids and auctions
- Constraint Satisfaction (Kubernetes/Apache Spark): Match job requirements to worker capabilities
Common locality considerations include:
- Data Locality: Schedule jobs where data resides
- Network Topology: Minimize network hops and bandwidth usage
- Hardware Affinity: GPU jobs to GPU nodes, FPGA workloads to FPGA nodes
Formicary Implementation: Using tags, labels, and Kubernetes affinity rules to achieve data locality and capability matching.
job_type: geo-distributed-processing
description: Process data close to its source
tasks:
  - task_type: process-eu-data
    method: KUBERNETES
    tags: ["eu-region", "gdpr-compliant"]
    container:
      image: data-processor:latest
    affinity:
      node_affinity:
        required_during_scheduling_ignored_during_execution:
          node_selector_terms:
            - match_expressions:
                - key: "region"
                  operator: In
                  values: ["eu-west-1", "eu-central-1"]
                - key: "compliance"
                  operator: In
                  values: ["gdpr"]
    variables:
      DATA_REGION: "eu"
      COMPLIANCE_MODE: "strict"
In mobile security analysis company, I used matchmaking scheduling to manage physical device farms where each device has unique characteristics. The system implemented two-phase matchmaking: first reserving devices based on requirements like platform (iOS/Android), OS version ranges, device type (phone/tablet), and capabilities (SMS, camera, GPS), then using affinity rules to route jobs to the specific reserved device.
Pros: Optimal resource matching, data locality, flexibility Cons: Complex matching logic, potential for suboptimal assignments under constraints
6. Delay Scheduler – Temporal Control
Delay scheduling deliberately postpones task execution until optimal conditions are met, such as data locality, resource availability, or specific timing requirements. The algorithm balances waiting for better conditions against potential starvation, often using configurable timeout thresholds.
Optimal_Delay = min(Max_Wait_Time, Expected_Benefit_Time)
Where:
- Max_Wait_Time = configured upper bound to prevent starvation
- Expected_Benefit_Time = estimated time until optimal conditions
- Locality_Benefit = (Remote_Cost - Local_Cost) / Transfer_Rate
Common delay strategies include:
- Data Locality Delay: Wait for data to become available on local nodes
- Resource Availability Delay: Wait for preferred resource types to become free
- Temporal Delay: Execute at specific times (off-peak hours, scheduled windows)
- Condition-Based Delay: Wait for external system states or events
Formicary’s Delay Implementations:
- Time-Based Scheduling:
job_type: nightly-etl
cron_trigger: "0 2 * * *"  # 2 AM daily
scheduled_at: "2024-12-25T02:00:00Z"  # One-time future execution
- Condition-Based Polling:
job_type: external-dependency-wait
tasks:
  - task_type: wait-for-api
    method: HTTP_GET
    url: https://api.service.com/status
    delay_between_retries: 30s
    retry: 20  # Maximum 10 minutes of polling
    on_exit_code:
      "200": proceed-with-processing    # Service ready
      "404": EXECUTING                  # Keep polling
      "503": EXECUTING                  # Service temporarily unavailable
      "FAILED": abort-job               # Permanent failure
- Resource Availability Delay:
job_type: gpu-intensive-training
tasks:
  - task_type: training
    method: KUBERNETES
    tags: ["gpu-v100", "high-memory"]
    timeout: 6h
    # Will delay until specific GPU resources become available
Pros:
- Improved data locality and reduced network I/O
- Better resource utilization through temporal load balancing
- Flexible execution timing for cost optimization
- Support for external dependency coordination
Cons:
- Increased job latency and scheduling complexity
- Risk of starvation without proper timeout mechanisms
- Difficulty in predicting optimal delay periods
- Potential for cascading delays in dependent workflows
7. Capacity Scheduler – Resource Quotas
Capacity scheduling partitions cluster resources into hierarchical queues with guaranteed minimum capacities and configurable maximum limits. Each queue can elastically use unused capacity from other queues while respecting absolute limits and priority policies.
Queue_Capacity = (Allocated_Resources / Total_Cluster_Resources) × 100%
Effective_Capacity = min(Max_Capacity, Guaranteed_Capacity + Available_Borrowed_Capacity)
Resource_Utilization = Used_Resources / Effective_Capacity
Common principles include:
- Capacity Guarantees: Each queue has minimum guaranteed resources
- Elastic Sharing: Unused capacity can be borrowed by other queues
- Preemption: Higher priority queues can reclaim borrowed resources
- Hierarchical Organization: Nested queues for organizational structure
Common queue management strategies include:
- FIFO within Queues: Simple first-come-first-served within capacity limits
- Priority Ordering: High-priority jobs within queues get preference
- Fair Share: Proportional resource distribution among queue users
- Preemption Policies: Graceful vs. aggressive resource reclamation
Formicary Implementation Features:
# Organization-level capacity limits
tenant_limits:
  max_concurrent_jobs: 50
  max_cpu_hours_per_day: 200
  max_storage_gb: 500

# Job-level concurrency control
job_type: batch-processing
max_concurrency: 3  # Limit concurrent instances
Capacity enforcement mechanisms include:
- Hard Limits: Absolute maximum resource consumption
- Soft Limits: Warning thresholds with potential throttling
- Burst Capacity: Temporary exceeding of limits during low contention
- Quota Reset Periods: Time-based quota renewals (daily, weekly, monthly)
Pros: Predictable resource allocation, multi-tenant isolation, elastic resource sharing, hierarchical management Cons: Complex configuration, potential resource fragmentation, underutilization during low demand, administrative overhead
8. Fair Scheduler – Multi-Tenant Fairness
It ensures proportional resource sharing among users, groups, or tenants over time. Uses techniques like weighted fair queueing and deficit round-robin to achieve long-term fairness while maintaining efficiency. Common metrics include:
- Proportional Share (Hadoop Fair Scheduler): Resources allocated based on weights/quotas
- Max-Min Fairness (Kubernetes): Maximize minimum allocation across users
- Deadline Fairness: Ensure SLA compliance across tenants
Advanced fair sharing includes:
- Hierarchical Fair Sharing: Nested user groups and organizations
- Dominant Resource Fairness: Fair allocation across multiple resource types
- Lottery Scheduling: Probabilistic fairness using tickets
Formicary Implementation: It implements tenant isolation with quota enforcement.
// Formicary's Fair Scheduling based on actual implementation
type FairScheduler struct {
    jobStatsRegistry *JobStatsRegistry
    serverConfig     *ServerConfig
}

func (fs *FairScheduler) CheckFairSchedulingConstraints(request *JobRequest) error {
    // Multi-level concurrency checking: Organization ? User ? Job-level

    // Level 1: Organization concurrency limits
    userExecuting, orgExecuting := fs.jobStatsRegistry.UserOrgExecuting(request)

    if orgExecuting >= fs.getMaxConcurrentOrgJobs(request.OrganizationID) {
        return fs.delayJobForConcurrencyExceeded(request, "organization", orgExecuting)
    }

    // Level 2: User concurrency limits
    if userExecuting >= fs.getMaxConcurrentUserJobs(request.UserID) {
        return fs.delayJobForConcurrencyExceeded(request, "user", userExecuting)
    }

    // Level 3: Job-type concurrency limits
    executionCount := fs.jobStatsRegistry.GetExecutionCount(request.GetUserJobTypeKey())
    if executionCount >= request.GetMaxConcurrency() {
        return fs.delayJobForConcurrencyExceeded(request, "job-type", int(executionCount))
    }

    return nil
}

func (fs *FairScheduler) delayJobForConcurrencyExceeded(request *JobRequest, limitType string, currentCount int) error {
    // Intelligent delay calculation based on historical data
    avgCompletionTime := fs.jobStatsRegistry.GetAverageCompletionTime(request.JobType)

    // Dynamic wait factor: 25% of average completion time, bounded between 15-60 seconds
    waitFactor := min(max(avgCompletionTime/4, 15*time.Second), 60*time.Second)

    // Randomized delay to prevent thundering herd
    randomDelay := time.Duration(rand.Intn(int(waitFactor))) + waitFactor

    // Reschedule with delay
    request.ScheduledAt = time.Now().Add(randomDelay)

    // Logarithmic priority degradation (inspired by mobile security company approach)
    if request.Priority > 0 {
        // Priority degradation: log_e(original_priority), minimum of 1
        newPriority := max(1, int(math.Log(float64(request.Priority))))
        request.Priority = newPriority

        // Allow zero-priority jobs to bypass concurrency limits (emergency valve)
        if newPriority <= 0 {
            return nil // Allow execution despite limits
        }
    }

    // Update schedule attempts counter with exponential backoff
    request.ScheduleAttempts++

    return fmt.Errorf("%s concurrency limit exceeded: %d jobs running, rescheduling with %v delay",
                     limitType, currentCount, randomDelay)
}

// Enhanced concurrency tracking from mobile security company experience
func (fs *FairScheduler) trackConcurrencyMetrics(request *JobRequest) {
    // Real-time metrics for monitoring fairness
    fs.metricsRegistry.Gauge("org_concurrent_jobs", map[string]string{
        "org_id": request.OrganizationID,
        "job_type": request.JobType,
    })

    fs.metricsRegistry.Gauge("user_concurrent_jobs", map[string]string{
        "user_id": request.UserID,
        "job_type": request.JobType,
    })
}
Pros: Prevents monopolization, guarantees minimum service levels Cons: May sacrifice efficiency for fairness, complex weight management
9. Earliest Deadline First (EDF)
Dynamic priority algorithm that assigns highest priority to tasks with earliest deadlines. Optimal for single-processor real-time scheduling if total utilization ? 100%. It uses deadline as the primary scheduling criterion. SJF selects the job with the smallest estimated execution time, minimizing average waiting time.
Schedulability Test: ?(Ci/Ti) ? 1
Where Ci = execution time, Ti = period for periodic tasks
EDF is a dynamic priority scheduling algorithm that assigns highest priority to tasks with the earliest absolute deadlines. It’s provably optimal for single-processor real-time scheduling when total CPU utilization ? 100%, providing maximum schedulability under deadline constraints.
Priority(task) = 1 / (Deadline - Current_Time)
Schedulability_Test: ?(Execution_Time_i / Period_i) ? 1
Laxity = Deadline - Current_Time - Remaining_Execution_Time
Core characteristics include:
- Dynamic Priority: Priorities change as deadlines approach
- Work-Conserving: Never idles processor when tasks are ready
- Deadline-Driven: Scheduling decisions based purely on temporal constraints
- Optimal Utilization: Achieves 100% processor utilization when schedulable
Failure modes include:
- Domino Effect: Single deadline miss can cascade to subsequent tasks
- Thrashing: Excessive context switching under overload conditions
- Unpredictable Overload: Graceful degradation requires additional mechanisms
While Formicary does not natively supported, SJF can be approximated using separate queues for different job duration categories:
# Short jobs queue
job_type: quick-validation
tags: ["short-queue"]
estimated_runtime: "5m"

# Long jobs queue
job_type: full-analysis
tags: ["long-queue"]
estimated_runtime: "2h"
Deadline assignment strategies include:
Relative_Deadline = Period (for periodic tasks)
Absolute_Deadline = Arrival_Time + Relative_Deadline
Critical_Instant = Simultaneous release of all tasks
It can also be simulated using priority scheduling combined with deadline-aware job submission:
# Simulated EDF using priority and scheduled execution
job_type: time-critical-analysis
priority: {{.UrgencyScore}}  # Calculated based on deadline proximity
scheduled_at: "2024-12-31T23:59:59Z"
timeout: 2h
tasks:
  - task_type: urgent-processing
    method: KUBERNETES
    tags: ["priority-worker"]
Implementation Approach: Calculate priority dynamically based on (current_time - deadline) / estimated_runtime to ensure jobs closer to their deadlines receive higher priority.
Pros: Optimal schedulability, maximum resource utilization, simple algorithm, responsive to urgent tasks Cons: Domino effect failures, requires accurate execution time estimates, poor overload behavior, high context switching overhead
10. Speculative Scheduler
It launches multiple instances of slow-running tasks to reduce tail latency. Uses statistical analysis of execution times to detect stragglers and make speculative execution decisions. Balances resource cost against latency improvement. Algorithms include:
- Progress-based: Monitor task completion percentage
- Time-based: Tasks running longer than percentile threshold
- Resource-based: Launch backup only if resources available
Pros: Reduces tail latency, improves user experience, fault tolerance Cons: Resource waste, coordination overhead, may not help heterogeneous workloads
Formicary Status: Not implemented, but the system provides foundation through:
- Task execution monitoring
- Historical performance data collection
- Resource availability tracking
Conceptual Implementation:
job_type: speculative-execution
tasks:
  - task_type: main-task
    method: KUBERNETES
    timeout: 30m
    speculative_backup:
      enabled: true
      delay_threshold: "150%"  # Start backup if 50% slower than average
      resource_threshold: 0.3  # Only if 30%+ resources available
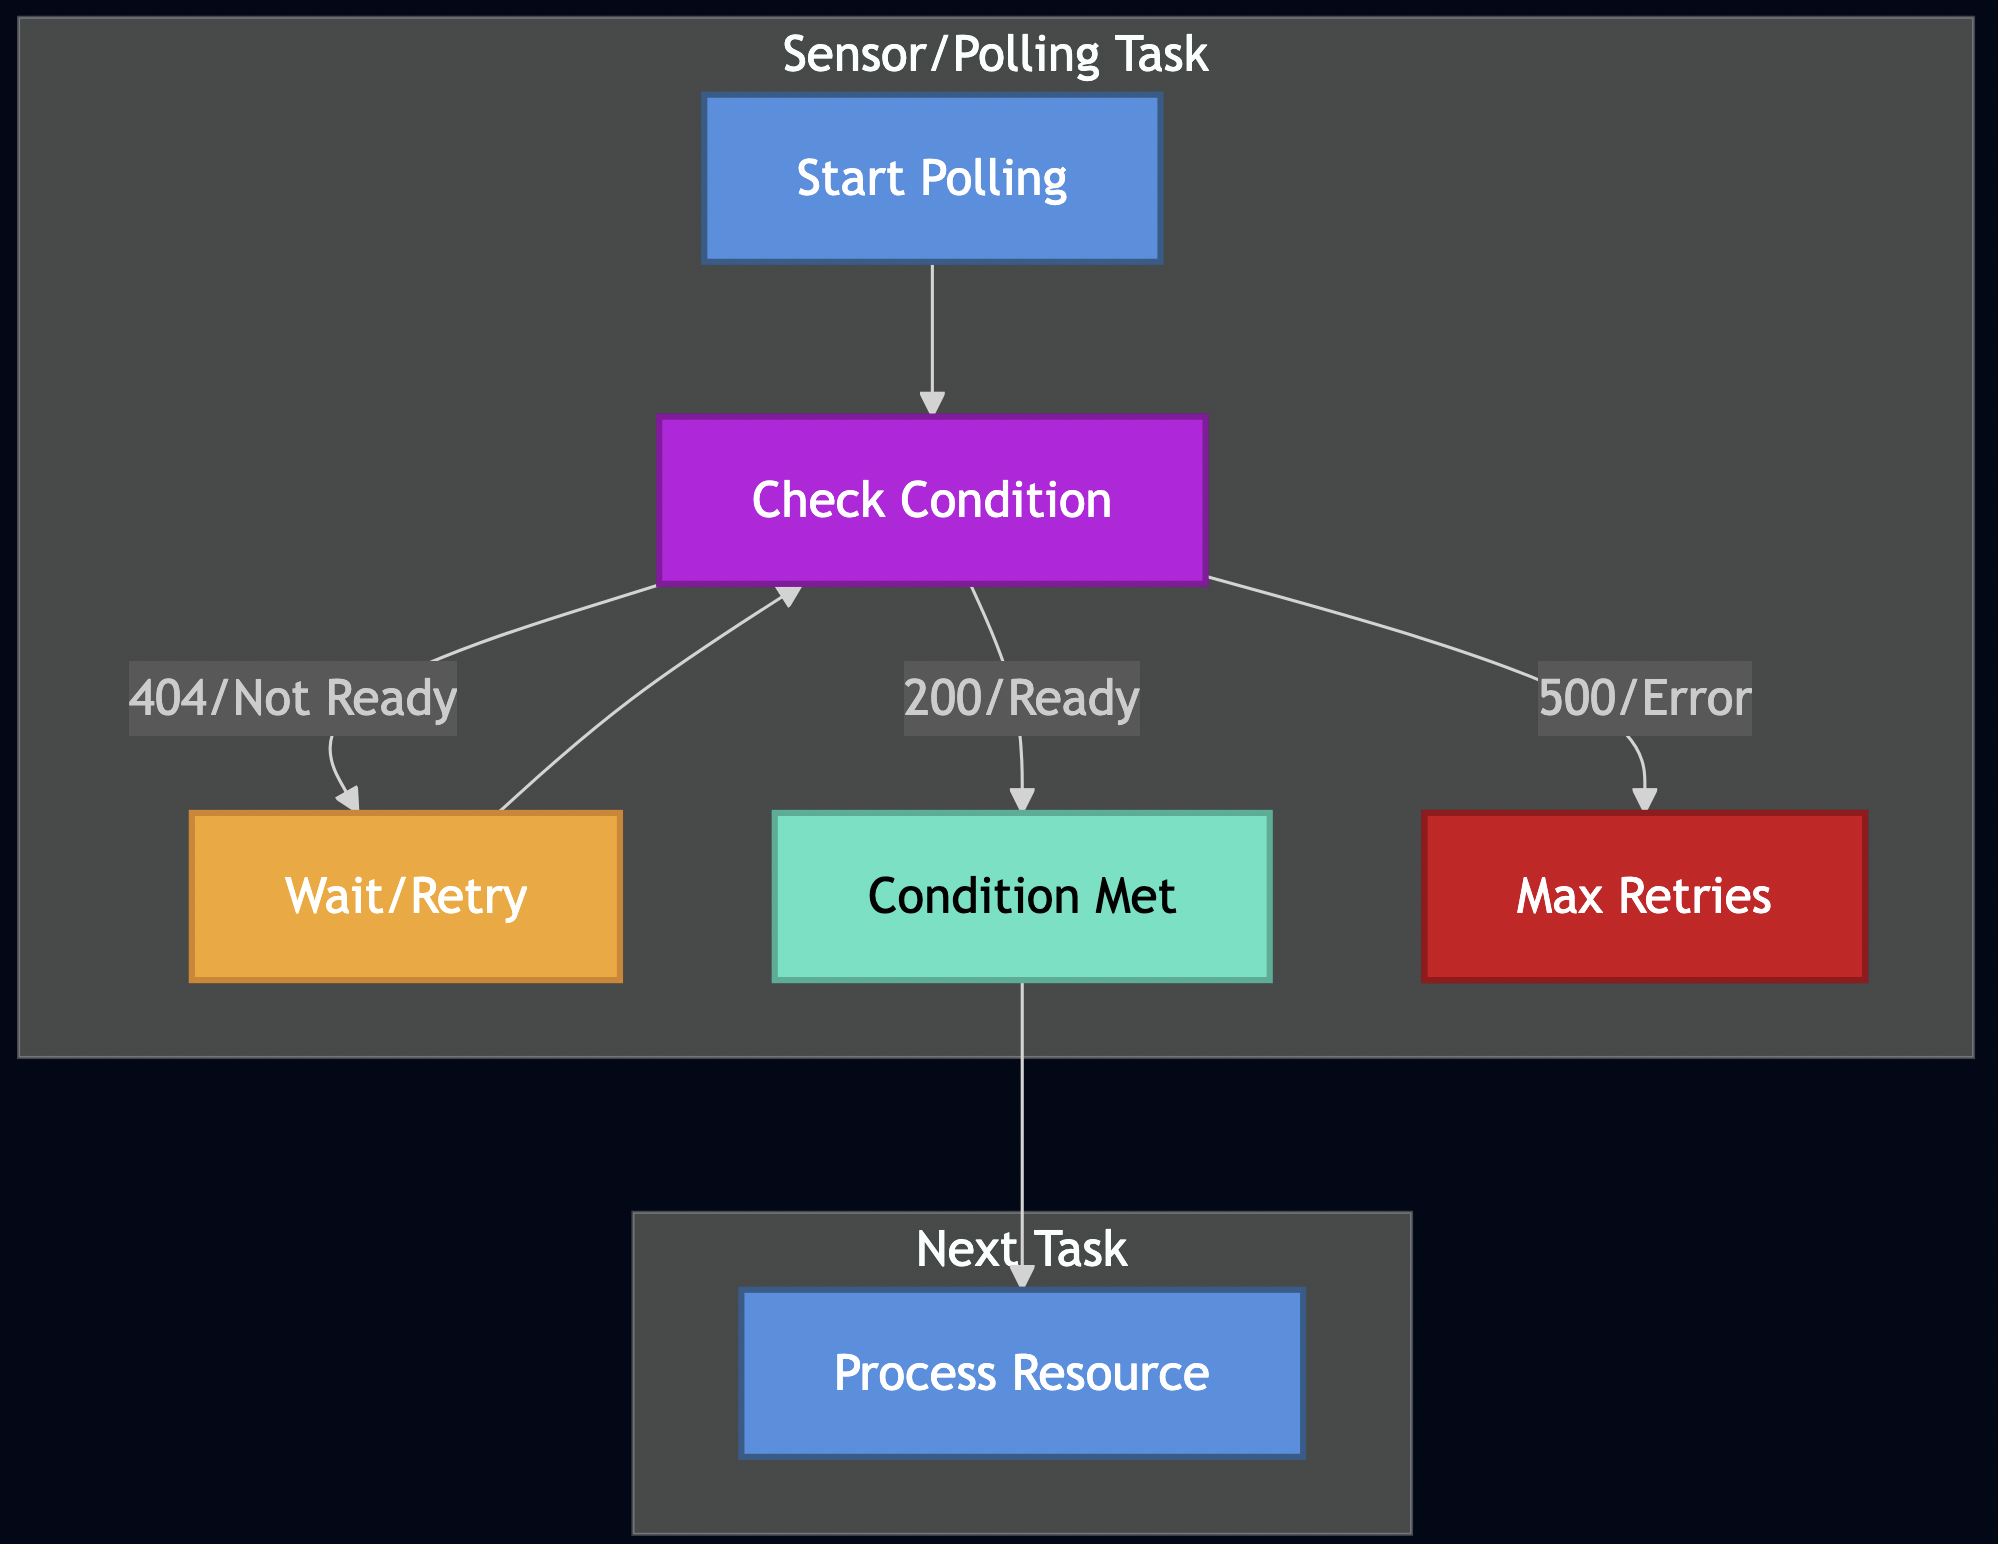
11: Polling and Sensors
Beyond time-based delays, Formicary supports condition-based scheduling through polling sensors that wait for external conditions to be met:
job_type: sensor-job
description: Wait for external conditions before proceeding
tasks:
  - task_type: wait-for-resource
    method: HTTP_GET
    url: https://api.example.com/resource/123
    delay_between_retries: 15s
    retry: 20  # Poll up to 20 times (5 minutes total)
    timeout: 15s
    on_exit_code:
      "200": process-resource    # Success - proceed
      "404": EXECUTING          # Resource not ready - poll again
      "FAILED": FATAL           # Server error - abort job

  - task_type: process-resource
    method: DOCKER
    container:
      image: data-processor:latest
    script:
      - echo "Resource is now available, processing..."
The key insight is using EXECUTING as an exit code value, which keeps the task in a polling loop rather than completing or failing.
12. Gang Scheduling
Gang scheduling coordinates simultaneous execution of related tasks that need to communicate or synchronize. Instead of scheduling tasks independently, the system reserves resources for all tasks in a “gang” and schedules them together to avoid partial execution and resource deadlocks. Key principles include:
- All-or-Nothing (MPI Applications): Either all tasks in the gang get scheduled or none do
- Synchronized Start: Tasks begin execution simultaneously
- Resource Reservation (Kubernetes Jobs): Pre-allocate resources for the entire task group
- Communication Optimization: Minimize synchronization delays between related tasks
Gang_Size = max(task_count, critical_path_parallelism)
Resource_Requirement = ?(individual_task_resources) for all gang members
Schedulability = available_resources >= Resource_Requirement
Formicary’s Gang Scheduling Implementation: Formicary implements gang scheduling at the job level through its Resource Manager. When a job is scheduled, resources are pre-allocated for ALL tasks before execution begins:
// Core gang scheduling logic from ResourceManager
func (rm *ManagerImpl) doReserveJobResources(
	requestID string,
	def *types.JobDefinition,
	dryRun bool) (reservations map[string]*common.AntReservation, err error) {

	reservations = make(map[string]*common.AntReservation)
	var alloc *common.AntReservation

	// Try to reserve resources for each task
	for _, task := range def.Tasks {
		alloc, err = rm.doReserve(requestID, task.TaskType, task.Method, task.Tags, dryRun)
		if err == nil {
			reservations[task.TaskType] = alloc
		} else {
			if !dryRun {
				// ALL-OR-NOTHING: Release all allocations and fail entire job
				_ = rm.ReleaseJobResources(requestID)
			}
			return nil, err
		}
	}
	return reservations, nil
}
Two-Phase Gang Scheduling Process:
- Resource Check Phase (Dry Run):
// Check if all job resources are available without allocating
func (rm *ManagerImpl) CheckJobResources(job *types.JobDefinition) ([]*common.AntReservation, error) {
	if reservationsByTask, err := rm.doReserveJobResources("", job, true); err != nil {
		return nil, err // Gang scheduling not possible
	}
	// All tasks can be scheduled - proceed to actual reservation
}
- Resource Reservation Phase (Actual Allocation):
// Atomically reserve resources for all tasks
func (rm *ManagerImpl) ReserveJobResources(requestID string, def *types.JobDefinition) (map[string]*common.AntReservation, error) {
	return rm.doReserveJobResources(requestID, def, false)
}
Scheduler Integration with Gang Scheduling:
The Job Scheduler uses gang scheduling through a two-step verification process:
// Step 1: Check if gang scheduling is possible
if err = jobStateMachine.CheckAntResourcesAndConcurrencyForJob(); err != nil {
	// Gang scheduling failed - implement backoff strategy
	scheduleAttempts := request.ScheduleAttempts + 1
	scheduleSecs := math.Min(int(maxWait.Seconds()), scheduleAttempts*5)

	// Exponential backoff with priority degradation
	if scheduleAttempts >= 5 && scheduleAttempts%5 == 0 && request.JobPriority > 5 {
		request.JobPriority-- // Degrade priority every 5th attempt
	}

	request.ScheduledAt = request.ScheduledAt.Add(time.Duration(scheduleSecs) * time.Second)
	return fmt.Errorf("gang scheduling failed - will retry")
}

// Step 2: Perform actual gang scheduling
if err = jobStateMachine.ReserveJobResources(); err != nil {
	// Even after check, allocation failed - very rare race condition
	return fmt.Errorf("gang allocation failed after successful check")
}
Example Job with Gang Scheduling:
job_type: distributed-ml-training
description: Gang scheduled ML training requiring coordinated execution
tasks:
  - task_type: parameter-server
    method: KUBERNETES
    tags: ["ml-cluster", "coordinator"]
    container:
      image: tensorflow:latest
      cpu_request: "4"
      memory_request: "8Gi"

  - task_type: worker-node-1
    method: KUBERNETES
    tags: ["ml-cluster", "gpu-enabled"]
    container:
      image: tensorflow:gpu
      cpu_request: "8"
      memory_request: "16Gi"

  - task_type: worker-node-2
    method: KUBERNETES
    tags: ["ml-cluster", "gpu-enabled"]
    container:
      image: tensorflow:gpu
      cpu_request: "8"
      memory_request: "16Gi"

  - task_type: aggregator
    method: KUBERNETES
    tags: ["ml-cluster"]
    dependencies: ["parameter-server", "worker-node-1", "worker-node-2"]
Formicary’s Gang Scheduling Features:
- Atomic Resource Allocation: All task resources are reserved simultaneously
- Automatic Rollback: Failed gang allocation releases all previously reserved resources
- Backoff Strategy: Jobs that can’t be gang-scheduled use exponential backoff
- Priority Degradation: Long-waiting jobs have priority reduced to prevent resource hogging
- Resource Fragmentation Prevention: Avoids partial allocations that waste resources
Formicary tracks gang scheduling effectiveness through metrics:
scheduler_failed_total: Jobs that couldn’t be gang-scheduledscheduler_no_more_jobs_total: Scheduler iterations with no schedulable jobs- Schedule attempts per job to identify resource contention patterns
Pros:
- Eliminates partial execution and resource deadlocks
- Optimal for tightly-coupled distributed workloads
- Automatic retry with intelligent backoff
- Priority-based fairness with degradation
Cons:
- Can lead to resource underutilization
- Higher latency for large job gangs
- Complex resource accounting and cleanup
- May cause convoy effects for large jobs
Integration with Other Algorithms: Gang scheduling in Formicary works alongside:
- Priority Scheduling: Higher priority gangs get resources first
- Resource-Aware Scheduling: Considers total gang resource requirements
- Fair Scheduling: Gang resource consumption counted toward tenant quotas
- Capacity Scheduling: Gangs compete for available cluster capacity
Advanced Scheduling Patterns
Hybrid Scheduling Strategy
In practice, Formicary often combines multiple scheduling algorithms:
job_type: hybrid-ml-pipeline
priority: 8                    # Priority scheduling
max_concurrency: 3             # Capacity scheduling
tags: ["gpu-cluster"]          # Matchmaking
cron_trigger: "0 */6 * * *"    # Delay scheduling
tasks:
  - task_type: data-preprocessing
    tags: ["cpu-optimized"]     # Multilevel queues
    method: KUBERNETES
    container:
      cpu_request: "2"          # Resource-aware
      memory_request: "4Gi"

  - task_type: model-training
    tags: ["gpu-optimized"]
    method: KUBERNETES
    container:
      image: tensorflow:gpu
    dependencies: ["data-preprocessing"]
Fork-Join Pattern for Parallel Processing
Formicary supports sophisticated parallel execution patterns:
job_type: parallel-video-encoding
description: Parallel processing with fork-join
tasks:
  - task_type: split-video
    method: DOCKER
    container:
      image: ffmpeg:latest
    script:
      - ffmpeg -i input.mp4 -f segment segment_%03d.mp4
    on_completed: fork-encode

  - task_type: fork-encode
    method: FORK_JOB
    fork_job_type: encode-segment
    variables:
      segment_count: 8
    on_completed: await-encoding

  - task_type: await-encoding
    method: AWAIT_FORKED_JOB
    await_forked_tasks: ["fork-encode"]
    on_completed: merge-video

  - task_type: merge-video
    method: DOCKER
    container:
      image: ffmpeg:latest
    script:
      - ffmpeg -f concat -i segments.txt -c copy output.mp4
Performance Optimizations
Cache-Aware Scheduling
Formicary supports dependency caching to improve scheduling efficiency:
job_type: node-build
tasks:
  - task_type: install-deps
    method: DOCKER
    container:
      image: node:16
    cache:
      key: "node-deps-{{checksum 'package-lock.json'}}"
      paths:
        - node_modules
    script:
      - npm ci
Artifact-Based Dependencies
Smart scheduling based on artifact availability:
job_type: deployment-pipeline
tasks:
  - task_type: build
    artifacts:
      paths: ["dist/"]

  - task_type: test
    dependencies: ["build"]  # Waits for build artifacts

  - task_type: deploy
    dependencies: ["test"]
    method: KUBERNETES
Monitoring and Observability
Effective scheduling requires comprehensive monitoring:
# Built-in metrics and alerts
metrics:
  - queue_depth_by_priority
  - average_wait_time_by_tag
  - resource_utilization_by_worker
  - job_completion_rate_by_tenant

alerts:
  - name: high_queue_depth
    condition: queue_depth > 1000
    action: scale_workers

  - name: poor_resource_utilization
    condition: cpu_utilization < 30%
    action: consolidate_workers
Real-World Case Study: Mobile Security Analysis Platform
At a mobile security company, I implemented a similar system with three-tier scheduling:
Tier 1: Preflight Analysis (Fast Queue)
- Duration: 30 seconds – 2 minutes
- Workers: CPU-optimized containers
- Algorithm: Priority + FCFS
- Use Case: Basic file validation, metadata extraction
Tier 2: Static Analysis (Medium Queue)
- Duration: 5 minutes – 1 hour
- Workers: Memory-optimized containers
- Algorithm: Resource-aware + Fair scheduling
- Use Case: Code analysis, vulnerability scanning
Tier 3: Dynamic Analysis (Heavy Queue)
- Duration: 1 – 8 hours
- Workers: GPU-enabled device farm
- Algorithm: Matchmaking + Capacity scheduling
- Use Case: Runtime behavior analysis, ML inference
This architecture processed over 100,000 mobile apps daily with 99.9% availability and optimal resource utilization.
Best Practices and Lessons Learned
1. Start Simple, Scale Gradually
Begin with FCFS and basic priority scheduling. Add complexity as your workload characteristics become clear.
2. Observability
Track queue depths, wait times, resource utilization, and job completion rates by different dimensions (tenant, job type, worker pool).
3. Design for Elasticity
Use Kubernetes HPA and custom metrics to automatically scale worker pools based on queue depth and resource utilization.
4. Implement Circuit Breakers
Prevent cascading failures when downstream services are unavailable.
5. Use Dead Letter Queues
Handle persistently failing tasks gracefully:
error_handling:
  max_retries: 3
  dead_letter_queue: "failed-jobs"
  alert_on_dlq: true
- Earliest Deadline First: For time-sensitive workflows
- Speculative Execution: For fault tolerance and performance
- Gang Scheduling: For tightly-coupled parallel jobs
Conclusion
Formicary demonstrates how theoretical scheduling algorithms translate into practical distributed systems. It combines multiple strategies—priority scheduling, resource awareness, fair sharing, and intelligent routing for handling diverse workloads while maintaining predictable performance. The key insight is that real-world schedulers rarely use a single algorithm. Instead, they combine multiple approaches, leveraging the strengths of each for different aspects of the scheduling problem. Tags and labels provide the flexibility to implement sophisticated routing logic, while Kubernetes integration enables resource-aware scheduling at scale.
Whether you’re building CI/CD pipelines, data processing workflows, or ML training systems, understanding these scheduling patterns and their trade-offs is crucial for designing systems that scale efficiently and reliably.
Formicary is open source and available at github.com/bhatti/formicary. Try it out for your next workflow automation project!