Introduction
In the world of cloud-native applications, service lifecycle management is often an afterthought—until it causes a production outage. Whether you’re running gRPC or REST APIs on Kubernetes with Istio, proper lifecycle management is the difference between smooth deployments and 3 AM incident calls. Consider these scenarios:
- Your service takes 45 seconds to warm up its cache, but Kubernetes kills it after 30 seconds of startup wait.
- During deployments, clients receive connection errors as pods terminate abruptly.
- A hiccup in a database or dependent service causes your entire service mesh to cascade fail.
- Your service mesh sidecar shuts down before your application is terminated or drops in-flight requests.
- A critical service receives SIGKILL during transaction processing, leaving data in inconsistent states.
- After a regional outage, services restart but data drift goes undetected for hours.
- Your RTO target is 15 seconds, but services take 30 seconds just to start up properly.
These aren’t edge cases—they’re common problems that proper lifecycle management solves. More critically, unsafe shutdowns can cause data corruption, financial losses, and breach compliance requirements. This guide covers what you need to know about building services that start safely, shut down gracefully, and handle failures intelligently.
The Hidden Complexity of Service Lifecycles
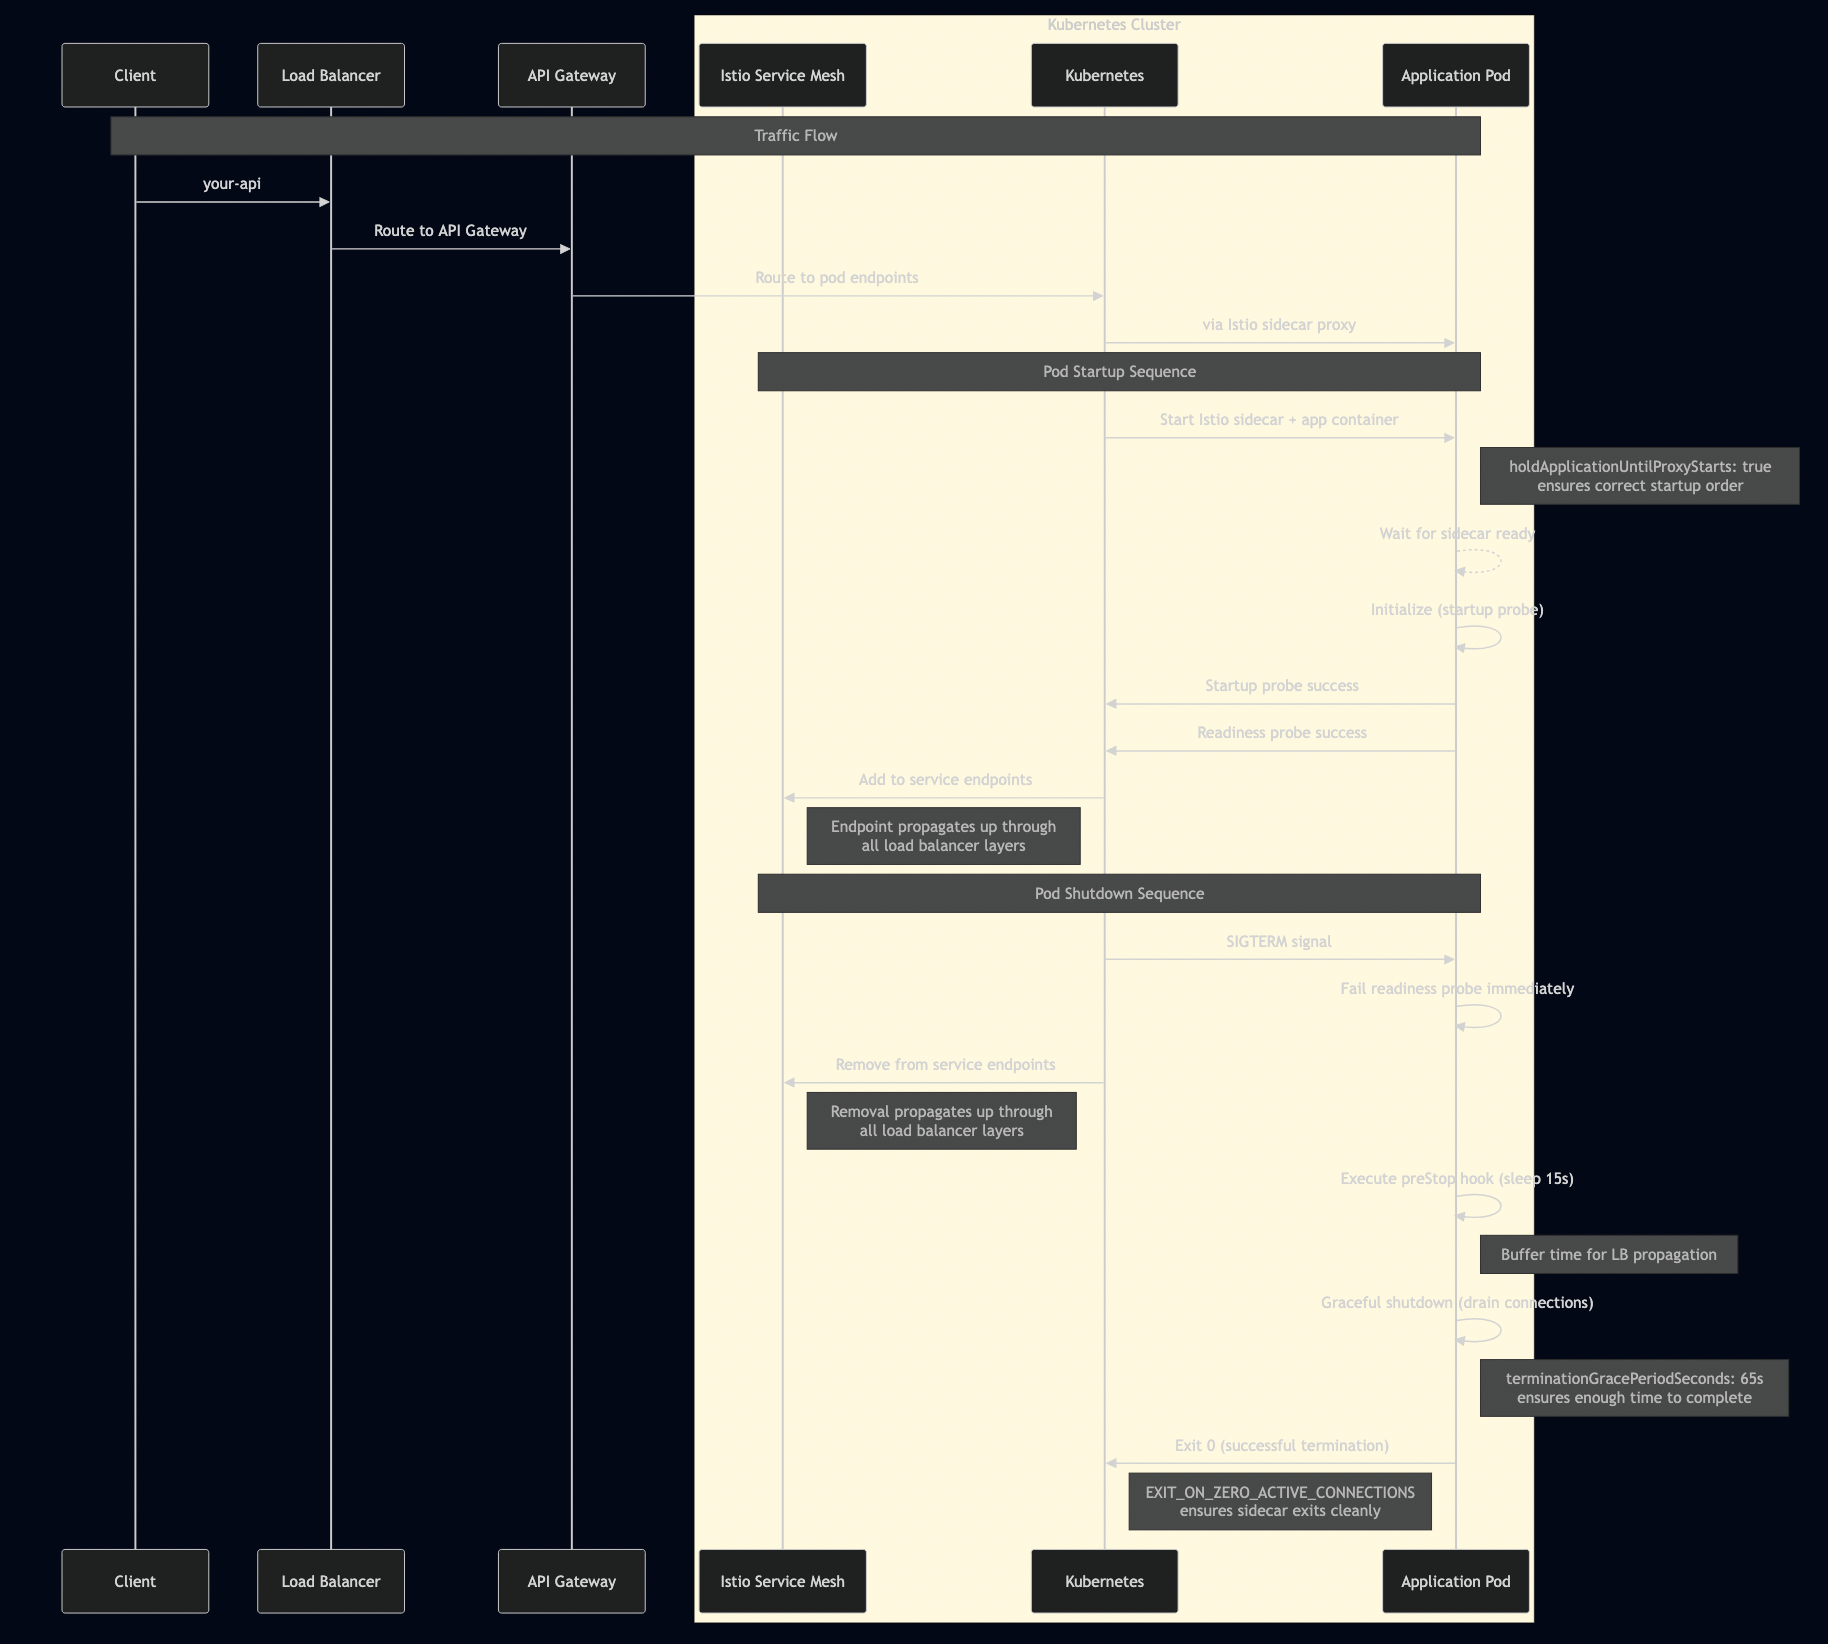
Modern microservices don’t exist in isolation. A typical request might flow through:
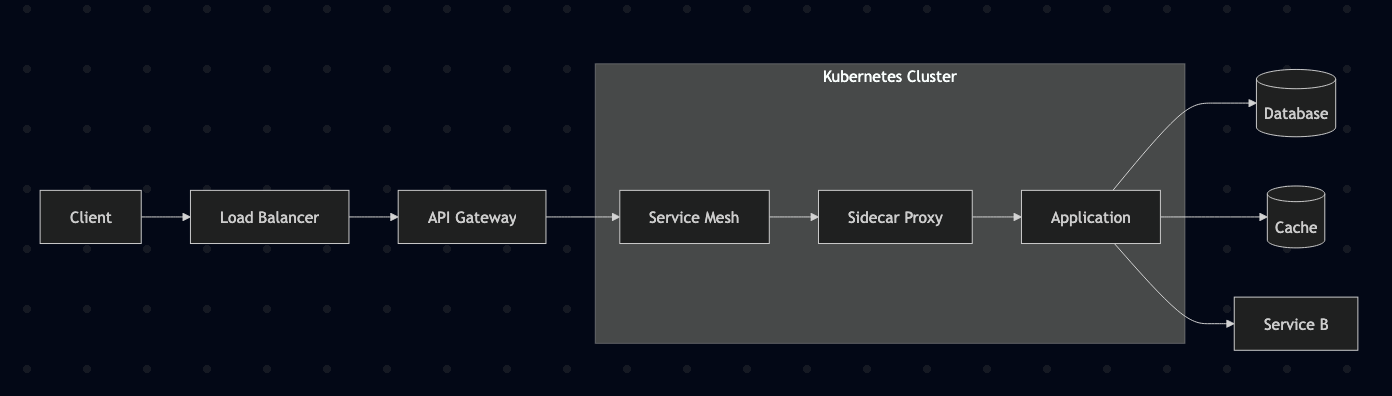
Each layer adds complexity to startup and shutdown sequences. Without proper coordination, you’ll experience:
- Startup race conditions: Application tries to make network calls before the sidecar proxy is ready
- Shutdown race conditions: Sidecar terminates while the application is still processing requests
- Premature traffic: Load balancer routes traffic before the application is truly ready
- Dropped connections: Abrupt shutdowns leave clients hanging
- Data corruption: In-flight transactions get interrupted, leaving databases in inconsistent states
- Compliance violations: Financial services may face regulatory penalties for data integrity failures
Core Concepts: The Three Types of Health Checks
Kubernetes provides three distinct probe types, each serving a specific purpose:
1. Liveness Probe: “Is the process alive?”
- Detects deadlocks and unrecoverable states
- Should be fast and simple (e.g., HTTP GET /healthz)
- Failure triggers container restart
- Common mistake: Making this check too complex
2. Readiness Probe: “Can the service handle traffic?”
- Validates all critical dependencies are available
- Prevents routing traffic to pods that aren’t ready
- Should perform “deep” checks of dependencies
- Common mistake: Using the same check as liveness
3. Startup Probe: “Is the application still initializing?”
- Provides grace period for slow-starting containers
- Disables liveness/readiness probes until successful
- Prevents restart loops during initialization
- Common mistake: Not using it for slow-starting apps
The Hidden Dangers of Unsafe Shutdowns
While graceful shutdown is ideal, it’s not always possible. Kubernetes will send SIGKILL after the termination grace period, and infrastructure failures can terminate pods instantly. This creates serious risks:
Data Corruption Scenarios
Financial Transaction Example:
// DANGEROUS: Non-atomic operation
func (s *PaymentService) ProcessPayment(req *PaymentRequest) error {
    // Step 1: Debit source account
    if err := s.debitAccount(req.FromAccount, req.Amount); err != nil {
        return err
    }

    // ???? SIGKILL here leaves money debited but not credited
    // Step 2: Credit destination account
    if err := s.creditAccount(req.ToAccount, req.Amount); err != nil {
        // Money is lost! Source debited but destination not credited
        return err
    }

    // Step 3: Record transaction
    return s.recordTransaction(req)
}
E-commerce Inventory Example:
// DANGEROUS: Race condition during shutdown
func (s *InventoryService) ReserveItem(req *ReserveRequest) error {
    // Check availability
    if s.getStock(req.ItemID) < req.Quantity {
        return ErrInsufficientStock
    }

    // ???? SIGKILL here can cause double-reservation
    // Another request might see the same stock level

    // Reserve the item
    return s.updateStock(req.ItemID, -req.Quantity)
}
RTO/RPO Impact
Recovery Time Objective (RTO): How quickly can we restore service?
- Poor lifecycle management increases startup time
- Services may need manual intervention to reach consistent state
- Cascading failures extend recovery time across the entire system
Recovery Point Objective (RPO): How much data can we afford to lose?
- Unsafe shutdowns can corrupt recent transactions
- Without idempotency, replay of messages may create duplicates
- Data inconsistencies may not be detected until much later
The Anti-Entropy Solution
Since graceful shutdown isn’t always possible, production systems need reconciliation processes to detect and repair inconsistencies:
// Anti-entropy pattern for data consistency
type ReconciliationService struct {
    paymentDB    PaymentDatabase
    accountDB    AccountDatabase
    auditLog     AuditLogger
    alerting     AlertingService
}

func (r *ReconciliationService) ReconcilePayments(ctx context.Context) error {
    // Find payments without matching account entries
    orphanedPayments, err := r.paymentDB.FindOrphanedPayments(ctx)
    if err != nil {
        return err
    }

    for _, payment := range orphanedPayments {
        // Check if this was a partial transaction
        sourceDebit, _ := r.accountDB.GetTransaction(payment.FromAccount, payment.ID)
        destCredit, _ := r.accountDB.GetTransaction(payment.ToAccount, payment.ID)

        switch {
        case sourceDebit != nil && destCredit == nil:
            // Complete the transaction
            if err := r.creditAccount(payment.ToAccount, payment.Amount); err != nil {
                r.alerting.SendAlert("Failed to complete orphaned payment", payment.ID)
                continue
            }
            r.auditLog.RecordReconciliation("completed_payment", payment.ID)

        case sourceDebit == nil && destCredit != nil:
            // Reverse the credit
            if err := r.debitAccount(payment.ToAccount, payment.Amount); err != nil {
                r.alerting.SendAlert("Failed to reverse orphaned credit", payment.ID)
                continue
            }
            r.auditLog.RecordReconciliation("reversed_credit", payment.ID)

        default:
            // Both or neither exist - needs investigation
            r.alerting.SendAlert("Ambiguous payment state", payment.ID)
        }
    }

    return nil
}

// Run reconciliation periodically
func (r *ReconciliationService) Start(ctx context.Context) {
    ticker := time.NewTicker(5 * time.Minute)
    defer ticker.Stop()

    for {
        select {
        case <-ctx.Done():
            return
        case <-ticker.C:
            if err := r.ReconcilePayments(ctx); err != nil {
                log.Printf("Reconciliation failed: %v", err)
            }
        }
    }
}
Building a Resilient Service: Complete Example
Let’s build a production-ready service that demonstrates all best practices. We’ll create two versions: one with anti-patterns (bad-service) and one with best practices (good-service).
The Application Code
//go:generate protoc --go_out=. --go_opt=paths=source_relative --go-grpc_out=. --go-grpc_opt=paths=source_relative api/demo.proto

package main

import (
    "context"
    "flag"
    "fmt"
    "log"
    "net"
    "net/http"
    "os"
    "os/signal"
    "sync/atomic"
    "syscall"
    "time"

    "google.golang.org/grpc"
    "google.golang.org/grpc/codes"
    health "google.golang.org/grpc/health/grpc_health_v1"
    "google.golang.org/grpc/status"
)

// Service represents our application with health state
type Service struct {
    isHealthy         atomic.Bool
    isShuttingDown    atomic.Bool
    activeRequests    atomic.Int64
    dependencyHealthy atomic.Bool
}

// HealthChecker implements the gRPC health checking protocol
type HealthChecker struct {
    svc *Service
}

func (h *HealthChecker) Check(ctx context.Context, req *health.HealthCheckRequest) (*health.HealthCheckResponse, error) {
    service := req.GetService()

    // Liveness: Simple check - is the process responsive?
    if service == "" || service == "liveness" {
        if h.svc.isShuttingDown.Load() {
            return &health.HealthCheckResponse{
                Status: health.HealthCheckResponse_NOT_SERVING,
            }, nil
        }
        return &health.HealthCheckResponse{
            Status: health.HealthCheckResponse_SERVING,
        }, nil
    }

    // Readiness: Deep check - can we handle traffic?
    if service == "readiness" {
        // Check application health
        if !h.svc.isHealthy.Load() {
            return &health.HealthCheckResponse{
                Status: health.HealthCheckResponse_NOT_SERVING,
            }, nil
        }

        // Check critical dependencies
        if !h.svc.dependencyHealthy.Load() {
            return &health.HealthCheckResponse{
                Status: health.HealthCheckResponse_NOT_SERVING,
            }, nil
        }

        // Check if shutting down
        if h.svc.isShuttingDown.Load() {
            return &health.HealthCheckResponse{
                Status: health.HealthCheckResponse_NOT_SERVING,
            }, nil
        }

        return &health.HealthCheckResponse{
            Status: health.HealthCheckResponse_SERVING,
        }, nil
    }

    // Synthetic readiness: Complex business logic check for monitoring
    if service == "synthetic-readiness" {
        // Simulate a complex health check that validates business logic
        // This would make actual API calls, database queries, etc.
        if !h.performSyntheticCheck(ctx) {
            return &health.HealthCheckResponse{
                Status: health.HealthCheckResponse_NOT_SERVING,
            }, nil
        }
        return &health.HealthCheckResponse{
            Status: health.HealthCheckResponse_SERVING,
        }, nil
    }

    return nil, status.Errorf(codes.NotFound, "unknown service: %s", service)
}

func (h *HealthChecker) performSyntheticCheck(ctx context.Context) bool {
    // In a real service, this would:
    // 1. Create a test transaction
    // 2. Query the database
    // 3. Call dependent services
    // 4. Validate the complete flow works
    return h.svc.isHealthy.Load() && h.svc.dependencyHealthy.Load()
}

func (h *HealthChecker) Watch(req *health.HealthCheckRequest, server health.Health_WatchServer) error {
    return status.Error(codes.Unimplemented, "watch not implemented")
}

// DemoServiceServer implements your business logic
type DemoServiceServer struct {
    UnimplementedDemoServiceServer
    svc *Service
}

func (s *DemoServiceServer) ProcessRequest(ctx context.Context, req *ProcessRequest) (*ProcessResponse, error) {
    s.svc.activeRequests.Add(1)
    defer s.svc.activeRequests.Add(-1)

    // Simulate processing
    select {
    case <-ctx.Done():
        return nil, ctx.Err()
    case <-time.After(100 * time.Millisecond):
        return &ProcessResponse{
            Result: fmt.Sprintf("Processed: %s", req.GetData()),
        }, nil
    }
}

func main() {
    var (
        port         = flag.Int("port", 8080, "gRPC port")
        mgmtPort     = flag.Int("mgmt-port", 8090, "Management port")
        startupDelay = flag.Duration("startup-delay", 10*time.Second, "Startup delay")
    )
    flag.Parse()

    svc := &Service{}
    svc.dependencyHealthy.Store(true) // Assume healthy initially

    // Management endpoints for testing
    mux := http.NewServeMux()
    mux.HandleFunc("/toggle-health", func(w http.ResponseWriter, r *http.Request) {
        current := svc.dependencyHealthy.Load()
        svc.dependencyHealthy.Store(!current)
        fmt.Fprintf(w, "Dependency health toggled to: %v\n", !current)
    })
    mux.HandleFunc("/metrics", func(w http.ResponseWriter, r *http.Request) {
        fmt.Fprintf(w, "active_requests %d\n", svc.activeRequests.Load())
        fmt.Fprintf(w, "is_healthy %v\n", svc.isHealthy.Load())
        fmt.Fprintf(w, "is_shutting_down %v\n", svc.isShuttingDown.Load())
    })

    mgmtServer := &http.Server{
        Addr:    fmt.Sprintf(":%d", *mgmtPort),
        Handler: mux,
    }

    // Start management server
    go func() {
        log.Printf("Management server listening on :%d", *mgmtPort)
        if err := mgmtServer.ListenAndServe(); err != http.ErrServerClosed {
            log.Fatalf("Management server failed: %v", err)
        }
    }()

    // Simulate slow startup
    log.Printf("Starting application (startup delay: %v)...", *startupDelay)
    time.Sleep(*startupDelay)
    svc.isHealthy.Store(true)
    log.Println("Application initialized and ready")

    // Setup gRPC server
    lis, err := net.Listen("tcp", fmt.Sprintf(":%d", *port))
    if err != nil {
        log.Fatalf("Failed to listen: %v", err)
    }

    grpcServer := grpc.NewServer()
    RegisterDemoServiceServer(grpcServer, &DemoServiceServer{svc: svc})
    health.RegisterHealthServer(grpcServer, &HealthChecker{svc: svc})

    // Start gRPC server
    go func() {
        log.Printf("gRPC server listening on :%d", *port)
        if err := grpcServer.Serve(lis); err != nil {
            log.Fatalf("gRPC server failed: %v", err)
        }
    }()

    // Wait for shutdown signal
    sigCh := make(chan os.Signal, 1)
    signal.Notify(sigCh, syscall.SIGINT, syscall.SIGTERM)
    sig := <-sigCh

    log.Printf("Received signal: %v, starting graceful shutdown...", sig)

    // Graceful shutdown sequence
    svc.isShuttingDown.Store(true)
    svc.isHealthy.Store(false) // Fail readiness immediately

    // Stop accepting new requests
    grpcServer.GracefulStop()

    // Wait for active requests to complete
    timeout := time.After(30 * time.Second)
    ticker := time.NewTicker(100 * time.Millisecond)
    defer ticker.Stop()

    for {
        select {
        case <-timeout:
            log.Println("Shutdown timeout reached, forcing exit")
            os.Exit(1)
        case <-ticker.C:
            active := svc.activeRequests.Load()
            if active == 0 {
                log.Println("All requests completed")
                goto shutdown
            }
            log.Printf("Waiting for %d active requests to complete...", active)
        }
    }

shutdown:
    // Cleanup
    ctx, cancel := context.WithTimeout(context.Background(), 5*time.Second)
    defer cancel()
    mgmtServer.Shutdown(ctx)

    log.Println("Graceful shutdown complete")
}
Kubernetes Manifests: Anti-Patterns vs Best Practices
Bad Service (Anti-Patterns)
apiVersion: apps/v1
kind: Deployment
metadata:
  name: bad-service
  namespace: demo
spec:
  replicas: 2
  selector:
    matchLabels:
      app: bad-service
  template:
    metadata:
      labels:
        app: bad-service
      # MISSING: Critical Istio annotations!
    spec:
      # DEFAULT: Only 30s grace period
      containers:
      - name: app
        image: myregistry/demo-service:latest
        ports:
        - containerPort: 8080
          name: grpc
        - containerPort: 8090
          name: mgmt
        args: ["--startup-delay=45s"]  # Longer than default probe timeout!

        # ANTI-PATTERN: Identical liveness and readiness probes
        livenessProbe:
          exec:
            command: ["/bin/grpc_health_probe", "-addr=:8080"]
          initialDelaySeconds: 10
          periodSeconds: 10
          failureThreshold: 3  # Will fail after 40s total

        readinessProbe:
          exec:
            command: ["/bin/grpc_health_probe", "-addr=:8080"]  # Same as liveness!
          initialDelaySeconds: 10
          periodSeconds: 10

        # MISSING: No startup probe for slow initialization
        # MISSING: No preStop hook for graceful shutdown
Good Service (Best Practices)
apiVersion: apps/v1
kind: Deployment
metadata:
  name: good-service
  namespace: demo
spec:
  replicas: 2
  selector:
    matchLabels:
      app: good-service
  template:
    metadata:
      labels:
        app: good-service
      annotations:
        # Critical for Istio/Envoy sidecar lifecycle management
        sidecar.istio.io/holdApplicationUntilProxyStarts: "true"
        proxy.istio.io/config: |
          proxyMetadata:
            EXIT_ON_ZERO_ACTIVE_CONNECTIONS: "true"
        sidecar.istio.io/proxyCPU: "100m"
        sidecar.istio.io/proxyMemory: "128Mi"
    spec:
      # Extended grace period: preStop (15s) + app shutdown (30s) + buffer (20s)
      terminationGracePeriodSeconds: 65

      containers:
      - name: app
        image: myregistry/demo-service:latest
        ports:
        - containerPort: 8080
          name: grpc
        - containerPort: 8090
          name: mgmt
        args: ["--startup-delay=45s"]

        # Resource management for predictable performance
        resources:
          requests:
            cpu: 100m
            memory: 128Mi
          limits:
            cpu: 500m
            memory: 512Mi

        # Startup probe for slow initialization
        startupProbe:
          exec:
            command: ["/bin/grpc_health_probe", "-addr=:8080", "-service=readiness"]
          initialDelaySeconds: 0
          periodSeconds: 5
          failureThreshold: 24  # 5s * 24 = 120s total startup time
          successThreshold: 1

        # Simple liveness check
        livenessProbe:
          exec:
            command: ["/bin/grpc_health_probe", "-addr=:8080", "-service=liveness"]
          initialDelaySeconds: 0  # Startup probe handles initialization
          periodSeconds: 10
          failureThreshold: 3
          timeoutSeconds: 5

        # Deep readiness check
        readinessProbe:
          exec:
            command: ["/bin/grpc_health_probe", "-addr=:8080", "-service=readiness"]
          initialDelaySeconds: 0
          periodSeconds: 5
          failureThreshold: 2
          successThreshold: 1
          timeoutSeconds: 5

        # Graceful shutdown coordination
        lifecycle:
          preStop:
            exec:
              command: ["/bin/sh", "-c", "sleep 15"]  # Allow LB to drain

        # Environment variables for cloud provider integration
        env:
        - name: CLOUD_PROVIDER
          value: "auto-detect"  # Works with GCP, AWS, Azure
        - name: ENABLE_PROFILING
          value: "true"
Istio Service Mesh: Beyond Basic Lifecycle Management
While proper health checks and graceful shutdown are foundational, Istio adds critical production-grade capabilities that dramatically improve fault tolerance:
Automatic Retries and Circuit Breaking
apiVersion: networking.istio.io/v1alpha3
kind: DestinationRule
metadata:
  name: payment-service
  namespace: demo
spec:
  host: payment-service.demo.svc.cluster.local
  trafficPolicy:
    connectionPool:
      tcp:
        maxConnections: 100
      http:
        http1MaxPendingRequests: 100
        maxRequestsPerConnection: 2
    circuitBreaker:
      consecutiveErrors: 5
      interval: 30s
      baseEjectionTime: 30s
      maxEjectionPercent: 50
    retryPolicy:
      attempts: 3
      perTryTimeout: 2s
      retryOn: 5xx,gateway-error,connect-failure,refused-stream
      retryRemoteLocalities: true
Key Benefits for Production Systems
- Automatic Request Retries: If a pod fails or becomes unavailable, Istio automatically retries requests to healthy instances
- Circuit Breaking: Prevents cascading failures by temporarily cutting off traffic to unhealthy services
- Load Balancing: Distributes traffic intelligently across healthy pods
- Mutual TLS: Secures service-to-service communication without code changes
- Observability: Provides detailed metrics, tracing, and logging for all inter-service communication
- Canary Deployments: Enables safe rollouts with automatic traffic shifting
- Rate Limiting: Protects services from being overwhelmed
- Timeout Management: Prevents hanging requests with configurable timeouts
Termination Grace Period Calculation
The critical formula for calculating termination grace periods:
terminationGracePeriodSeconds = preStop delay + application shutdown timeout + buffer

Examples:
- Simple service: 10s + 20s + 5s = 35s
- Complex service: 15s + 45s + 5s = 65s
- Batch processor: 30s + 120s + 10s = 160s
Important: Services requiring more than 90-120 seconds to shut down should be re-architected using checkpoint-and-resume patterns.
Advanced Patterns for Production
1. Idempotency: Handling Duplicate Requests
Critical for production: When pods restart or network issues occur, clients may retry requests. Without idempotency, this can cause duplicate transactions, corrupted state, or financial losses. This is mandatory for all state-modifying operations.
package idempotency

import (
    "context"
    "crypto/sha256"
    "encoding/hex"
    "time"
    "sync"
    "errors"
)

var (
    ErrDuplicateRequest = errors.New("duplicate request detected")
    ErrProcessingInProgress = errors.New("request is currently being processed")
)

// IdempotencyStore tracks request execution with persistence
type IdempotencyStore struct {
    mu        sync.RWMutex
    records   map[string]*Record
    persister PersistenceLayer // Database or Redis for durability
}

type Record struct {
    Key         string
    Response    interface{}
    Error       error
    Status      ProcessingStatus
    ExpiresAt   time.Time
    CreatedAt   time.Time
    ProcessedAt *time.Time
}

type ProcessingStatus int

const (
    StatusPending ProcessingStatus = iota
    StatusProcessing
    StatusCompleted
    StatusFailed
)

// ProcessIdempotent ensures exactly-once processing semantics
func (s *IdempotencyStore) ProcessIdempotent(
    ctx context.Context,
    key string,
    ttl time.Duration,
    fn func() (interface{}, error),
) (interface{}, error) {
    // Check if we've seen this request before
    s.mu.RLock()
    record, exists := s.records[key]
    s.mu.RUnlock()

    if exists {
        switch record.Status {
        case StatusCompleted:
            if time.Now().Before(record.ExpiresAt) {
                return record.Response, record.Error
            }
        case StatusProcessing:
            return nil, ErrProcessingInProgress
        case StatusFailed:
            if time.Now().Before(record.ExpiresAt) {
                return record.Response, record.Error
            }
        }
    }

    // Mark as processing
    record = &Record{
        Key:       key,
        Status:    StatusProcessing,
        ExpiresAt: time.Now().Add(ttl),
        CreatedAt: time.Now(),
    }

    s.mu.Lock()
    s.records[key] = record
    s.mu.Unlock()

    // Persist the processing state
    if err := s.persister.Save(ctx, record); err != nil {
        return nil, err
    }

    // Execute the function
    response, err := fn()
    processedAt := time.Now()

    // Update record with result
    s.mu.Lock()
    record.Response = response
    record.Error = err
    record.ProcessedAt = &processedAt
    if err != nil {
        record.Status = StatusFailed
    } else {
        record.Status = StatusCompleted
    }
    s.mu.Unlock()

    // Persist the final state
    s.persister.Save(ctx, record)

    return response, err
}

// Example: Idempotent payment processing
func (s *PaymentService) ProcessPayment(ctx context.Context, req *PaymentRequest) (*PaymentResponse, error) {
    // Generate idempotency key from request
    key := generateIdempotencyKey(req)

    result, err := s.idempotencyStore.ProcessIdempotent(
        ctx,
        key,
        24*time.Hour, // Keep records for 24 hours
        func() (interface{}, error) {
            // Atomic transaction processing
            return s.processPaymentTransaction(ctx, req)
        },
    )

    if err != nil {
        return nil, err
    }
    return result.(*PaymentResponse), nil
}

// Atomic transaction processing
func (s *PaymentService) processPaymentTransaction(ctx context.Context, req *PaymentRequest) (*PaymentResponse, error) {
    // Use database transaction for atomicity
    tx, err := s.db.BeginTx(ctx, nil)
    if err != nil {
        return nil, err
    }
    defer tx.Rollback()

    // Step 1: Validate accounts
    if err := s.validateAccounts(ctx, tx, req); err != nil {
        return nil, err
    }

    // Step 2: Process payment atomically
    paymentID, err := s.executePayment(ctx, tx, req)
    if err != nil {
        return nil, err
    }

    // Step 3: Commit transaction
    if err := tx.Commit(); err != nil {
        return nil, err
    }

    return &PaymentResponse{
        PaymentID: paymentID,
        Status:    "completed",
        Timestamp: time.Now(),
    }, nil
}
2. Checkpoint and Resume: Long-Running Operations
For operations that may exceed the termination grace period, implement checkpointing:
package checkpoint

import (
    "context"
    "encoding/json"
    "time"
)

type CheckpointStore interface {
    Save(ctx context.Context, id string, state interface{}) error
    Load(ctx context.Context, id string, state interface{}) error
    Delete(ctx context.Context, id string) error
}

type BatchProcessor struct {
    store          CheckpointStore
    checkpointFreq int
}

type BatchState struct {
    JobID      string    `json:"job_id"`
    TotalItems int       `json:"total_items"`
    Processed  int       `json:"processed"`
    LastItem   string    `json:"last_item"`
    StartedAt  time.Time `json:"started_at"`
}

func (p *BatchProcessor) ProcessBatch(ctx context.Context, jobID string, items []string) error {
    // Try to resume from checkpoint
    state := &BatchState{JobID: jobID}
    if err := p.store.Load(ctx, jobID, state); err == nil {
        log.Printf("Resuming job %s from item %d", jobID, state.Processed)
        items = items[state.Processed:]
    } else {
        // New job
        state = &BatchState{
            JobID:      jobID,
            TotalItems: len(items),
            Processed:  0,
            StartedAt:  time.Now(),
        }
    }

    // Process items with periodic checkpointing
    for i, item := range items {
        select {
        case <-ctx.Done():
            // Save progress before shutting down
            state.LastItem = item
            return p.store.Save(ctx, jobID, state)
        default:
            // Process item
            if err := p.processItem(ctx, item); err != nil {
                return err
            }

            state.Processed++
            state.LastItem = item

            // Checkpoint periodically
            if state.Processed%p.checkpointFreq == 0 {
                if err := p.store.Save(ctx, jobID, state); err != nil {
                    log.Printf("Failed to checkpoint: %v", err)
                }
            }
        }
    }

    // Job completed, remove checkpoint
    return p.store.Delete(ctx, jobID)
}
3. Circuit Breaker Pattern for Dependencies
Protect your service from cascading failures:
package circuitbreaker

import (
    "context"
    "sync"
    "time"
)

type State int

const (
    StateClosed State = iota
    StateOpen
    StateHalfOpen
)

type CircuitBreaker struct {
    mu              sync.RWMutex
    state           State
    failures        int
    successes       int
    lastFailureTime time.Time

    maxFailures      int
    resetTimeout     time.Duration
    halfOpenRequests int
}

func (cb *CircuitBreaker) Call(ctx context.Context, fn func() error) error {
    cb.mu.RLock()
    state := cb.state
    cb.mu.RUnlock()

    if state == StateOpen {
        // Check if we should transition to half-open
        cb.mu.Lock()
        if time.Since(cb.lastFailureTime) > cb.resetTimeout {
            cb.state = StateHalfOpen
            cb.successes = 0
            state = StateHalfOpen
        }
        cb.mu.Unlock()
    }

    if state == StateOpen {
        return ErrCircuitOpen
    }

    err := fn()

    cb.mu.Lock()
    defer cb.mu.Unlock()

    if err != nil {
        cb.failures++
        cb.lastFailureTime = time.Now()

        if cb.failures >= cb.maxFailures {
            cb.state = StateOpen
            log.Printf("Circuit breaker opened after %d failures", cb.failures)
        }
        return err
    }

    if state == StateHalfOpen {
        cb.successes++
        if cb.successes >= cb.halfOpenRequests {
            cb.state = StateClosed
            cb.failures = 0
            log.Println("Circuit breaker closed")
        }
    }

    return nil
}
Testing Your Implementation
Manual Testing Guide
Test 1: Startup Race Condition
Setup:
# Deploy both services
kubectl apply -f k8s/bad-service.yaml
kubectl apply -f k8s/good-service.yaml

# Watch pods in separate terminal
watch kubectl get pods -n demo
Test the bad service:
# Force restart
kubectl delete pod -l app=bad-service -n demo

# Observe: Pod will enter CrashLoopBackOff due to liveness probe
# killing it before 45s startup completes
Test the good service:
# Force restart
kubectl delete pod -l app=good-service -n demo

# Observe: Pod stays in 0/1 Ready state for ~45s, then becomes ready
# No restarts occur thanks to startup probe
Test 2: Data Consistency Under Failure
Setup:
# Deploy payment service with reconciliation enabled
kubectl apply -f k8s/payment-service.yaml

# Start payment traffic generator
kubectl run payment-generator --image=payment-client:latest \
  --restart=Never --rm -it -- \
  --target=payment-service.demo.svc.cluster.local:8080 \
  --rate=10 --duration=60s
Simulate SIGKILL during transactions:
# In another terminal, kill pods abruptly
while true; do
  kubectl delete pod -l app=payment-service -n demo --force --grace-period=0
  sleep 30
done
Verify reconciliation:
# Check for data inconsistencies
kubectl logs -l app=payment-service -n demo | grep "inconsistency"

# Monitor reconciliation metrics
kubectl port-forward svc/payment-service 8090:8090
curl http://localhost:8090/metrics | grep consistency
Test 3: RTO/RPO Validation
Disaster Recovery Simulation:
# Simulate regional failure
kubectl patch deployment payment-service -n demo \
  --patch '{"spec":{"replicas":0}}'

# Measure RTO - time to restore service
start_time=$(date +%s)
kubectl patch deployment payment-service -n demo \
  --patch '{"spec":{"replicas":3}}'

# Wait for all pods to be ready
kubectl wait --for=condition=ready pod -l app=payment-service -n demo --timeout=900s
end_time=$(date +%s)
rto=$((end_time - start_time))

echo "RTO: ${rto} seconds"
if [ $rto -le 900 ]; then
  echo "? RTO target met (15 minutes)"
else
  echo "? RTO target exceeded"
fi
Test 4: Istio Resilience Features
Automatic Retry Testing:
# Deploy with fault injection
kubectl apply -f istio/fault-injection.yaml

# Generate requests with chaos header
for i in {1..100}; do
  grpcurl -H "x-chaos-test: true" -plaintext \
    payment-service.demo.svc.cluster.local:8080 \
    PaymentService/ProcessPayment \
    -d '{"amount": 100, "currency": "USD"}'
done

# Check Istio metrics for retry behavior
kubectl exec -n istio-system deployment/istiod -- \
  pilot-agent request GET stats/prometheus | grep retry
Monitoring and Observability
RTO/RPO Considerations
Recovery Time Objective (RTO): Target time to restore service after an outage Recovery Point Objective (RPO): Maximum acceptable data loss
Your service lifecycle design directly impacts these critical business metrics:
package monitoring

import (
    "time"
    "github.com/prometheus/client_golang/prometheus"
    "github.com/prometheus/client_golang/prometheus/promauto"
)

var (
    // RTO-related metrics
    ServiceStartupTime = promauto.NewHistogramVec(prometheus.HistogramOpts{
        Name: "service_startup_duration_seconds",
        Help: "Time from pod start to service ready",
        Buckets: []float64{1, 5, 10, 30, 60, 120, 300, 600}, // Up to 10 minutes
    }, []string{"service", "version"})

    ServiceRecoveryTime = promauto.NewHistogramVec(prometheus.HistogramOpts{
        Name: "service_recovery_duration_seconds",
        Help: "Time to recover from failure state",
        Buckets: []float64{1, 5, 10, 30, 60, 300, 900}, // Up to 15 minutes
    }, []string{"service", "failure_type"})

    // RPO-related metrics
    LastCheckpointAge = promauto.NewGaugeVec(prometheus.GaugeOpts{
        Name: "last_checkpoint_age_seconds",
        Help: "Age of last successful checkpoint",
    }, []string{"service", "checkpoint_type"})

    DataConsistencyChecks = promauto.NewCounterVec(prometheus.CounterOpts{
        Name: "data_consistency_checks_total",
        Help: "Total number of consistency checks performed",
    }, []string{"service", "check_type", "status"})

    InconsistencyDetected = promauto.NewCounterVec(prometheus.CounterOpts{
        Name: "data_inconsistencies_detected_total",
        Help: "Total number of data inconsistencies detected",
    }, []string{"service", "inconsistency_type", "severity"})
)
Grafana Dashboard
{
  "dashboard": {
    "title": "Service Lifecycle - Business Impact",
    "panels": [
      {
        "title": "RTO Compliance",
        "description": "Percentage of recoveries meeting RTO target (15 minutes)",
        "targets": [{
          "expr": "100 * (histogram_quantile(0.95, service_recovery_duration_seconds_bucket) <= 900)"
        }],
        "thresholds": [
          {"value": 95, "color": "green"},
          {"value": 90, "color": "yellow"},
          {"value": 0, "color": "red"}
        ]
      },
      {
        "title": "RPO Risk Assessment",
        "description": "Data at risk based on checkpoint age",
        "targets": [{
          "expr": "last_checkpoint_age_seconds / 60"
        }],
        "unit": "minutes"
      },
      {
        "title": "Data Consistency Status",
        "targets": [{
          "expr": "rate(data_inconsistencies_detected_total[5m])"
        }]
      }
    ]
  }
}
Production Readiness Checklist
Before deploying to production, ensure your service meets these criteria:
Application Layer
- [ ] Implements separate liveness and readiness endpoints
- [ ] Readiness checks validate all critical dependencies
- [ ] Graceful shutdown drains in-flight requests
- [ ] Idempotency for all state-modifying operations
- [ ] Anti-entropy/reconciliation processes implemented
- [ ] Circuit breakers for external dependencies
- [ ] Checkpoint-and-resume for long-running operations
- [ ] Structured logging with correlation IDs
- [ ] Metrics for startup, shutdown, and health status
Kubernetes Configuration
- [ ] Startup probe for slow-initializing services
- [ ] Distinct liveness and readiness probes
- [ ] Calculated
terminationGracePeriodSecondsbased on actual shutdown time - [ ] PreStop hooks for load balancer draining
- [ ] Resource requests and limits defined
- [ ] PodDisruptionBudget for availability
- [ ] Anti-affinity rules for high availability
Service Mesh Integration
- [ ] Istio sidecar lifecycle annotations (
holdApplicationUntilProxyStarts) - [ ] Istio automatic retry policies configured
- [ ] Circuit breaker configuration in DestinationRule
- [ ] Distributed tracing enabled
- [ ] mTLS for service-to-service communication
Data Integrity & Recovery
- [ ] RTO/RPO metrics tracked and alerting configured
- [ ] Reconciliation processes tested with Game Day exercises
- [ ] Chaos engineering tests validate failure scenarios
- [ ] Synthetic monitoring for end-to-end business flows
- [ ] Backup and restore procedures documented and tested
Common Pitfalls and Solutions
1. My service keeps restarting during deployment:
Symptom: Pods enter CrashLoopBackOff during rollout
Common Causes:
- Liveness probe starts before application is ready
- Startup time exceeds probe timeout
- Missing startup probe
Solution:
startupProbe:
  httpGet:
    path: /healthz
    port: 8080
  failureThreshold: 30  # 30 * 10s = 5 minutes
  periodSeconds: 10
2. Data corruption during pod restarts:
Symptom: Inconsistent database state after deployments
Common Causes:
- Non-atomic operations
- Missing idempotency
- No reconciliation processes
Solution:
// Implement atomic operations with database transactions
tx, err := db.BeginTx(ctx, nil)
if err != nil {
    return err
}
defer tx.Rollback()

// All operations within transaction
if err := processPayment(tx, req); err != nil {
    return err // Automatic rollback
}

return tx.Commit()
3. Service mesh sidecar issues:
Symptom: ECONNREFUSED errors on startup
Common Causes:
- Application starts before sidecar is ready
- Sidecar terminates before application
Solution:
annotations:
  sidecar.istio.io/holdApplicationUntilProxyStarts: "true"
  proxy.istio.io/config: |
    proxyMetadata:
      EXIT_ON_ZERO_ACTIVE_CONNECTIONS: "true"
Conclusion
Service lifecycle management is not just about preventing outages—it’s about building systems that are predictable, observable, and resilient to the inevitable failures that occur in distributed systems. This allows:
- Zero-downtime deployments: Services gracefully handle rollouts without data loss.
- Improved reliability: Proper health checks prevent cascading failures.
- Better observability: Clear signals about service state and data consistency.
- Faster recovery: Services self-heal from transient failures.
- Data integrity: Idempotency and reconciliation prevent corruption.
- Compliance readiness: Meet RTO/RPO requirements for disaster recovery.
- Financial protection: Prevent duplicate transactions and data corruption that could cost millions.
The difference between a service that “works on my machine” and one that thrives in production lies in these details. Whether you’re running on GKE, EKS, or AKS, these patterns form the foundation of production-ready microservices.
Want to test these patterns yourself? The complete code examples and deployment manifests are available on GitHub.