Here are the programming languages I’ve used over the last three decades. From BASIC in the late 80s to Rust today, each one taught me something about solving problems with code.
Late 1980s – Early 1990s
I learned coding with BASIC/QUICKBASIC on Atari and later IBM XT computer in 1980s.
I learned other languages in college or on my own like C, Pascal, Prolog, Lisp, FORTRAN and PERL.
In college, I used Icon to build compilers.
My first job was mainframe work and I used COBOL and CICS for applications, JCL and REXX for scripting and SAS for data processing.
Later at a physics lab, I used C/C++, Fortran for applications and Python for scripting and glue language.
I used a number of 4GL languages like dBase, FoxPro, Paradox, Delphi. Later I used Visual Basic and PowerBuilder for building client applications.
I used SQL and PL/SQL throughout my career for relational databases.
Web Era Mid/Late 1990s
The web era introduced a number of new languages like HTML, Javascript, CSS, ColdFusion, and Java.
I used XML/XSLT/XPath/XQuery, PHP, VBScript and ActionScript.
I used RSS/SPARQL/RDF for buiding semantic web applications.
I used IDL/CORBA for building distributed systems.
Mobile/Services Era 2000s
I used Ruby for building web applications, Erlang/Elixir for building concurrent applications.
I used Groovy for writing tests and R for data analysis.
When iOS was released, I used Objective-C to build mobile applications.
In this era, functional languages gained popularity and I used Scala/Haskell/Clojure for some projects.
New Languages Era Mid 2010s
I started using Go for networking/concurrent applications.
I started using Swift for iOS applications and Kotlin for Android apps.
I initially used Flow language from Facebook but then started using TypeScript instead of JavaScript.
I used Dart for Flutter applications.
I used GraphQL for some of client friendly backend APIs.
I used Solidity for Ethereum smart contracts.
I used Lua as a glue language with Redis, HAProxy and other similar systems.
I used Rust and became my go to language for highly performant applications.
What Three Decades of Languages Taught Me
Every language is a bet on what matters most: Safety vs. speed vs. expressiveness vs. ecosystem vs. hiring.
Languages don’t die, they fade: I still see COBOL in production. I still debug Perl scripts. Legacy is measured in decades.
The fundamentals never change: Whether it’s BASIC or Rust, you’re still managing state, controlling flow, and abstracting complexity.
Polyglotism is a superpower: Each language teaches you a different way to think. Functional programming makes you better at OOP. Systems programming makes you better at scripting.
The best language is the one your team can maintain: I’ve seen beautiful Scala codebases become liabilities and ugly PHP applications become billion-dollar businesses.
What’s Next?
I’m watching Zig (Rust without the complexity?) and it’s on my list for next language to learn.
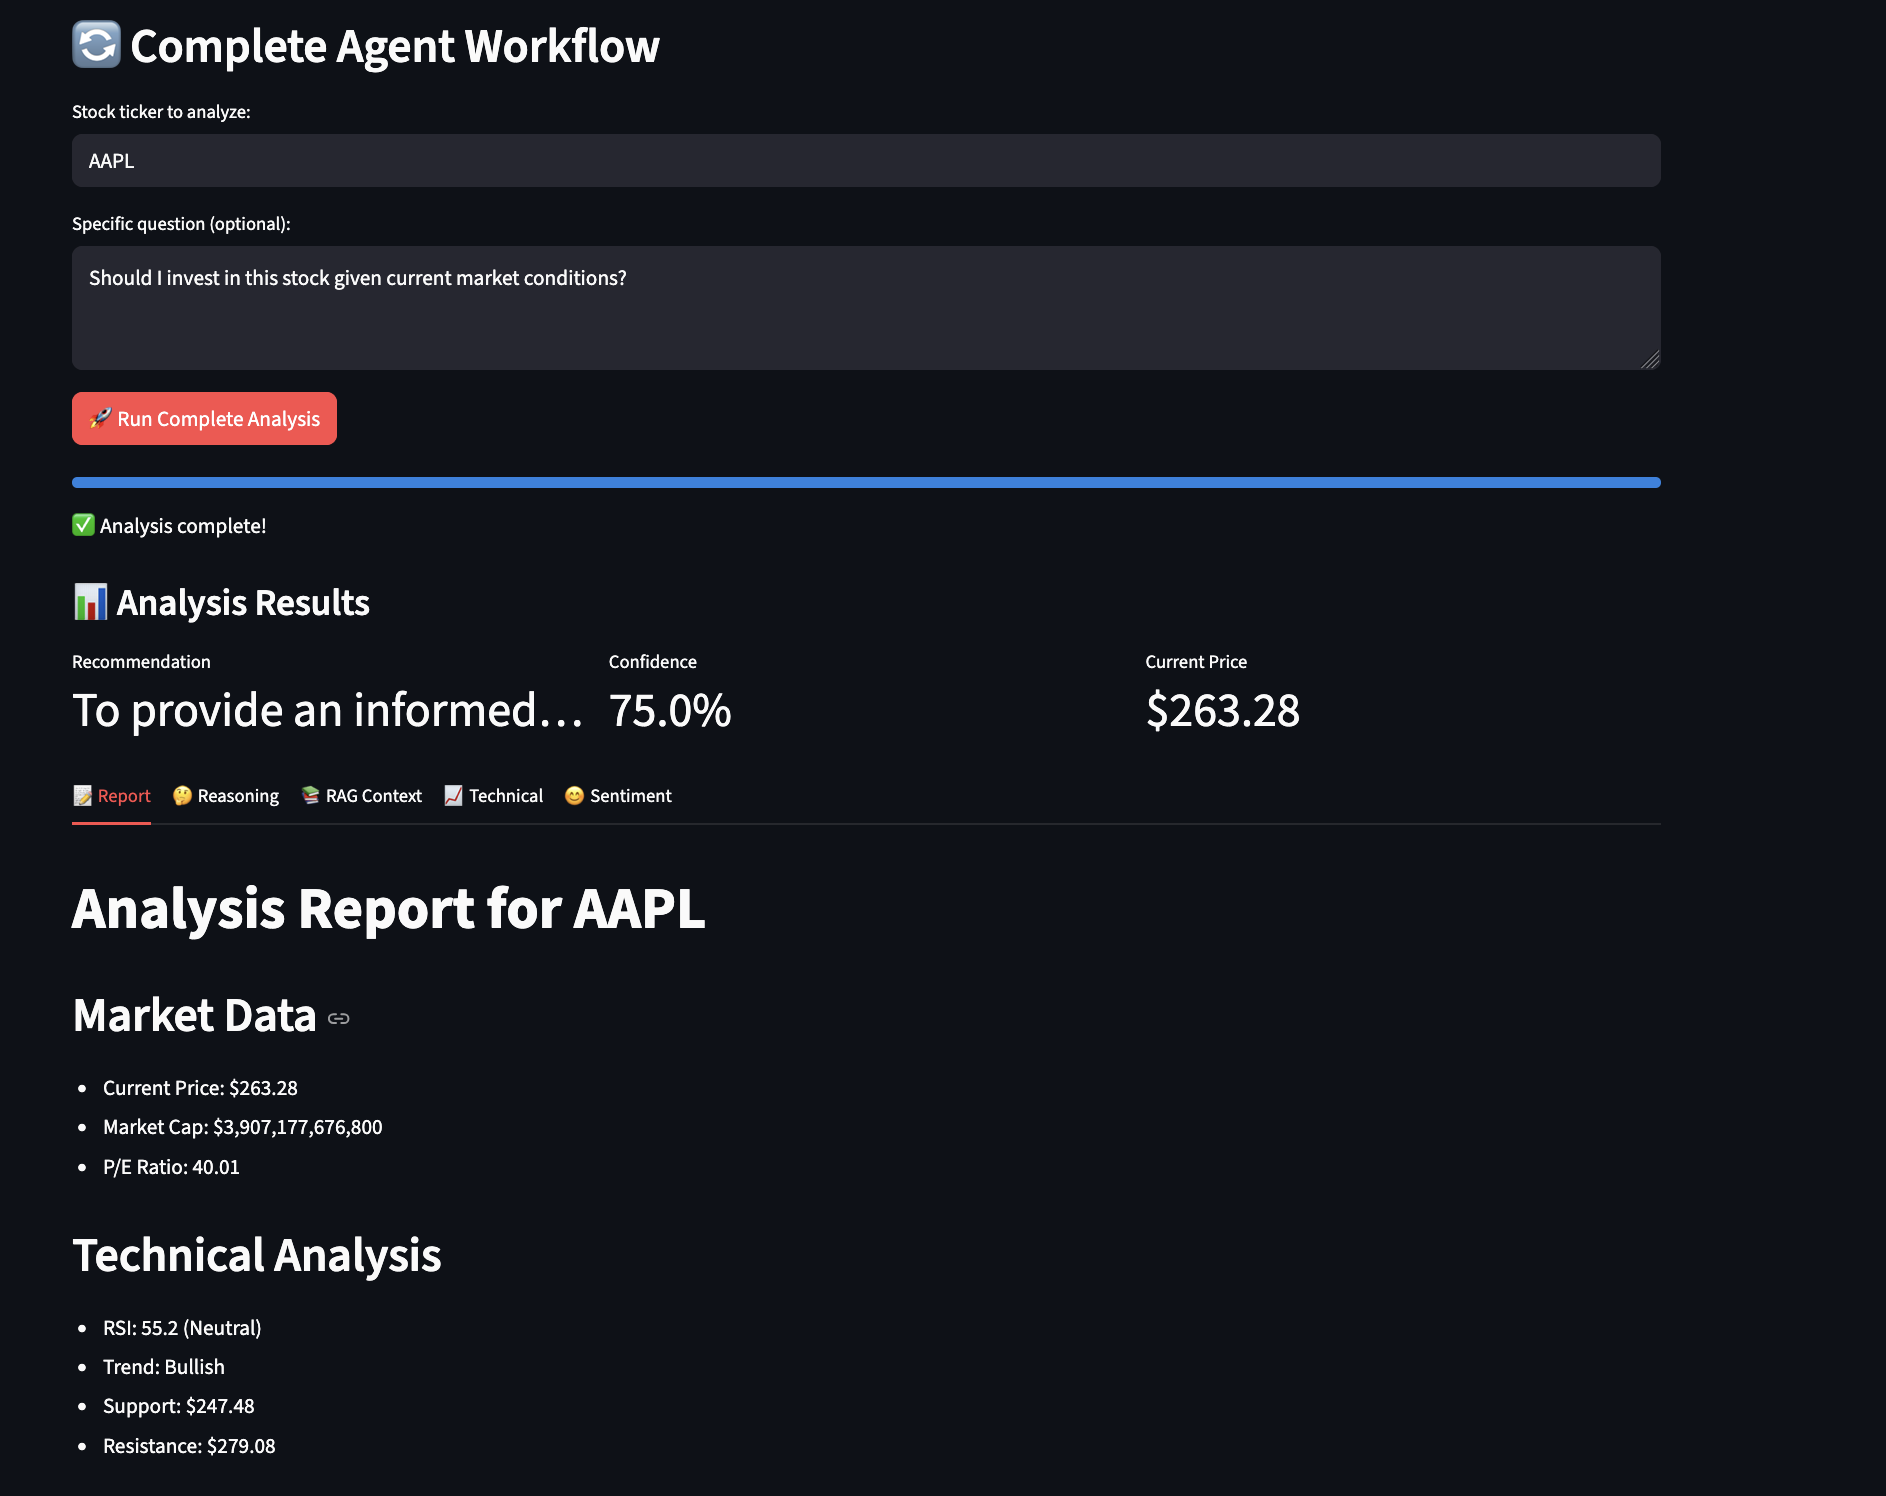
I’ve spent the last year building AI agents in enterprise environments. During this time, I’ve extensively applied emerging standards like Model Context Protocol (MCP) from Anthropic and the more recent Agent-to-Agent (A2A) Protocol for agent communication and coordination. What I’ve learned: there’s a massive gap between building a quick proof-of-concept with these protocols and deploying a production-grade system. The concerns that get overlooked in production deployments are exactly what will take you down at 3 AM:
Multi-tenant isolation with row-level security (because one leaked document = lawsuit)
JWT-based authentication across microservices (no shared sessions, fully stateless)
Real-time observability of agent actions (when agents misbehave, you need to know WHY)
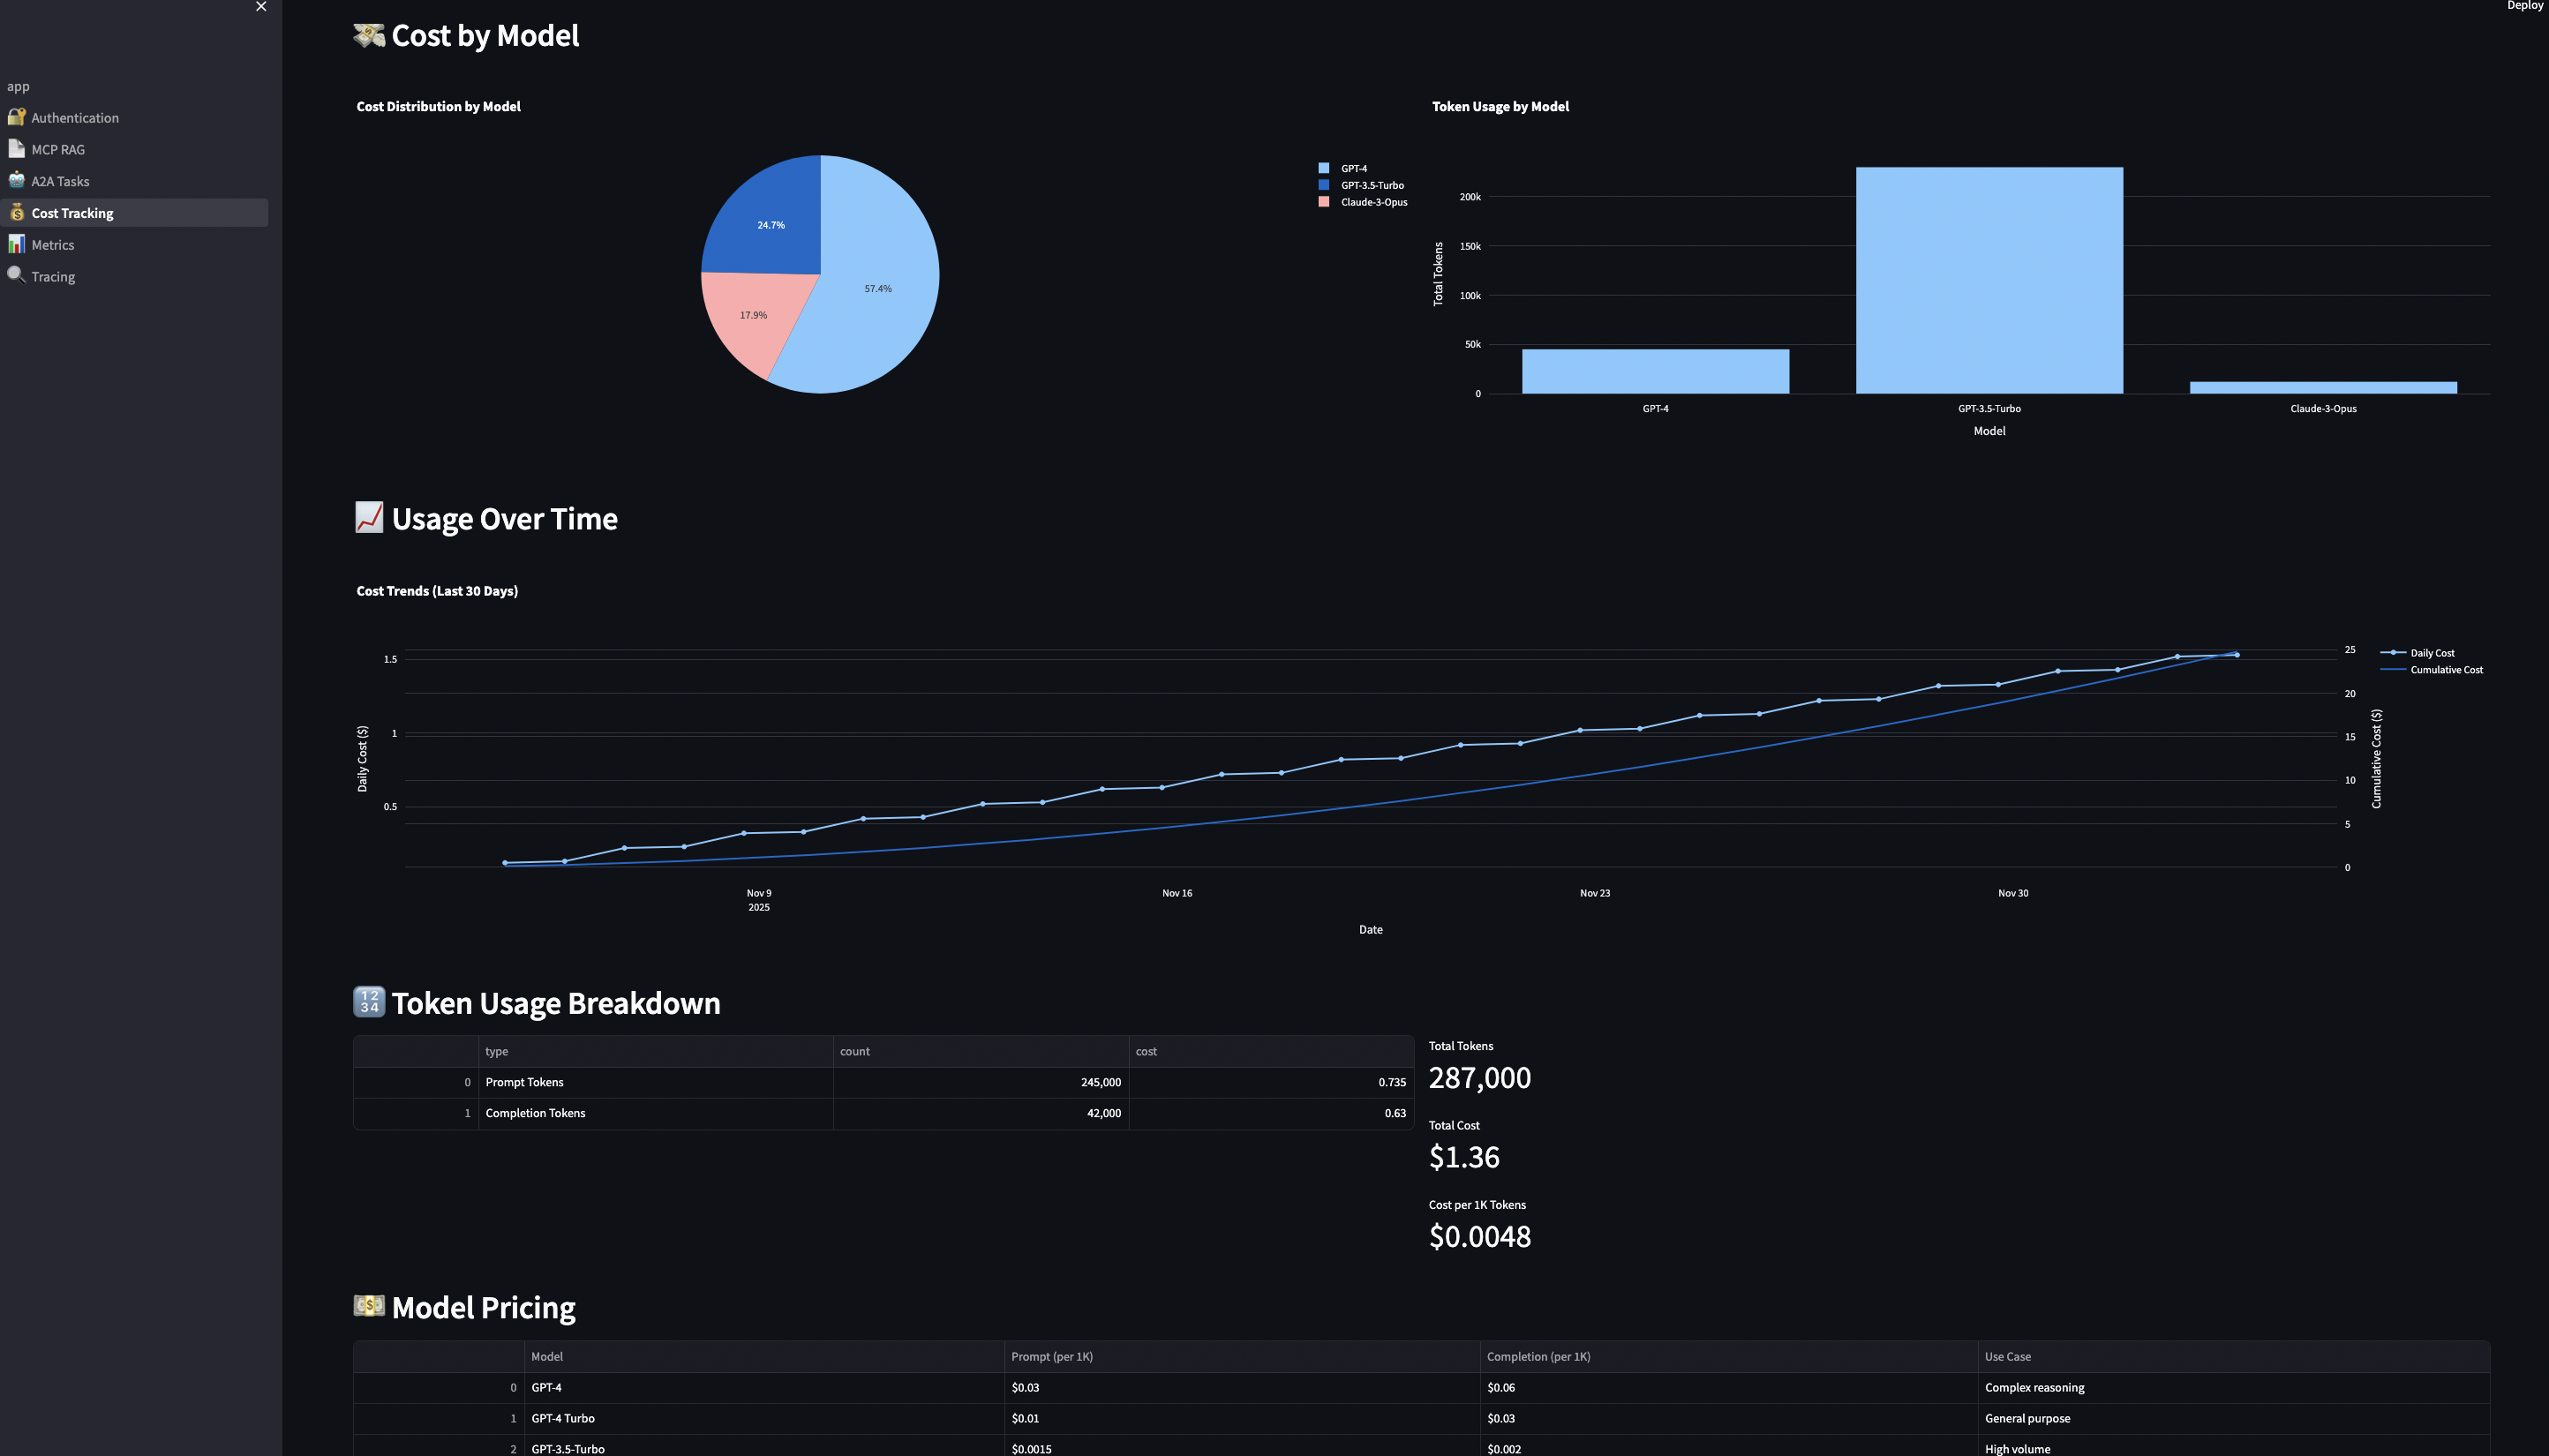
Cost tracking and budgeting per user and model (because OpenAI bills compound FAST)
Graceful degradation when embeddings aren’t available (real data is messy)
Integration testing against real databases (mocks lie to you)
Disregarding security concerns can lead to incidents like the Salesloft breach where their AI chatbot inadvertently stored authentication tokens for hundreds of services, which exposed customer data across multiple platforms. More recently in October 2025, Filevine (a billion-dollar legal AI platform) exposed 100,000+ confidential legal documents through an unauthenticated API endpoint that returned full admin tokens to their Box filesystem. No authentication required, just a simple API call. I’ve personally witnessed security issues from inadequate AuthN/AuthZ controls and cost overruns exceeding hundreds of thousands of dollars, which are preventable with proper security and budget enforcement.
The good news is that MCP and A2A protocols provide the foundation to solve these problems. Most articles treat these as competing standards but they are complementary. In this guide, I’ll show you exactly how to combine MCP and A2A to build a system that handles real production concerns: multi-tenancy, authentication, cost control, and observability.
Reference Implementation
To demonstrate these concepts in action, I’ve built a reference implementation that showcases production-ready patterns.
Architecture Philosophy:
Three principles guided every decision:
Go for servers, Python for workflows – Use the right tool for each job. Go handles high-throughput protocol servers. Python handles AI workflows.
Database-level security – Multi-tenancy enforced via PostgreSQL row-level security (RLS), not application code. Impossible to bypass accidentally.
Stateless everything – Every service can scale horizontally. No sticky sessions, no shared state, no single points of failure.
All containerized, fully tested, and ready for production deployment.
But before we dive into the implementation, let’s understand the fundamental problem these protocols solve and why you need both.
Part 1: Understanding MCP and A2A
The Core Problem: Integration Chaos
Prior to MCP protocol in 2024, you had to build custom integration with LLM providers, data sources and AI frameworks. Every AI application had to reinvent authentication, data access, and orchestration, whichdoesn’t scale. MCP and A2A emerged to solve different aspects of this chaos:
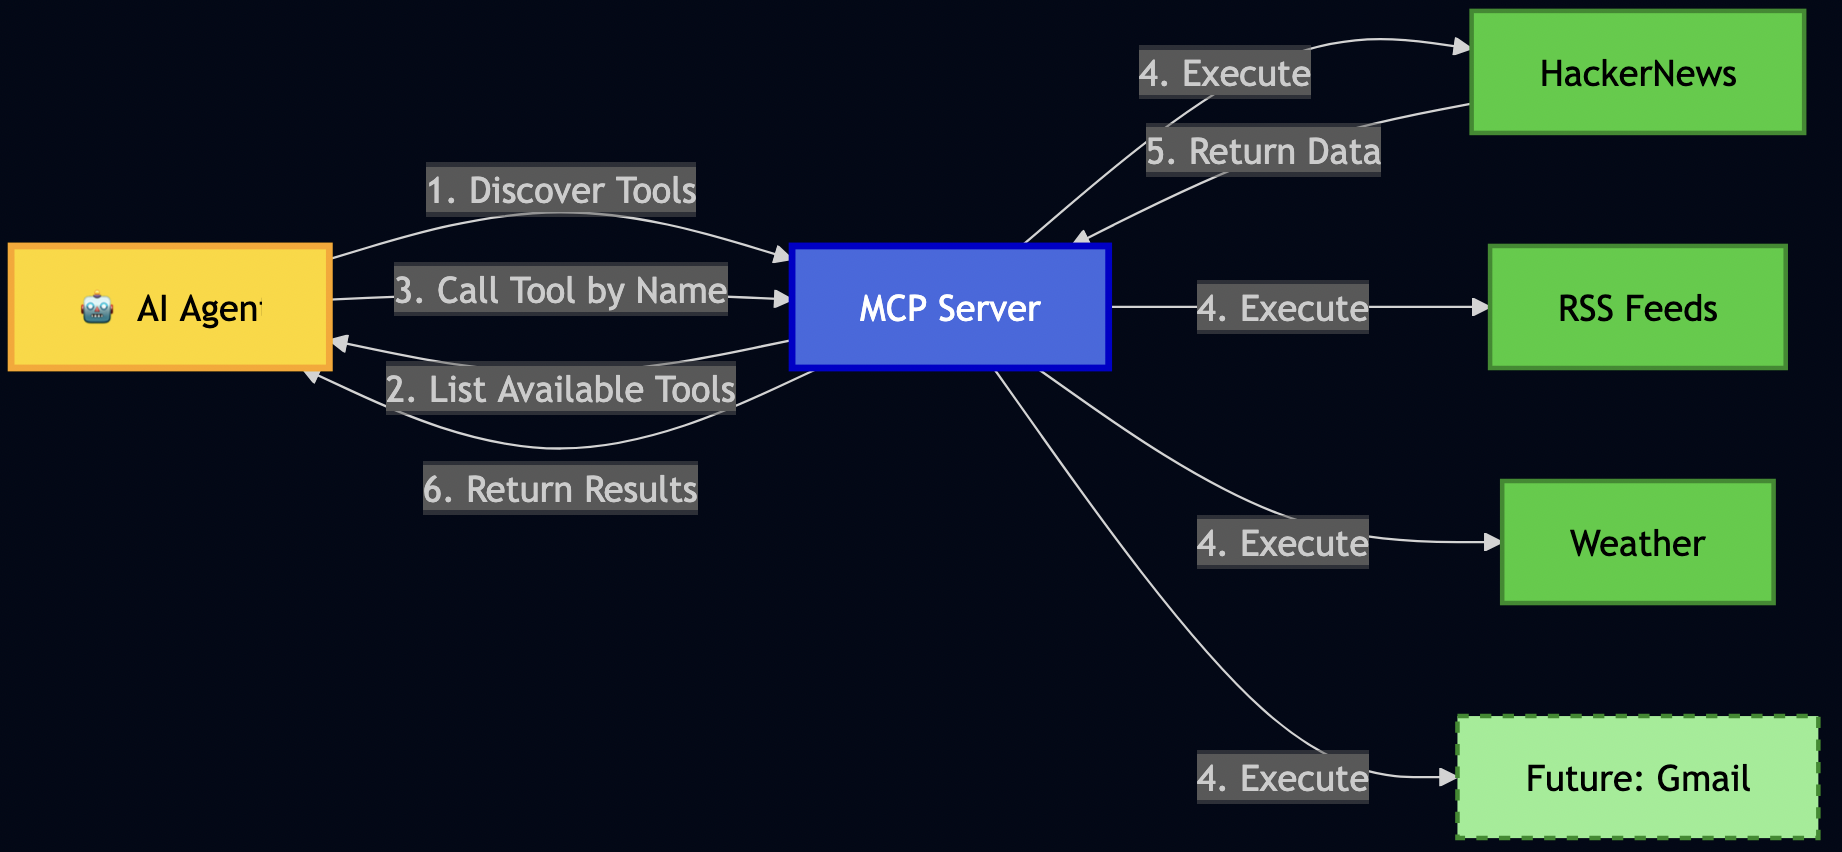
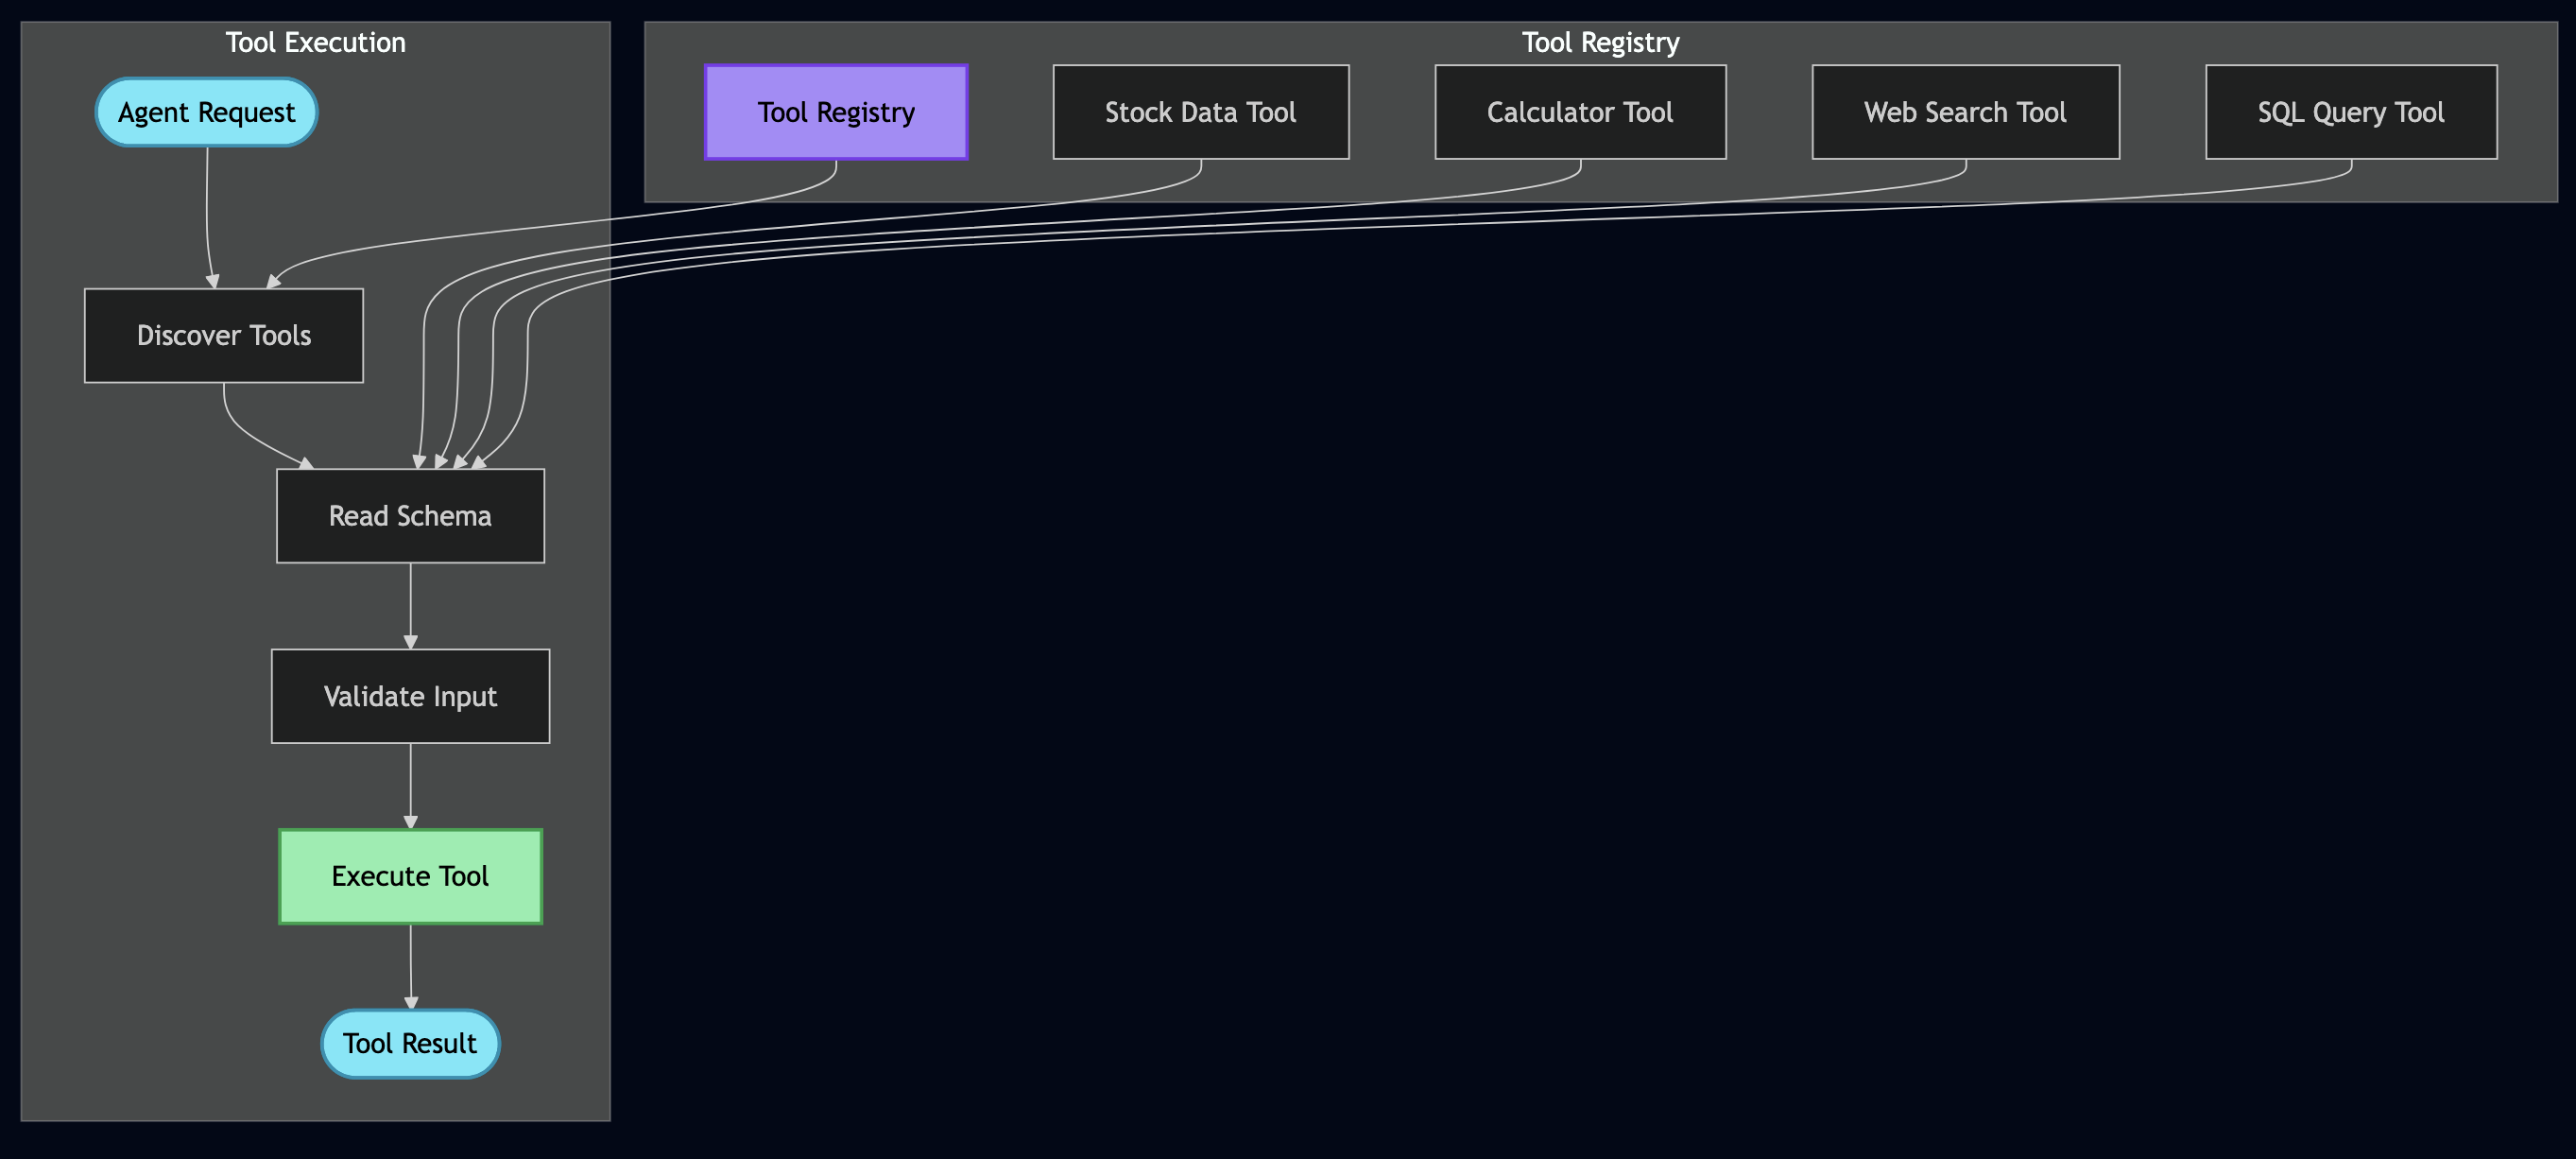
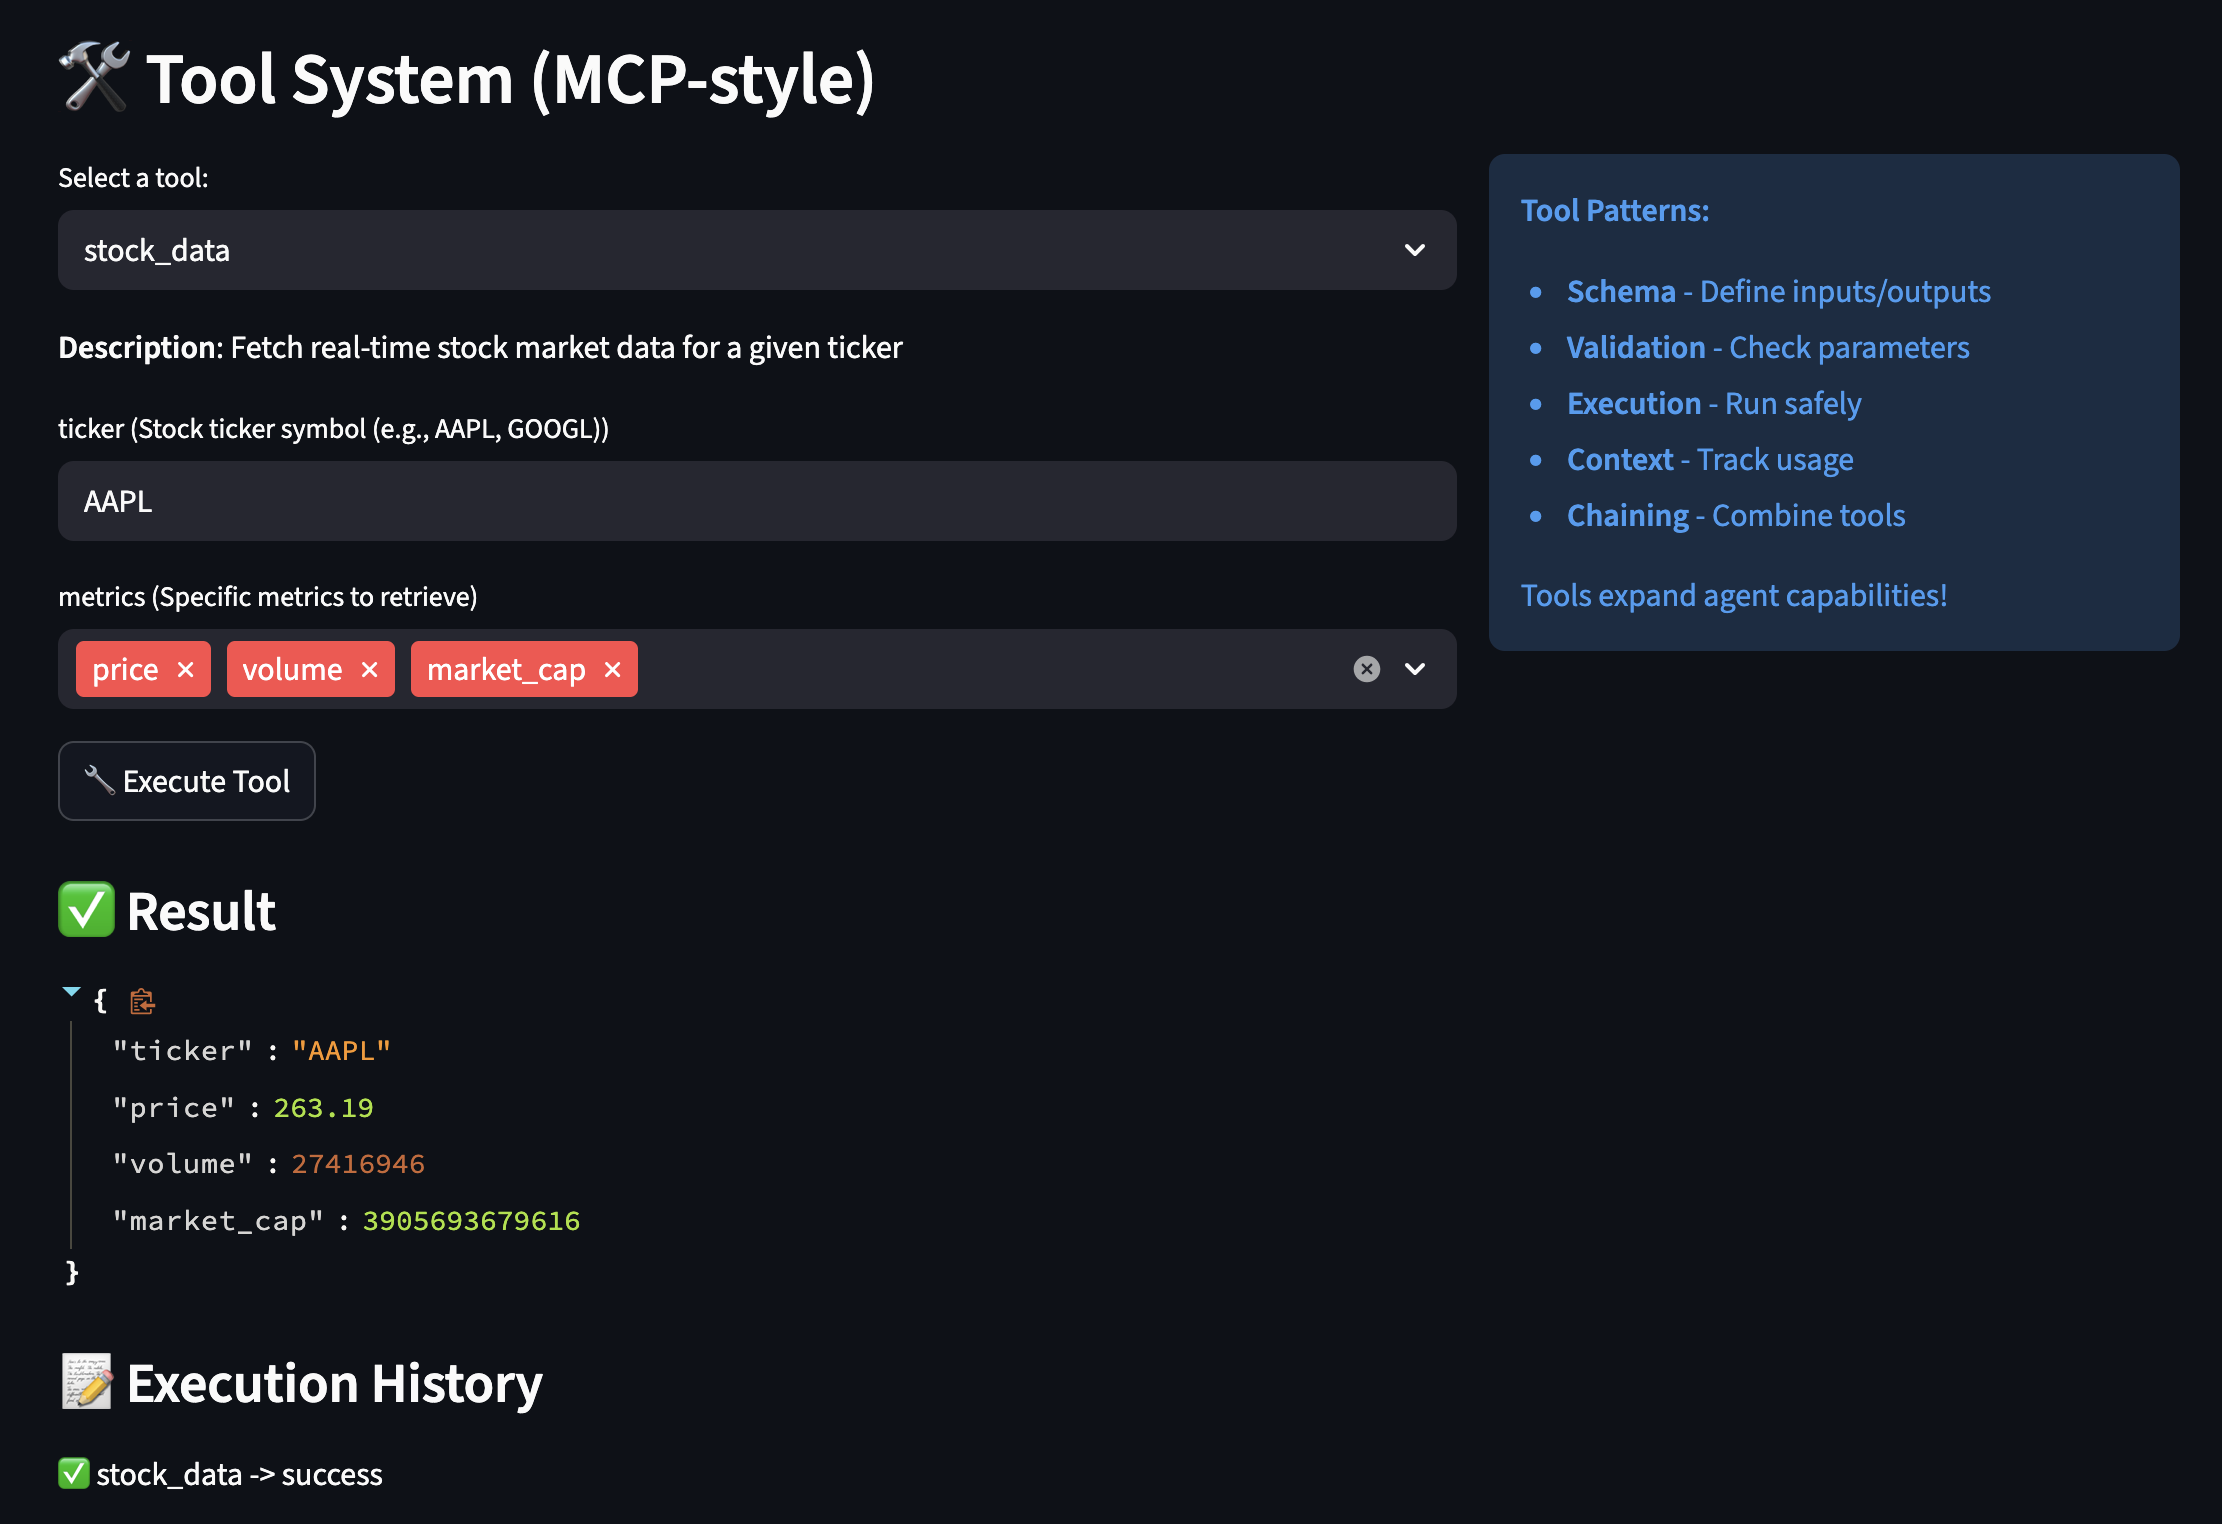
The MCP Side: Standardized Tool Execution
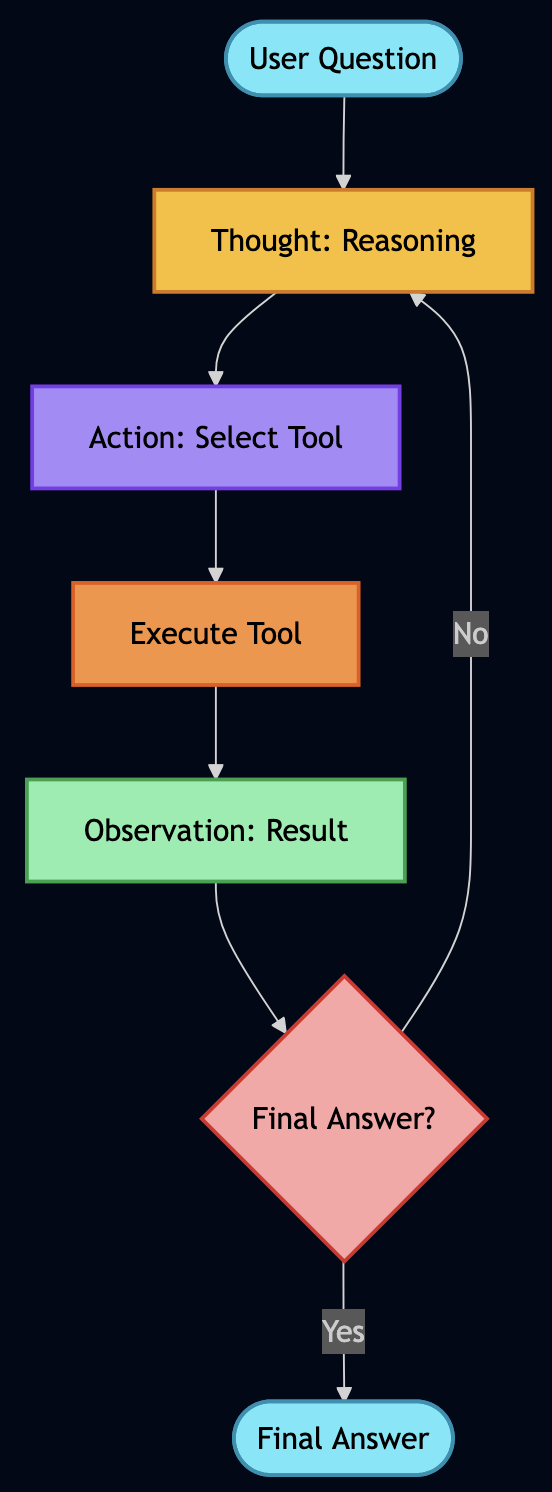
Think of MCP as a standardized toolbox for AI models. Instead of every AI application writing custom integrations for databases, APIs, and file systems, MCP provides a JSON-RPC 2.0 protocol that models use to:
“MCP excels at synchronous, stateless tool execution. It’s perfect when you need an AI model to retrieve information, execute a function, and return results immediately.”
The server executes the tool and returns results. Simple, stateless, fast.
Why JSON-RPC 2.0? Because it’s:
Language-agnostic – Works with any language that speaks HTTP
Batch-capable – Multiple requests in one HTTP call
Error-standardized – Consistent error codes across implementations
Widely adopted – 20+ years of production battle-testing
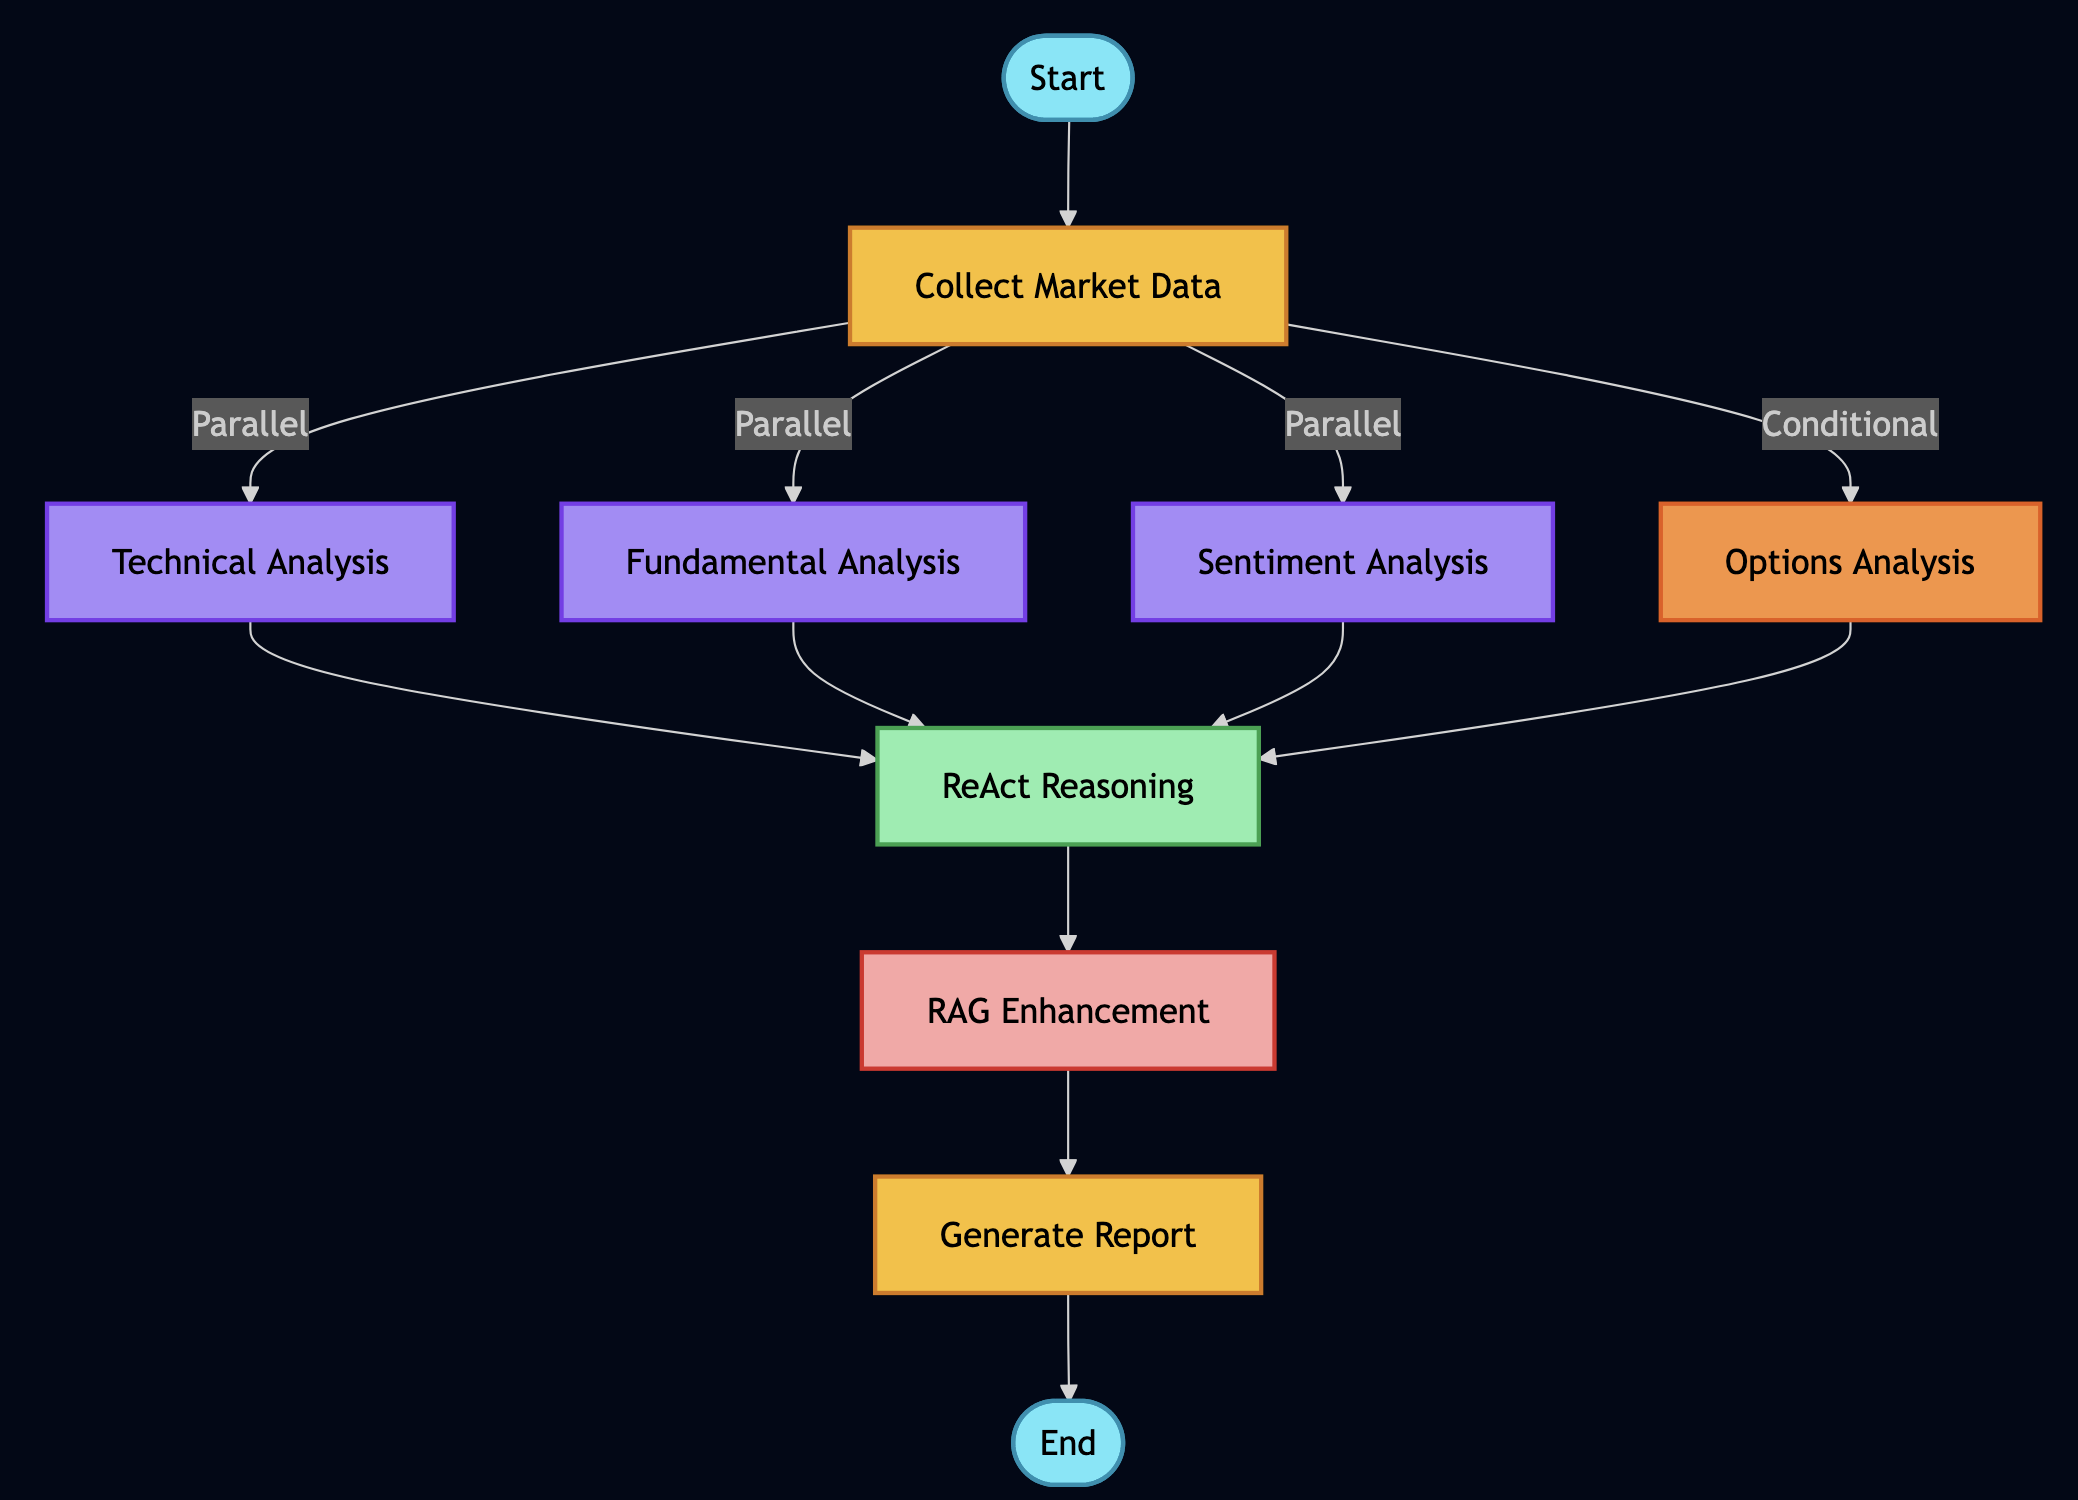
The A2A Side: Stateful Workflow Orchestration
A2A handles what MCP doesn’t: multi-step, stateful workflows where agents collaborate. From the A2A Protocol docs:
“A2A is designed for asynchronous, stateful orchestration of complex tasks that require multiple steps, agent coordination, and long-running processes.”
A2A provides:
Task creation and management with persistent state
Real-time streaming of progress updates (Server-Sent Events)
Agent coordination across multiple services
Artifact management for intermediate results
Why Both Protocols Matter
Here’s a real scenario from my fintech work that illustrates why you need both:
Use Case: Compliance analyst needs to research a company across 10,000 documents, verify regulatory compliance, cross-reference with SEC filings, and generate an audit-ready report.
“Use MCP when you need fast, stateless tool execution. Use A2A when you need complex, stateful orchestration. Use both when building production systems.”
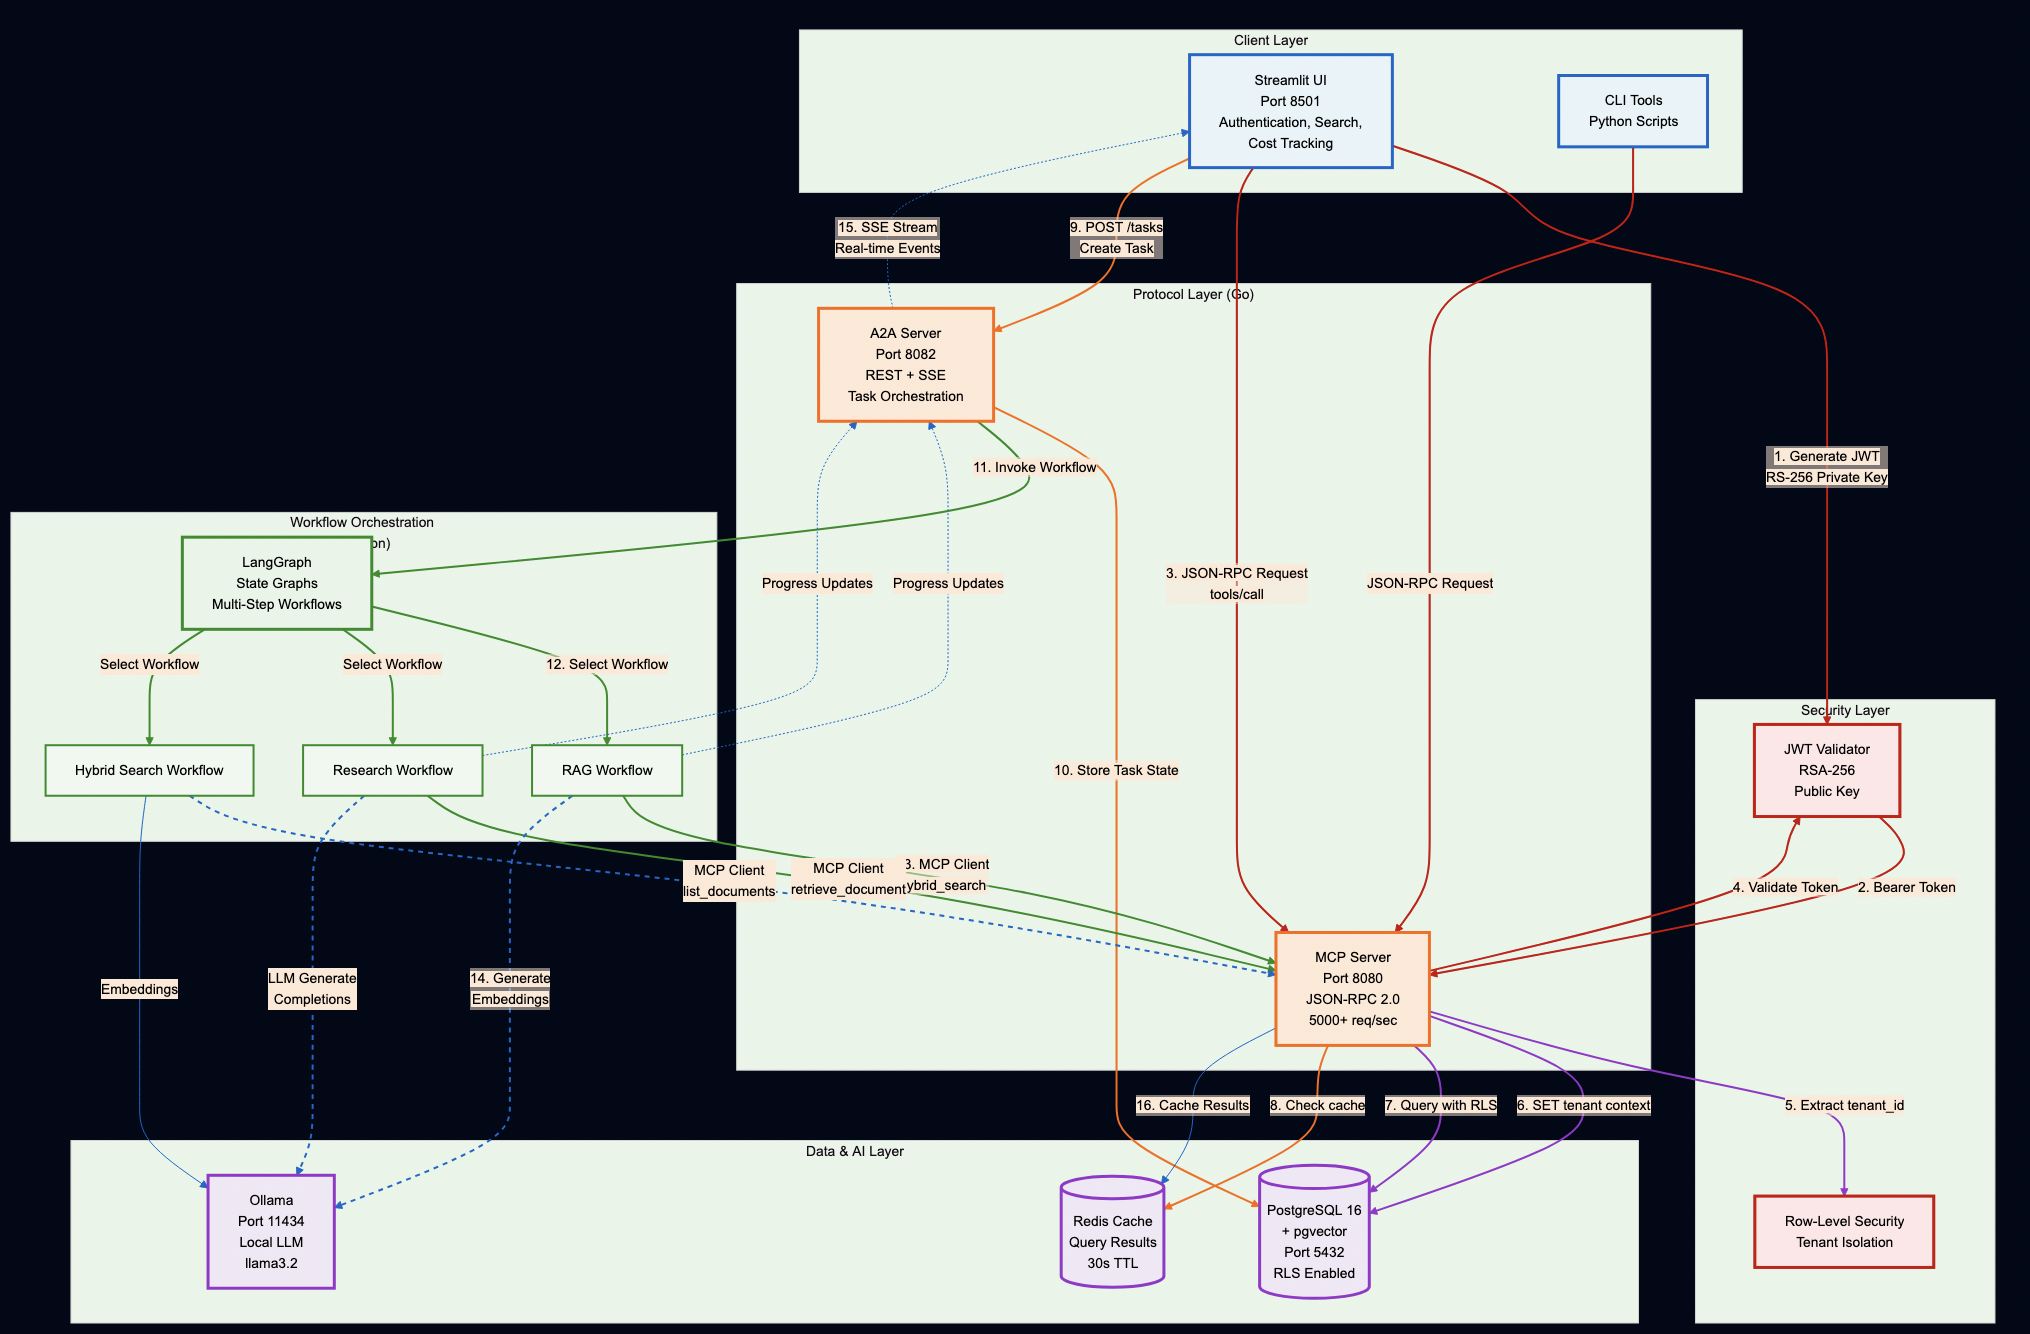
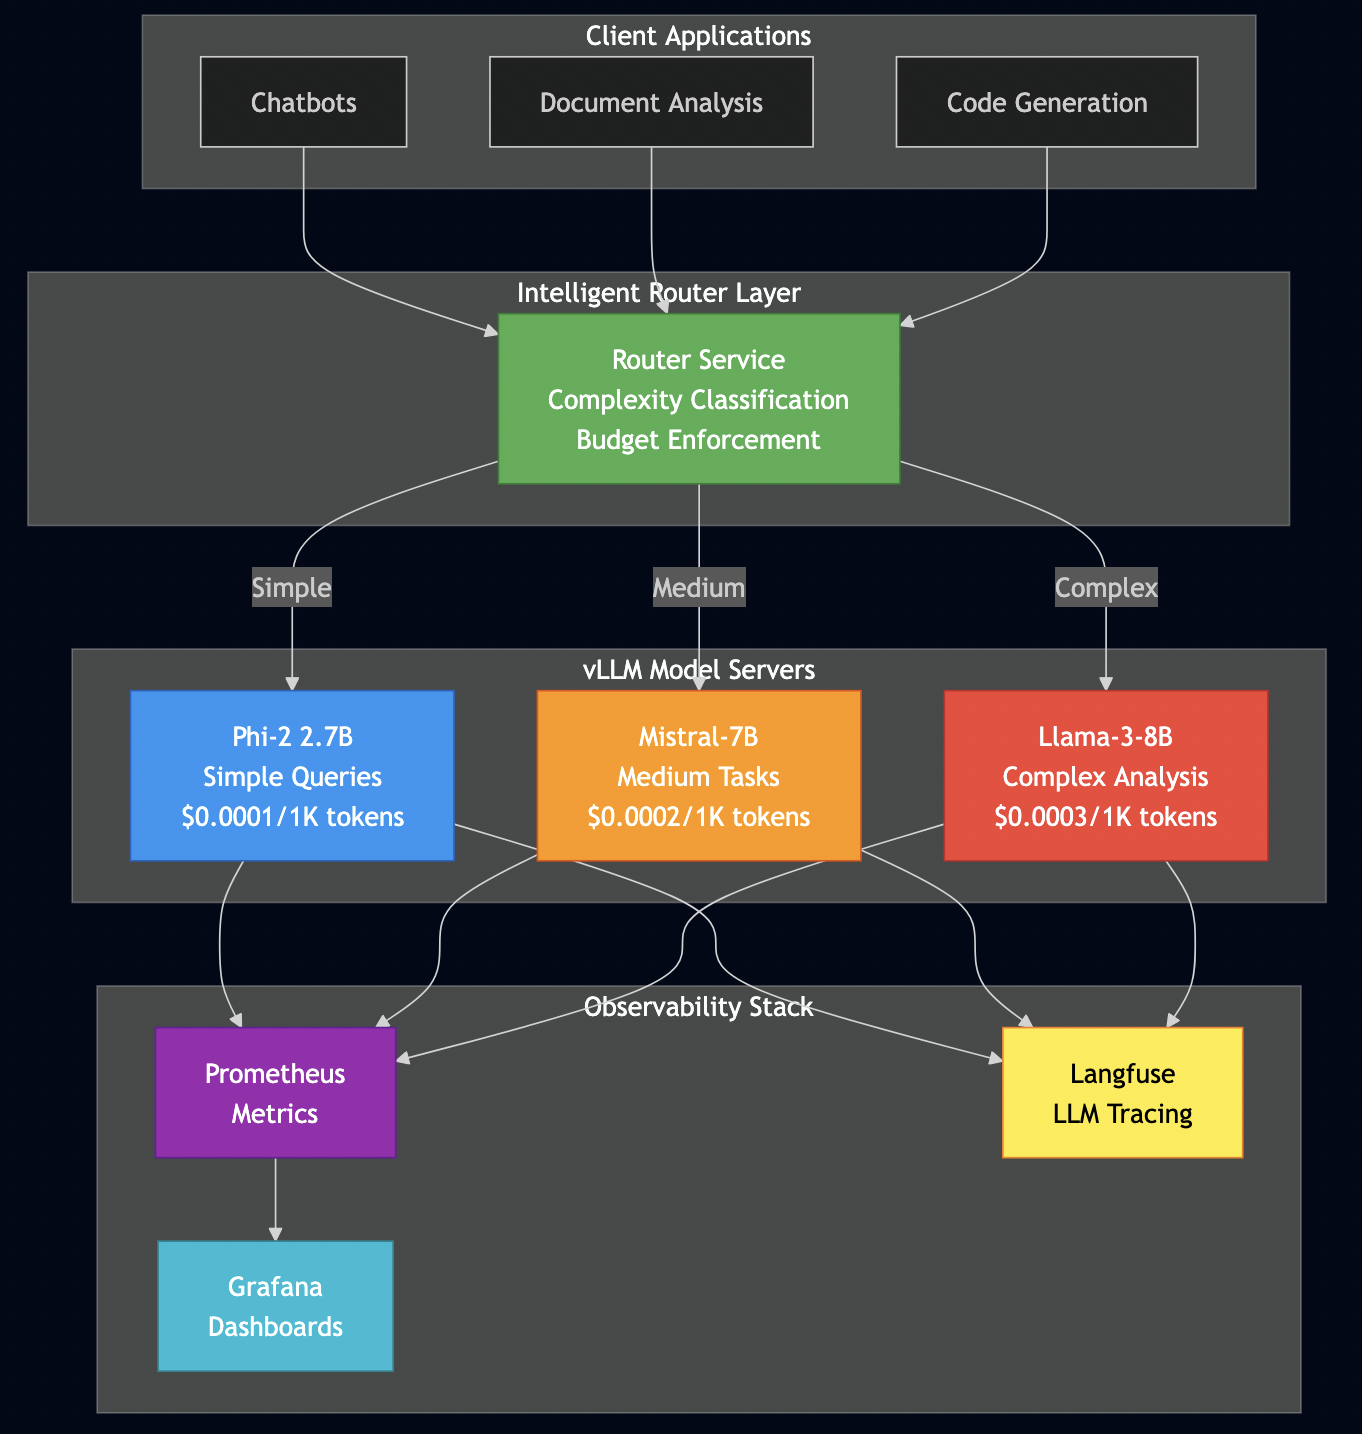
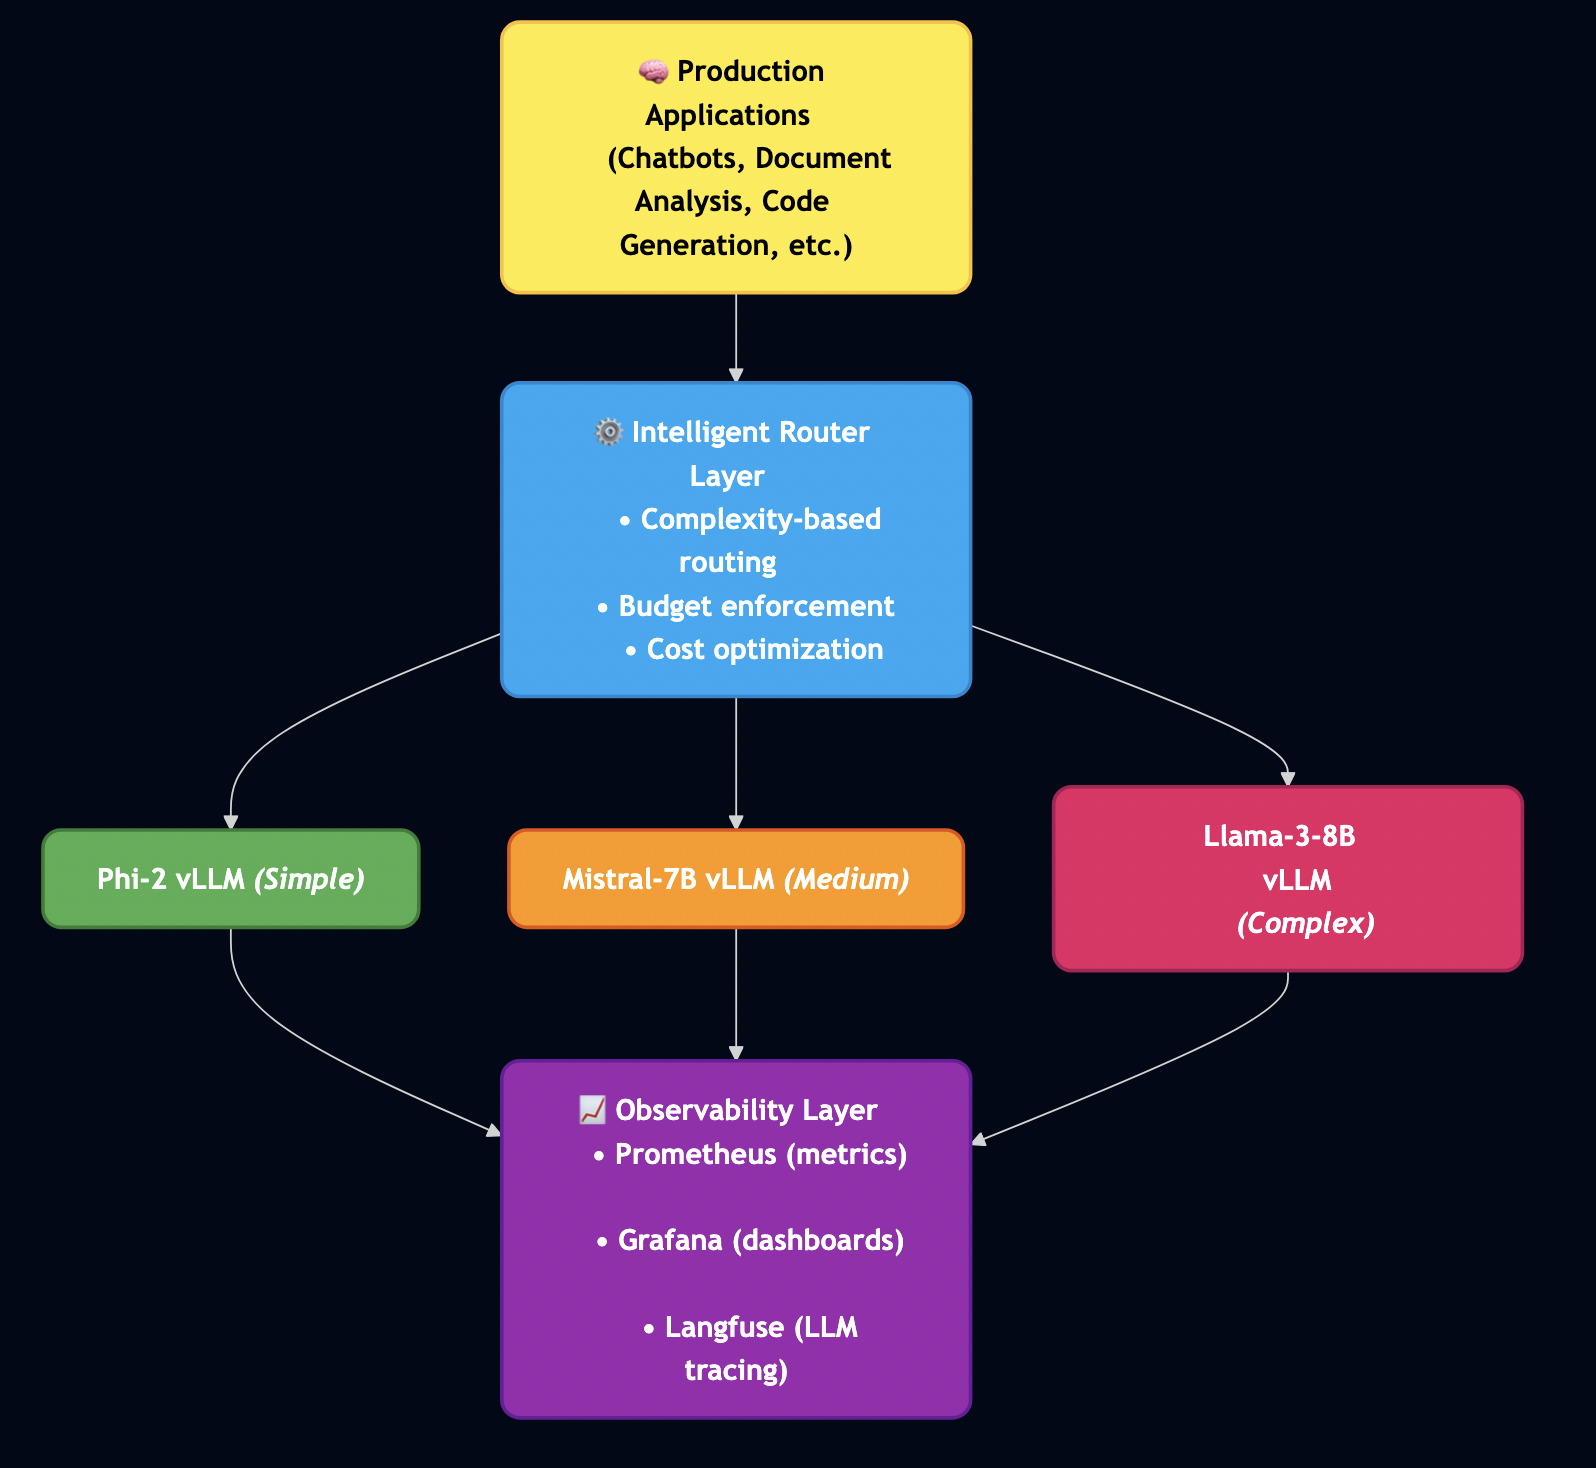
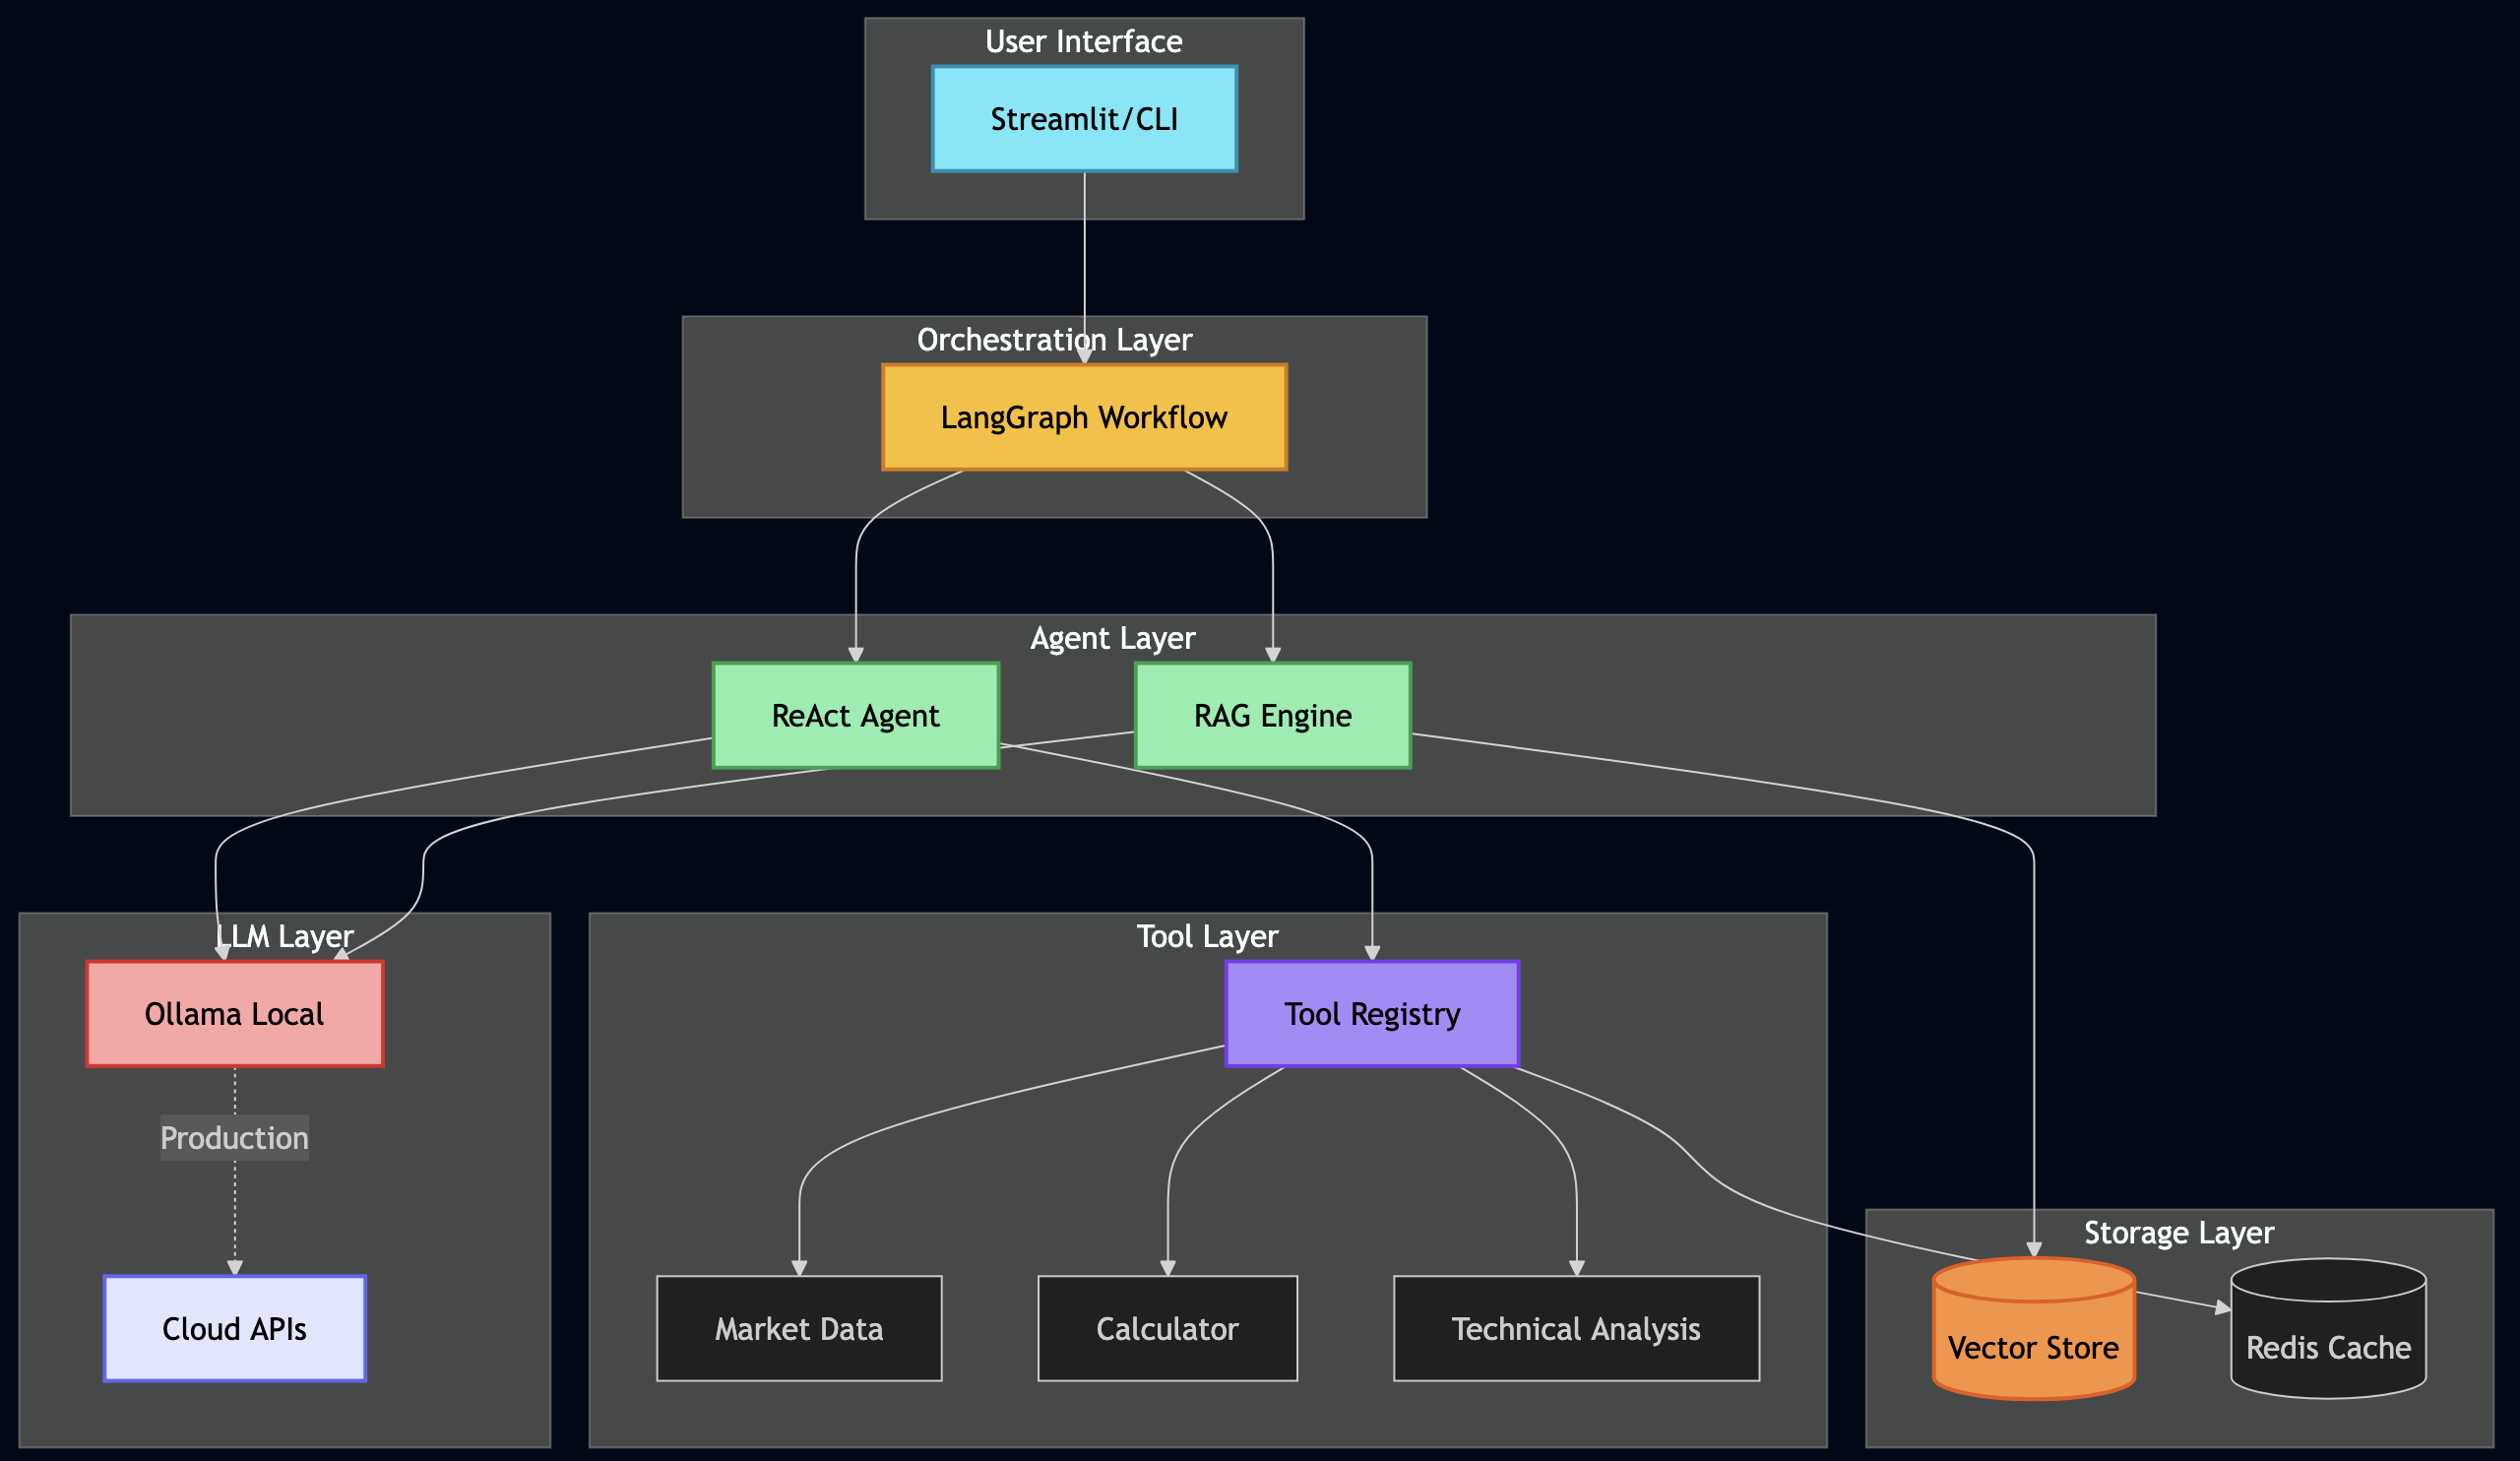
Part 2: Architecture
System Overview
Key Design Decisions
Protocol Servers (Go):
MCP Server – Secure document retrieval with pgvector and hybrid search. Go’s concurrency model handles 5,000+ req/sec, and its type safety catches integration bugs at compile time (not at runtime).
A2A Server – Multi-step workflow orchestration with Server-Sent Events for real-time progress tracking. Stateless design enables horizontal scaling.
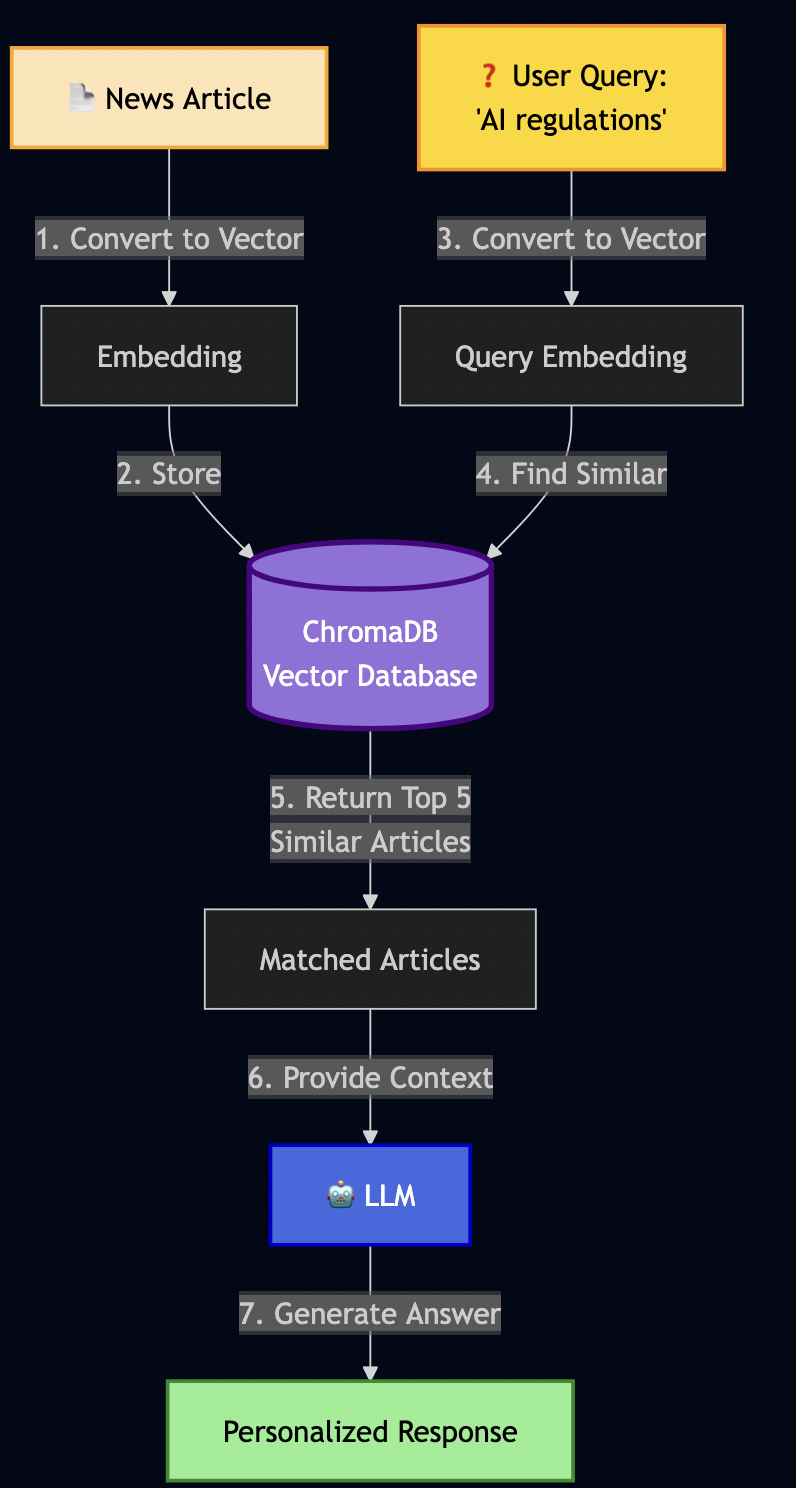
AI Workflows (Python):
LangGraph Workflows – RAG, research, and hybrid pipelines. Python was the right choice here because the AI ecosystem (LangChain, embeddings, model integrations) lives in Python.
PostgreSQL with pgvector – Multi-tenant document storage with row-level security policies enforced at the database level (not application level)
Ollama – Local LLM inference for development and testing (no OpenAI API keys required)
DatabaseSecurity:
Application-level tenant filtering for database is not enough so row-level security policies are enforced:
// ? BAD: Application-level filtering (can be bypassed)
func GetDocuments(tenantID string) ([]Document, error) {
    query := "SELECT * FROM documents WHERE tenant_id = ?"
    // What if someone forgets the WHERE clause?
    // What if there's a SQL injection?
    // What if a bug skips this check?
}
-- ? GOOD: Database-level Row-Level Security (impossible to bypass)
ALTER TABLE documents ENABLE ROW LEVEL SECURITY;

CREATE POLICY tenant_isolation ON documents
    USING (tenant_id = current_setting('app.current_tenant_id')::uuid);
Every query automatically filters by tenant so there is no way to accidentally leak data. Even if your application has a bug, the database enforces isolation.
JWT Authentication
MCP server and UI share RSA keys for token verification, which provides:
Asymmetric: MCP server only needs public key (can’t forge tokens)
Rotation: Rotate private key without redeploying services
The reference implementation (hybrid_search.go) uses PostgreSQL’s full-text search (BM25-like) combined with pgvector:
// Hybrid search query using Reciprocal Rank Fusion
query := `
    WITH bm25_results AS (
        SELECT
            id,
            ts_rank_cd(
                to_tsvector('english', title || ' ' || content),
                plainto_tsquery('english', $1)
            ) AS bm25_score,
            ROW_NUMBER() OVER (ORDER BY ts_rank_cd(...) DESC) AS bm25_rank
        FROM documents
        WHERE to_tsvector('english', title || ' ' || content) @@ plainto_tsquery('english', $1)
    ),
    vector_results AS (
        SELECT
            id,
            1 - (embedding <=> $2) AS vector_score,
            ROW_NUMBER() OVER (ORDER BY embedding <=> $2) AS vector_rank
        FROM documents
        WHERE embedding IS NOT NULL
    ),
    combined AS (
        SELECT
            COALESCE(b.id, v.id) AS id,
            -- Reciprocal Rank Fusion score
            (
                COALESCE(1.0 / (60 + b.bm25_rank), 0) * $3 +
                COALESCE(1.0 / (60 + v.vector_rank), 0) * $4
            ) AS combined_score
        FROM bm25_results b
        FULL OUTER JOIN vector_results v ON b.id = v.id
    )
    SELECT * FROM combined
    ORDER BY combined_score DESC
    LIMIT $7
`
Why Reciprocal Rank Fusion (RRF)? Because:
Score normalization: BM25 scores and vector similarities aren’t comparable
Rank-based: Uses position, not raw scores
Research-backed: Used by search engines (Elasticsearch, Vespa)
Tunable: Adjust k parameter (60 in our case) for different behaviors
Part 3: The MCP Server – Secure Document Retrieval
Understanding JSON-RPC 2.0
Before we dive into implementation, let’s understand why MCP chose JSON-RPC 2.0.
Here’s the complete hybrid search tool (hybrid_search.go) implementation with detailed comments:
// mcp-server/internal/tools/hybrid_search.go
type HybridSearchTool struct {
    db database.Store
}

func (t *HybridSearchTool) Execute(ctx context.Context, args map[string]interface{}) (protocol.ToolCallResult, error) {
    // 1. AUTHENTICATION: Extract tenant from JWT claims
    //    This happens at middleware level, but we verify here
    tenantID, ok := ctx.Value(auth.ContextKeyTenantID).(string)
    if !ok {
        return protocol.ToolCallResult{IsError: true}, fmt.Errorf("tenant ID not found in context")
    }

    // 2. PARAMETER PARSING: Extract and validate arguments
    query, _ := args["query"].(string)
    if query == "" {
        return protocol.ToolCallResult{IsError: true}, fmt.Errorf("query is required")
    }

    limit, _ := args["limit"].(float64)
    if limit <= 0 {
        limit = 10 // default
    }
    if limit > 50 {
        limit = 50 // max cap
    }

    bm25Weight, _ := args["bm25_weight"].(float64)
    vectorWeight, _ := args["vector_weight"].(float64)

    // 3. WEIGHT NORMALIZATION: Ensure weights sum to 1.0
    if bm25Weight == 0 && vectorWeight == 0 {
        bm25Weight = 0.5
        vectorWeight = 0.5
    }

    // 4. EMBEDDING GENERATION: Using Ollama for query embedding
    var embedding []float32
    if vectorWeight > 0 {
        embedding = generateEmbedding(query) // Calls Ollama API
    }

    // 5. DATABASE QUERY: Execute hybrid search with RLS
    params := database.HybridSearchParams{
        Query:        query,
        Embedding:    embedding,
        Limit:        int(limit),
        BM25Weight:   bm25Weight,
        VectorWeight: vectorWeight,
    }

    results, err := t.db.HybridSearch(ctx, tenantID, params)
    if err != nil {
        return protocol.ToolCallResult{IsError: true}, err
    }

    // 6. RESPONSE FORMATTING: Convert to JSON for client
    jsonData, _ := json.Marshal(results)
    return protocol.ToolCallResult{
        Content: []protocol.ContentBlock{{Type: "text", Text: string(jsonData)}},
        IsError: false,
    }, nil
}
The NULL Embedding Problem
Real-world data is messy. Not every document has an embedding. Here’s what happened:
Initial Implementation (Broken):
// ? This crashes with NULL embeddings
var embedding pgvector.Vector

err = tx.QueryRow(ctx, query, docID).Scan(
    &doc.ID,
    &doc.TenantID,
    &doc.Title,
    &doc.Content,
    &doc.Metadata,
    &embedding, // CRASH: can't scan <nil> into pgvector.Vector
    &doc.CreatedAt,
    &doc.UpdatedAt,
)
Error:
can't scan into dest[5]: unsupported data type: <nil>
The Fix (Correct):
// ? Use pointer types for nullable fields
var embedding *pgvector.Vector // Pointer allows NULL

err = tx.QueryRow(ctx, query, docID).Scan(
    &doc.ID,
    &doc.TenantID,
    &doc.Title,
    &doc.Content,
    &doc.Metadata,
    &embedding, // Can be NULL now
    &doc.CreatedAt,
    &doc.UpdatedAt,
)

// Handle NULL embeddings gracefully
if embedding != nil && embedding.Slice() != nil {
    doc.Embedding = embedding.Slice()
} else {
    doc.Embedding = nil // Explicitly set to nil
}

return doc, nil
Hybrid search handles this elegantly—documents without embeddings get vector_score = 0 but still appear in results if they match BM25:
-- Hybrid search handles NULL embeddings gracefully
WITH bm25_results AS (
    SELECT id, ts_rank(to_tsvector('english', content), query) AS bm25_score
    FROM documents
    WHERE to_tsvector('english', content) @@ query
),
vector_results AS (
    SELECT id, 1 - (embedding <=> $1) AS vector_score
    FROM documents
    WHERE embedding IS NOT NULL  -- ? Skip NULL embeddings
)
SELECT
    d.*,
    COALESCE(b.bm25_score, 0) AS bm25_score,
    COALESCE(v.vector_score, 0) AS vector_score,
    ($2 * COALESCE(b.bm25_score, 0) + $3 * COALESCE(v.vector_score, 0)) AS combined_score
FROM documents d
LEFT JOIN bm25_results b ON d.id = b.id
LEFT JOIN vector_results v ON d.id = v.id
WHERE COALESCE(b.bm25_score, 0) > 0 OR COALESCE(v.vector_score, 0) > 0
ORDER BY combined_score DESC
LIMIT $4;
Why this matters:
? Documents without embeddings still searchable (BM25)
? New documents usable immediately (embeddings generated async)
? System degrades gracefully (not all-or-nothing)
? Zero downtime for embedding model updates
Tenant Isolation in Action
Every MCP request sets the tenant context at the database transaction level:
// mcp-server/internal/database/postgres.go
func (db *DB) SetTenantContext(ctx context.Context, tx pgx.Tx, tenantID string) error {
    // Note: SET commands don't support parameter binding
    // TenantID is validated as UUID by JWT validator, so this is safe
    query := fmt.Sprintf("SET LOCAL app.current_tenant_id = '%s'", tenantID)
    _, err := tx.Exec(ctx, query)
    return err
}
Combined with RLS policies, this ensures complete tenant isolation at the database level.
Real-world security test:
// Integration test: Verify tenant isolation
func TestTenantIsolation(t *testing.T) {
    // Create documents for two tenants
    tenant1Doc := createDocument(t, db, "tenant-1", "Secret Data A")
    tenant2Doc := createDocument(t, db, "tenant-2", "Secret Data B")

    // Query as tenant-1
    ctx1 := contextWithTenant(ctx, "tenant-1")
    results1, _ := db.ListDocuments(ctx1, "tenant-1", ListParams{Limit: 100})

    // Query as tenant-2
    ctx2 := contextWithTenant(ctx, "tenant-2")
    results2, _ := db.ListDocuments(ctx2, "tenant-2", ListParams{Limit: 100})

    // Assertions
    assert.Contains(t, results1, tenant1Doc)
    assert.NotContains(t, results1, tenant2Doc) // ? Cannot see other tenant

    assert.Contains(t, results2, tenant2Doc)
    assert.NotContains(t, results2, tenant1Doc) // ? Cannot see other tenant
}
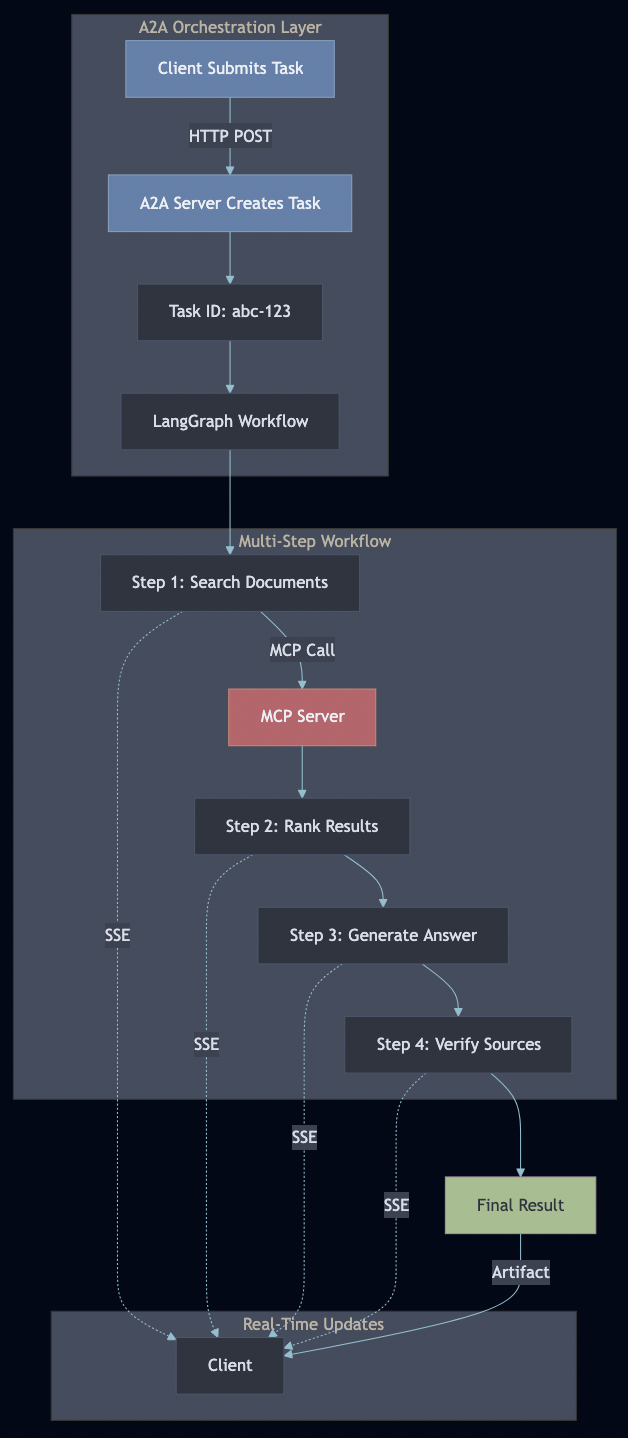
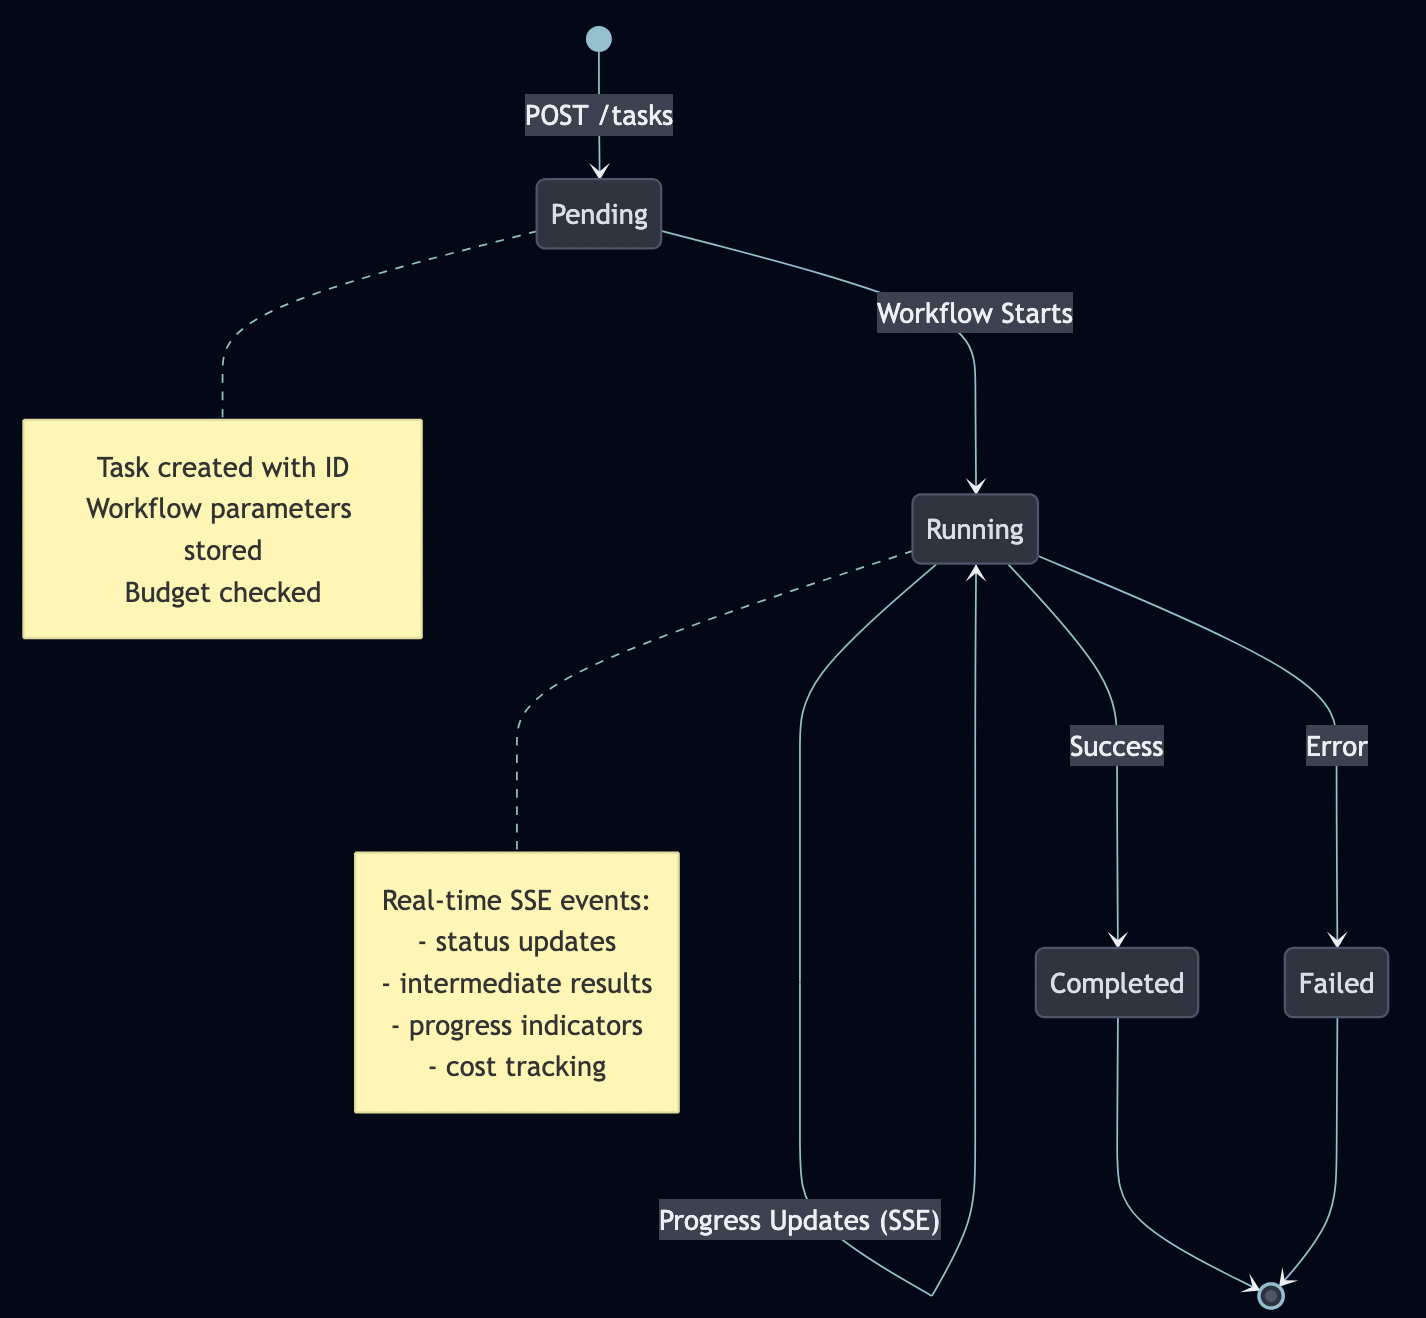
Part 4: The A2A Server – Workflow Orchestration
Task Lifecycle
A2A manages stateful tasks through their entire lifecycle:
Server-Sent Events for Real-Time Updates
Why SSE instead of WebSockets?
Feature
SSE
WebSocket
Unidirectional
? Yes (server?client)
? No (bidirectional)
HTTP/2 multiplexing
? Yes
? No
Automatic reconnection
? Built-in
? Manual
Firewall-friendly
? Yes (HTTP)
?? Sometimes blocked
Complexity
? Simple
? Complex
Browser support
? All modern
? All modern
SSE is perfect for agent progress updates because:
One-way communication (server pushes updates)
Simple implementation
Automatic reconnection
Works through corporate firewalls
SSE provides real-time streaming without WebSocket complexity:
// a2a-server/internal/handlers/tasks.go
func (h *TaskHandler) StreamEvents(w http.ResponseWriter, r *http.Request) {
    taskID := chi.URLParam(r, "taskId")

    // Set SSE headers
    w.Header().Set("Content-Type", "text/event-stream")
    w.Header().Set("Cache-Control", "no-cache")
    w.Header().Set("Connection", "keep-alive")
    w.Header().Set("Access-Control-Allow-Origin", "*")

    flusher, ok := w.(http.Flusher)
    if !ok {
        http.Error(w, "Streaming not supported", http.StatusInternalServerError)
        return
    }

    // Stream task events
    for {
        event := h.taskManager.GetNextEvent(taskID)
        if event == nil {
            break // Task complete
        }

        // Format as SSE event
        data, _ := json.Marshal(event)
        fmt.Fprintf(w, "event: task_update\n")
        fmt.Fprintf(w, "data: %s\n\n", data)
        flusher.Flush()

        if event.Status == "completed" || event.Status == "failed" {
            break
        }
    }
}
Client-side consumption is trivial:
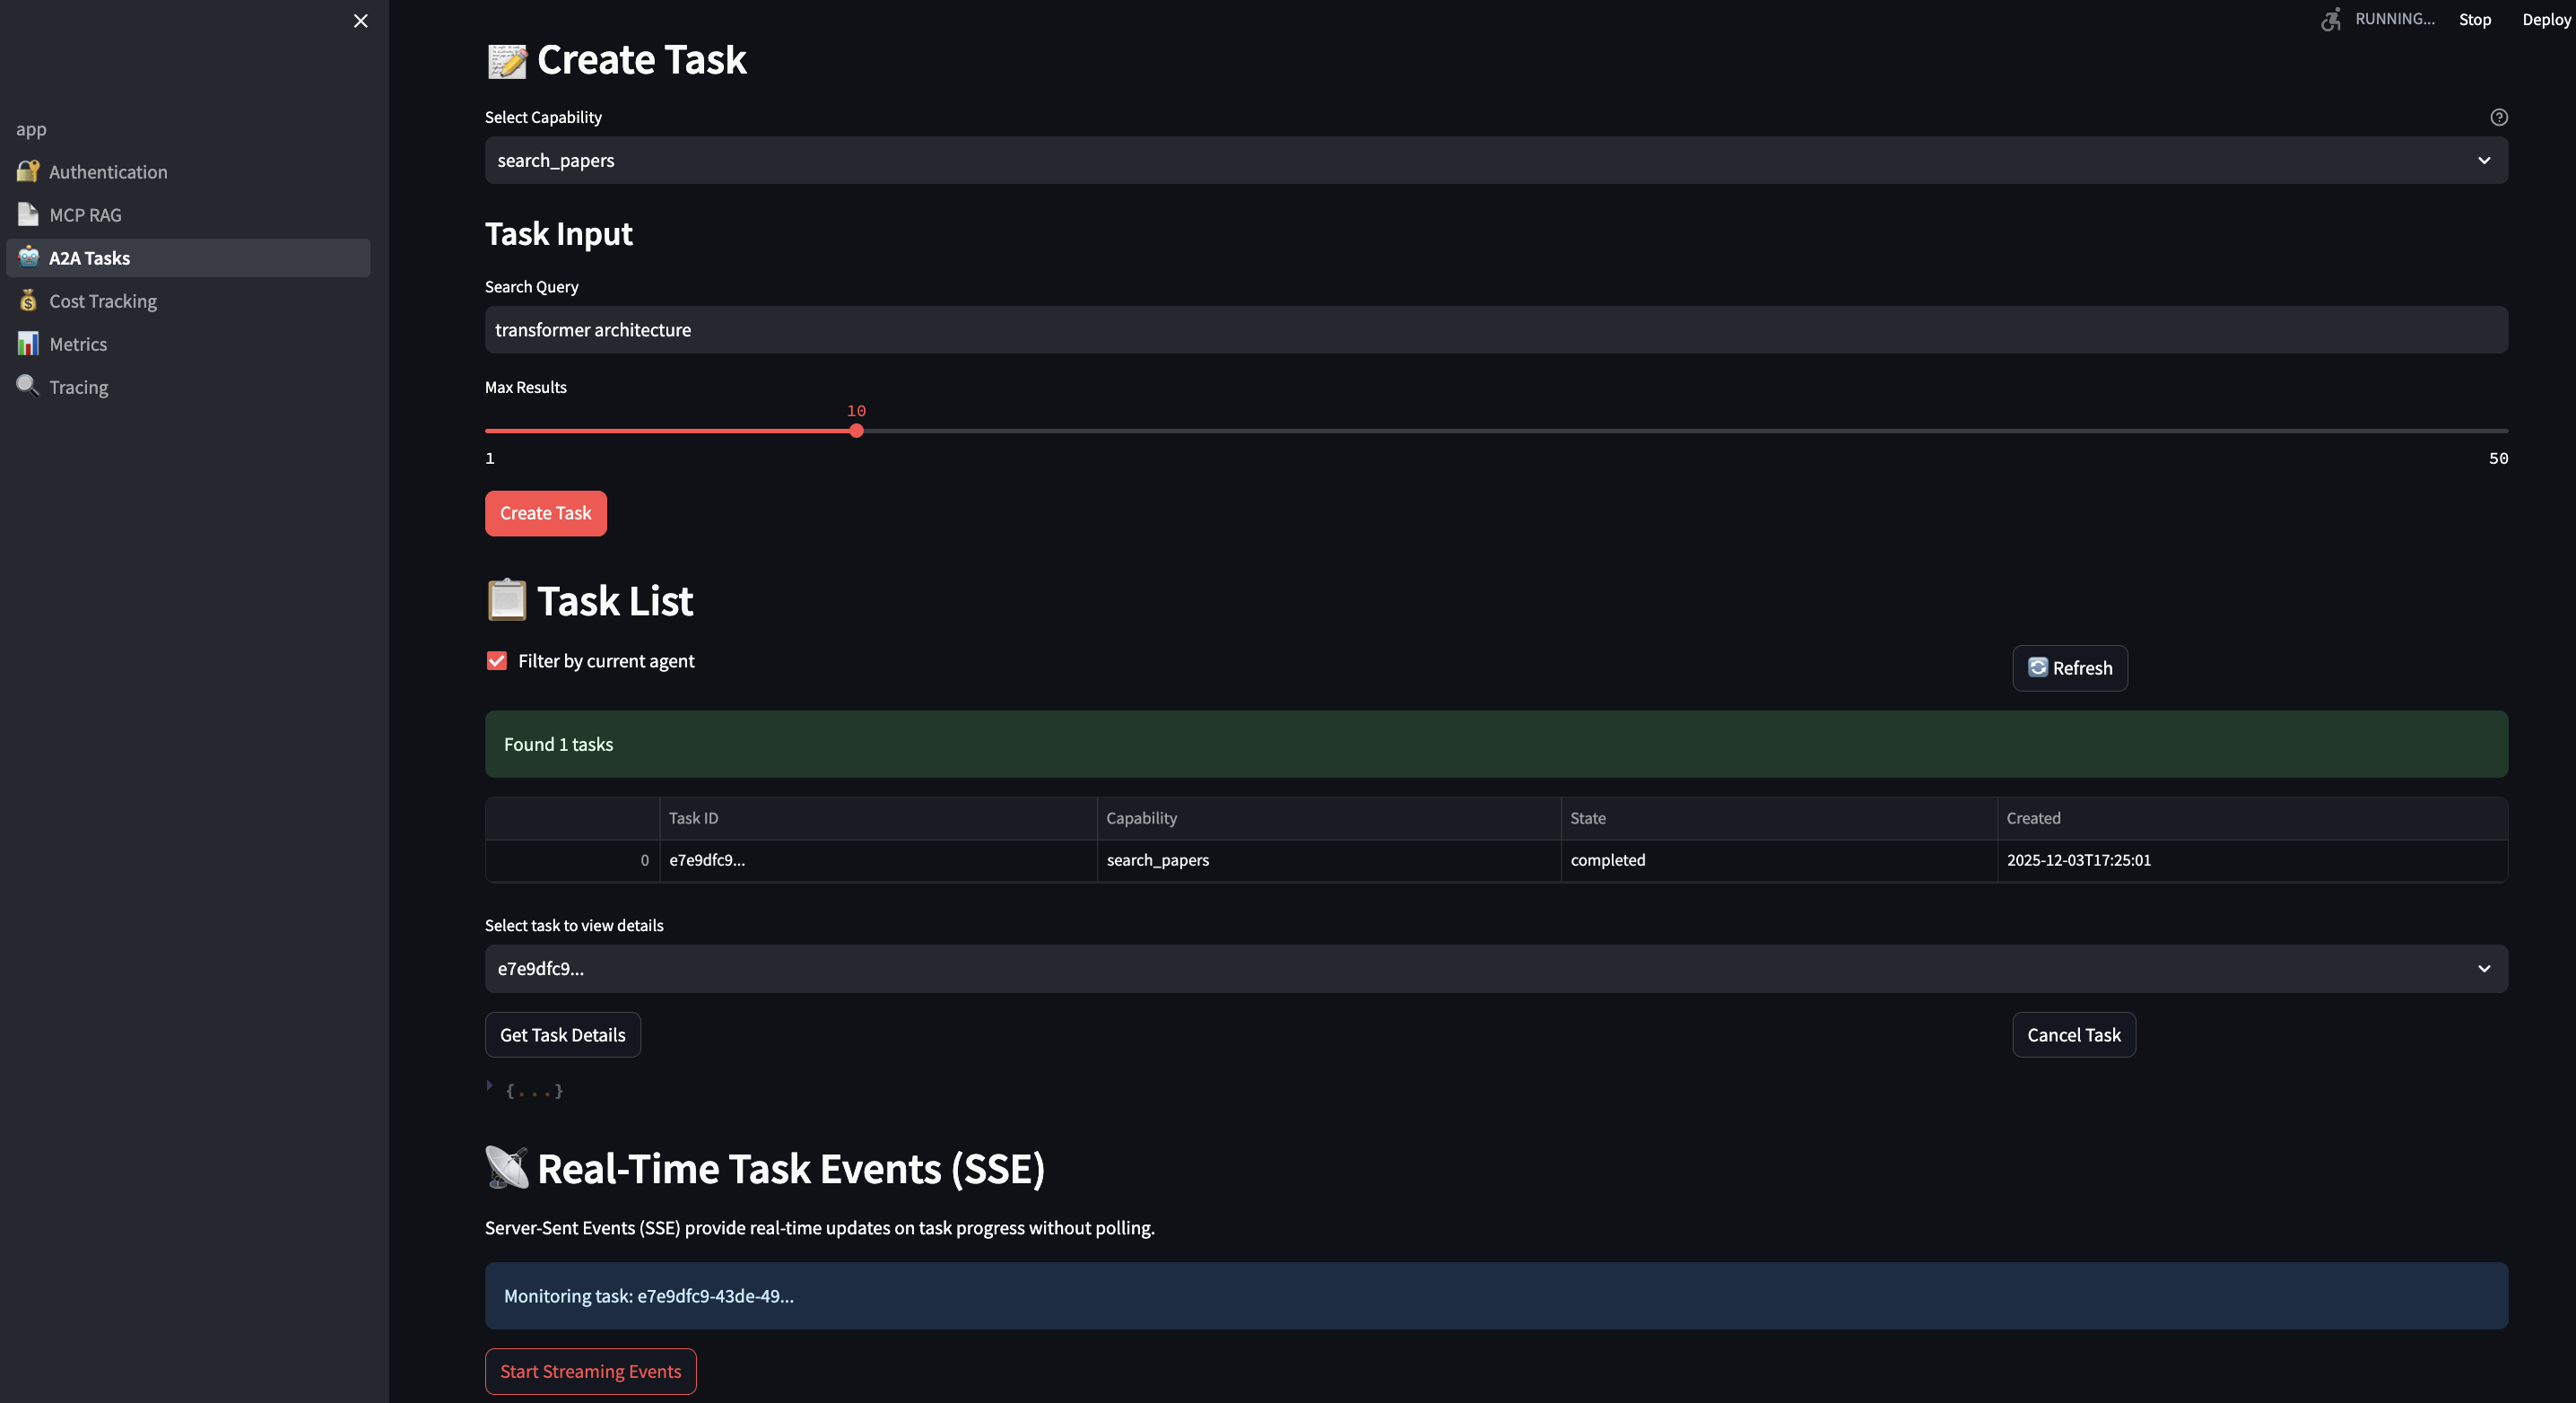
# streamlit-ui/pages/3_?_A2A_Tasks.py
def stream_task_events(task_id: str):
    url = f"{A2A_BASE_URL}/tasks/{task_id}/events"

    with requests.get(url, stream=True) as response:
        for line in response.iter_lines():
            if line.startswith(b'data:'):
                data = json.loads(line[5:])
                st.write(f"Update: {data['message']}")
                yield data
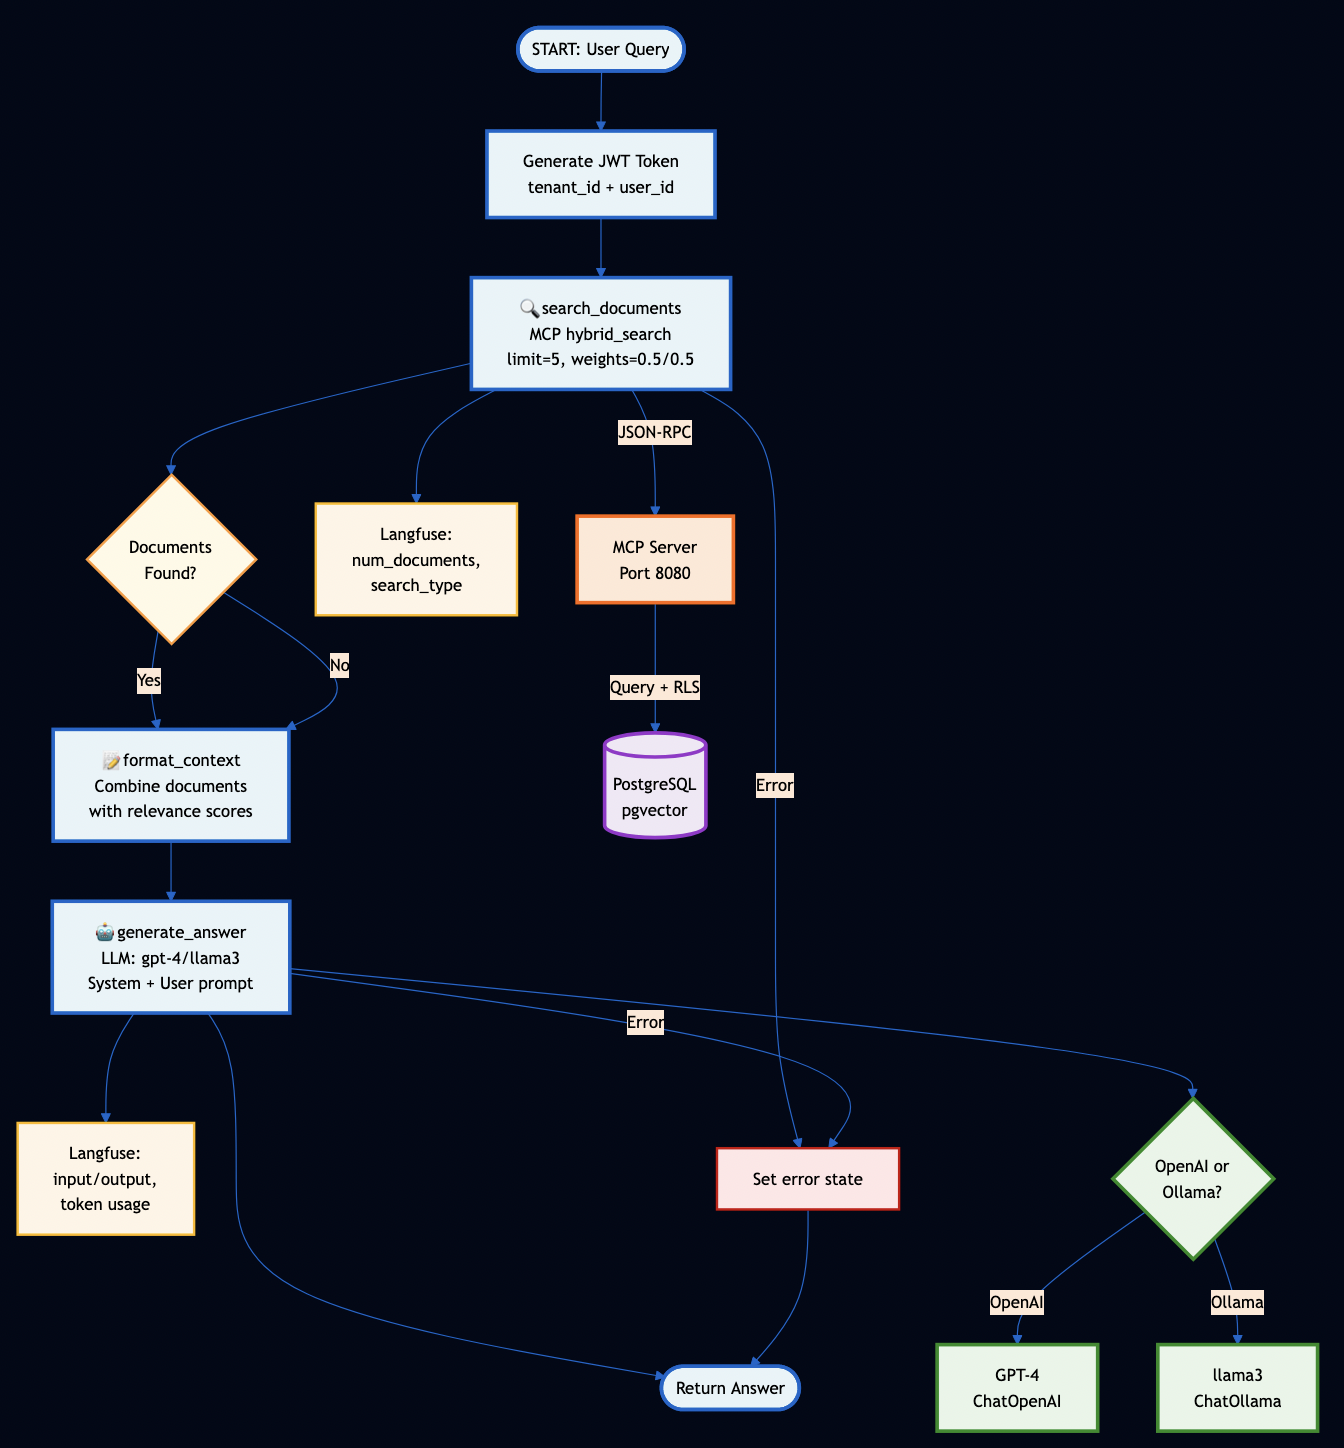
LangGraph Workflow Integration
LangGraph workflows call MCP tools through the A2A server:
# orchestration/workflows/rag_workflow.py
class RAGWorkflow:
    def __init__(self, mcp_url: str):
        self.mcp_client = MCPClient(mcp_url)
        self.workflow = self.build_workflow()

    def build_workflow(self) -> StateGraph:
        workflow = StateGraph(RAGState)

        # Define workflow steps
        workflow.add_node("search", self.search_documents)
        workflow.add_node("rank", self.rank_results)
        workflow.add_node("generate", self.generate_answer)
        workflow.add_node("verify", self.verify_sources)

        # Define edges (workflow graph)
        workflow.add_edge(START, "search")
        workflow.add_edge("search", "rank")
        workflow.add_edge("rank", "generate")
        workflow.add_edge("generate", "verify")
        workflow.add_edge("verify", END)

        return workflow.compile()

    def search_documents(self, state: RAGState) -> RAGState:
        """Search for relevant documents using MCP hybrid search"""
        # This is where MCP and A2A integrate!
        results = self.mcp_client.hybrid_search(
            query=state["query"],
            limit=10,
            bm25_weight=0.5,
            vector_weight=0.5
        )

        state["documents"] = results
        state["progress"] = f"Found {len(results)} documents"

        # Emit progress event via A2A
        emit_progress_event(state["task_id"], "search_complete", state["progress"])

        return state

    def rank_results(self, state: RAGState) -> RAGState:
        """Rank results by combined score"""
        docs = sorted(
            state["documents"],
            key=lambda x: x["score"],
            reverse=True
        )[:5]

        state["ranked_docs"] = docs
        state["progress"] = "Ranked top 5 documents"

        emit_progress_event(state["task_id"], "ranking_complete", state["progress"])

        return state

    def generate_answer(self, state: RAGState) -> RAGState:
        """Generate answer using retrieved context"""
        context = "\n\n".join([
            f"Document: {doc['title']}\n{doc['content']}"
            for doc in state["ranked_docs"]
        ])

        prompt = f"""Based on the following documents, answer the question.

Context:
{context}

Question: {state['query']}

Answer:"""

        # Call Ollama for local inference
        response = ollama.generate(
            model="llama3.2",
            prompt=prompt
        )

        state["answer"] = response["response"]
        state["progress"] = "Generated final answer"

        emit_progress_event(state["task_id"], "generation_complete", state["progress"])

        return state

    def verify_sources(self, state: RAGState) -> RAGState:
        """Verify sources are accurately cited"""
        # Check each cited document exists in ranked_docs
        cited_docs = extract_citations(state["answer"])
        verified = all(doc in state["ranked_docs"] for doc in cited_docs)

        state["verified"] = verified
        state["progress"] = "Verified sources" if verified else "Source verification failed"

        emit_progress_event(state["task_id"], "verification_complete", state["progress"])

        return state
The workflow executes as a multi-step pipeline, with each step:
Calling MCP tools for data access
Updating state
Emitting progress events via A2A
Handling errors gracefully
Part 5: Production-Grade Features
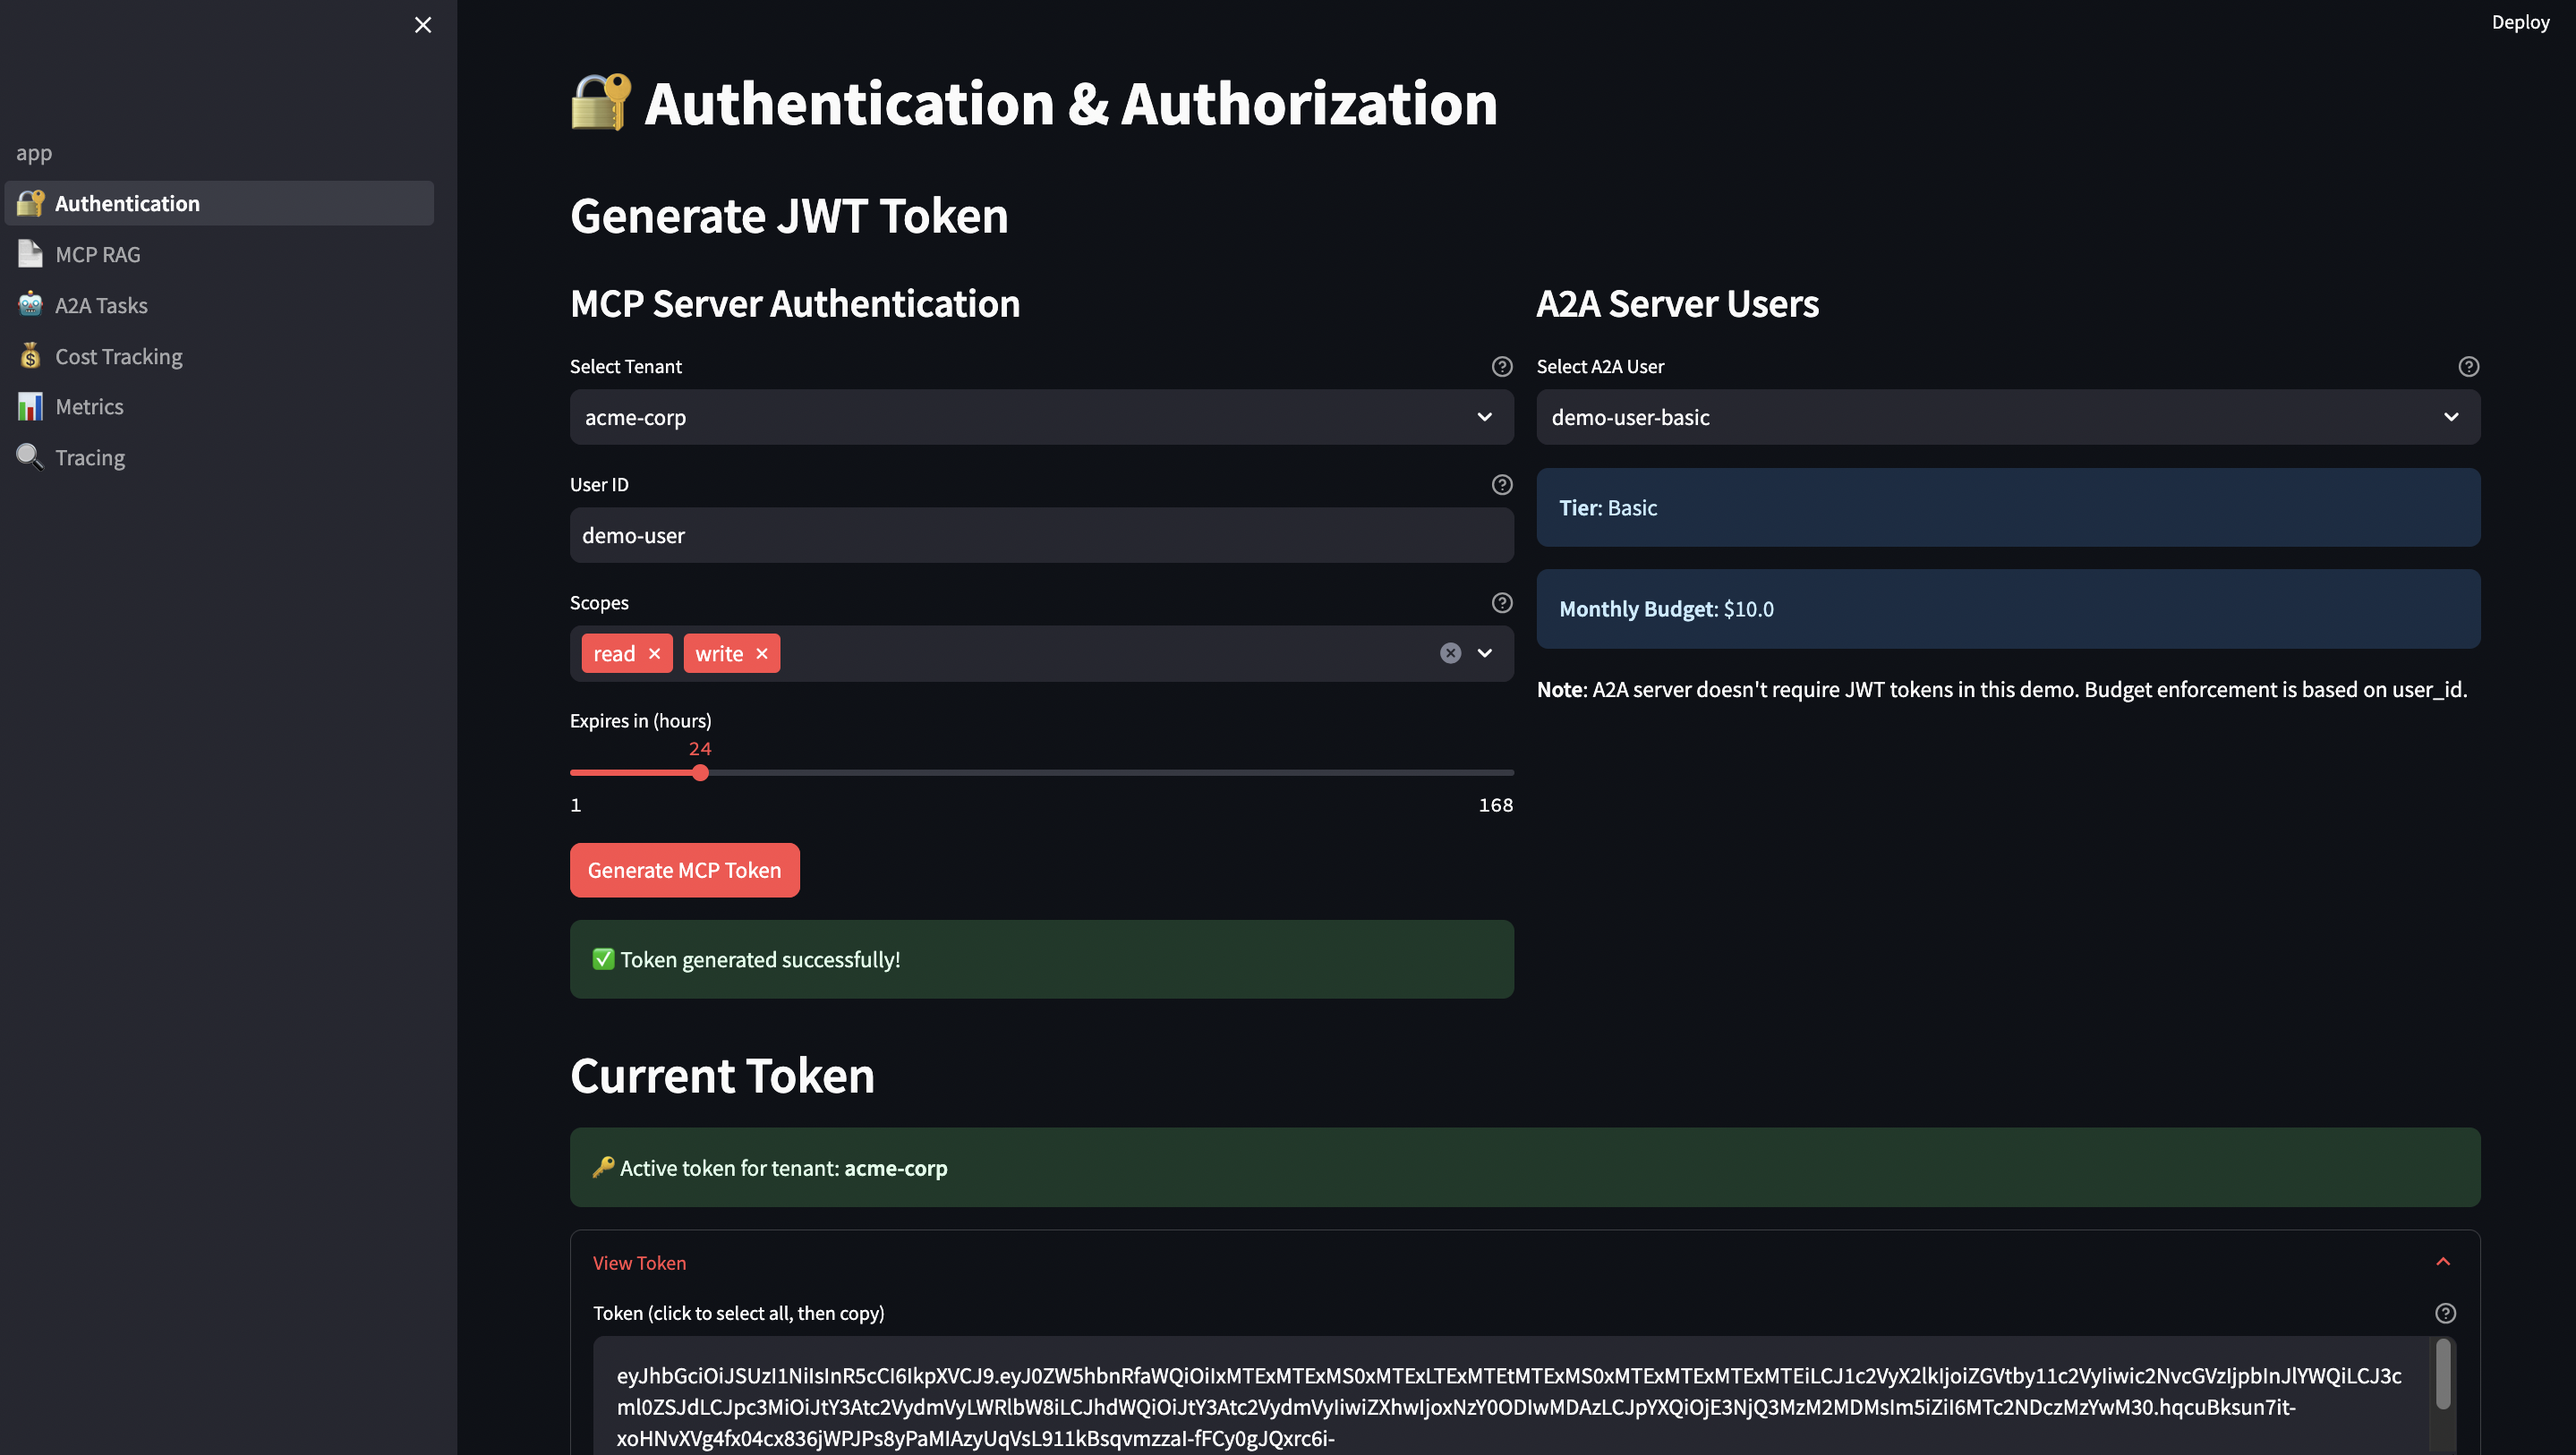
1. Authentication & Security
JWT Token Generation (Streamlit UI):
# streamlit-ui/pages/1_?_Authentication.py
def generate_jwt_token(tenant_id: str, user_id: str, ttl: int = 3600) -> str:
    """Generate RS256 JWT token with proper claims"""
    now = datetime.now(timezone.utc)

    payload = {
        "tenant_id": tenant_id,
        "user_id": user_id,
        "iat": now,              # Issued at
        "exp": now + timedelta(seconds=ttl),  # Expiration
        "nbf": now,              # Not before
        "jti": str(uuid.uuid4()), # JWT ID (for revocation)
        "iss": "mcp-demo-ui",    # Issuer
        "aud": "mcp-server"      # Audience
    }

    # Sign with RSA private key
    with open("/app/certs/private_key.pem", "rb") as f:
        private_key = serialization.load_pem_private_key(
            f.read(),
            password=None
        )

    token = jwt.encode(payload, private_key, algorithm="RS256")
    return token
OpenTelemetry excels at infrastructure observability but lacks LLM-specific context. Langfuse provides deep LLM insights but doesn’t trace service-to-service calls. Together, they provide complete visibility.
Example: End-to-End Trace
Python Workflow (OpenTelemetry + Langfuse):
from opentelemetry import trace
from langfuse.decorators import observe

class RAGWorkflow:
    def __init__(self):
        # OTel for distributed tracing
        self.tracer = setup_otel_tracing("rag-workflow")
        # Langfuse for LLM tracking
        self.langfuse = Langfuse(...)

    @observe(name="search_documents")  # Langfuse tracks this
    def _search_documents(self, state):
        # OTel: Create span for MCP call
        with self.tracer.start_as_current_span("mcp.hybrid_search") as span:
            span.set_attribute("search.query", state["query"])
            span.set_attribute("search.top_k", 5)

            # HTTP request auto-instrumented, propagates trace context
            result = self.mcp_client.hybrid_search(
                query=state["query"],
                limit=5
            )

            span.set_attribute("search.result_count", len(documents))
        return state
MCP Client (W3C Trace Context Propagation):
from opentelemetry.propagate import inject

def _make_request(self, method: str, params: Any = None):
    headers = {'Content-Type': 'application/json'}

    # Inject trace context into HTTP headers
    inject(headers)  # Adds 'traceparent' header

    response = self.session.post(
        f"{self.base_url}/mcp",
        json=payload,
        headers=headers  # Trace continues in Go server
    )
# Unit tests (fast, no dependencies)
cd mcp-server
go test -v ./...

# Integration tests (requires PostgreSQL)
./scripts/run-integration-tests.sh
The integration test script:
Checks if PostgreSQL is running
Waits for database ready
Runs all integration tests
Reports coverage
Output:
? Running MCP Server Integration Tests
========================================
? PostgreSQL is ready

? Running integration tests...

=== RUN   TestGetDocument_WithNullEmbedding
--- PASS: TestGetDocument_WithNullEmbedding (0.05s)
=== RUN   TestGetDocument_WithEmbedding
--- PASS: TestGetDocument_WithEmbedding (0.04s)
=== RUN   TestHybridSearch_HandlesNullEmbeddings
--- PASS: TestHybridSearch_HandlesNullEmbeddings (0.12s)
=== RUN   TestTenantIsolation
--- PASS: TestTenantIsolation (0.08s)
=== RUN   TestConcurrentRetrievals
--- PASS: TestConcurrentRetrievals (2.34s)

PASS
coverage: 95.3% of statements
ok  	github.com/bhatti/mcp-a2a-go/mcp-server/internal/database	3.456s

? Integration tests completed!
Part 7: Real-World Use Cases
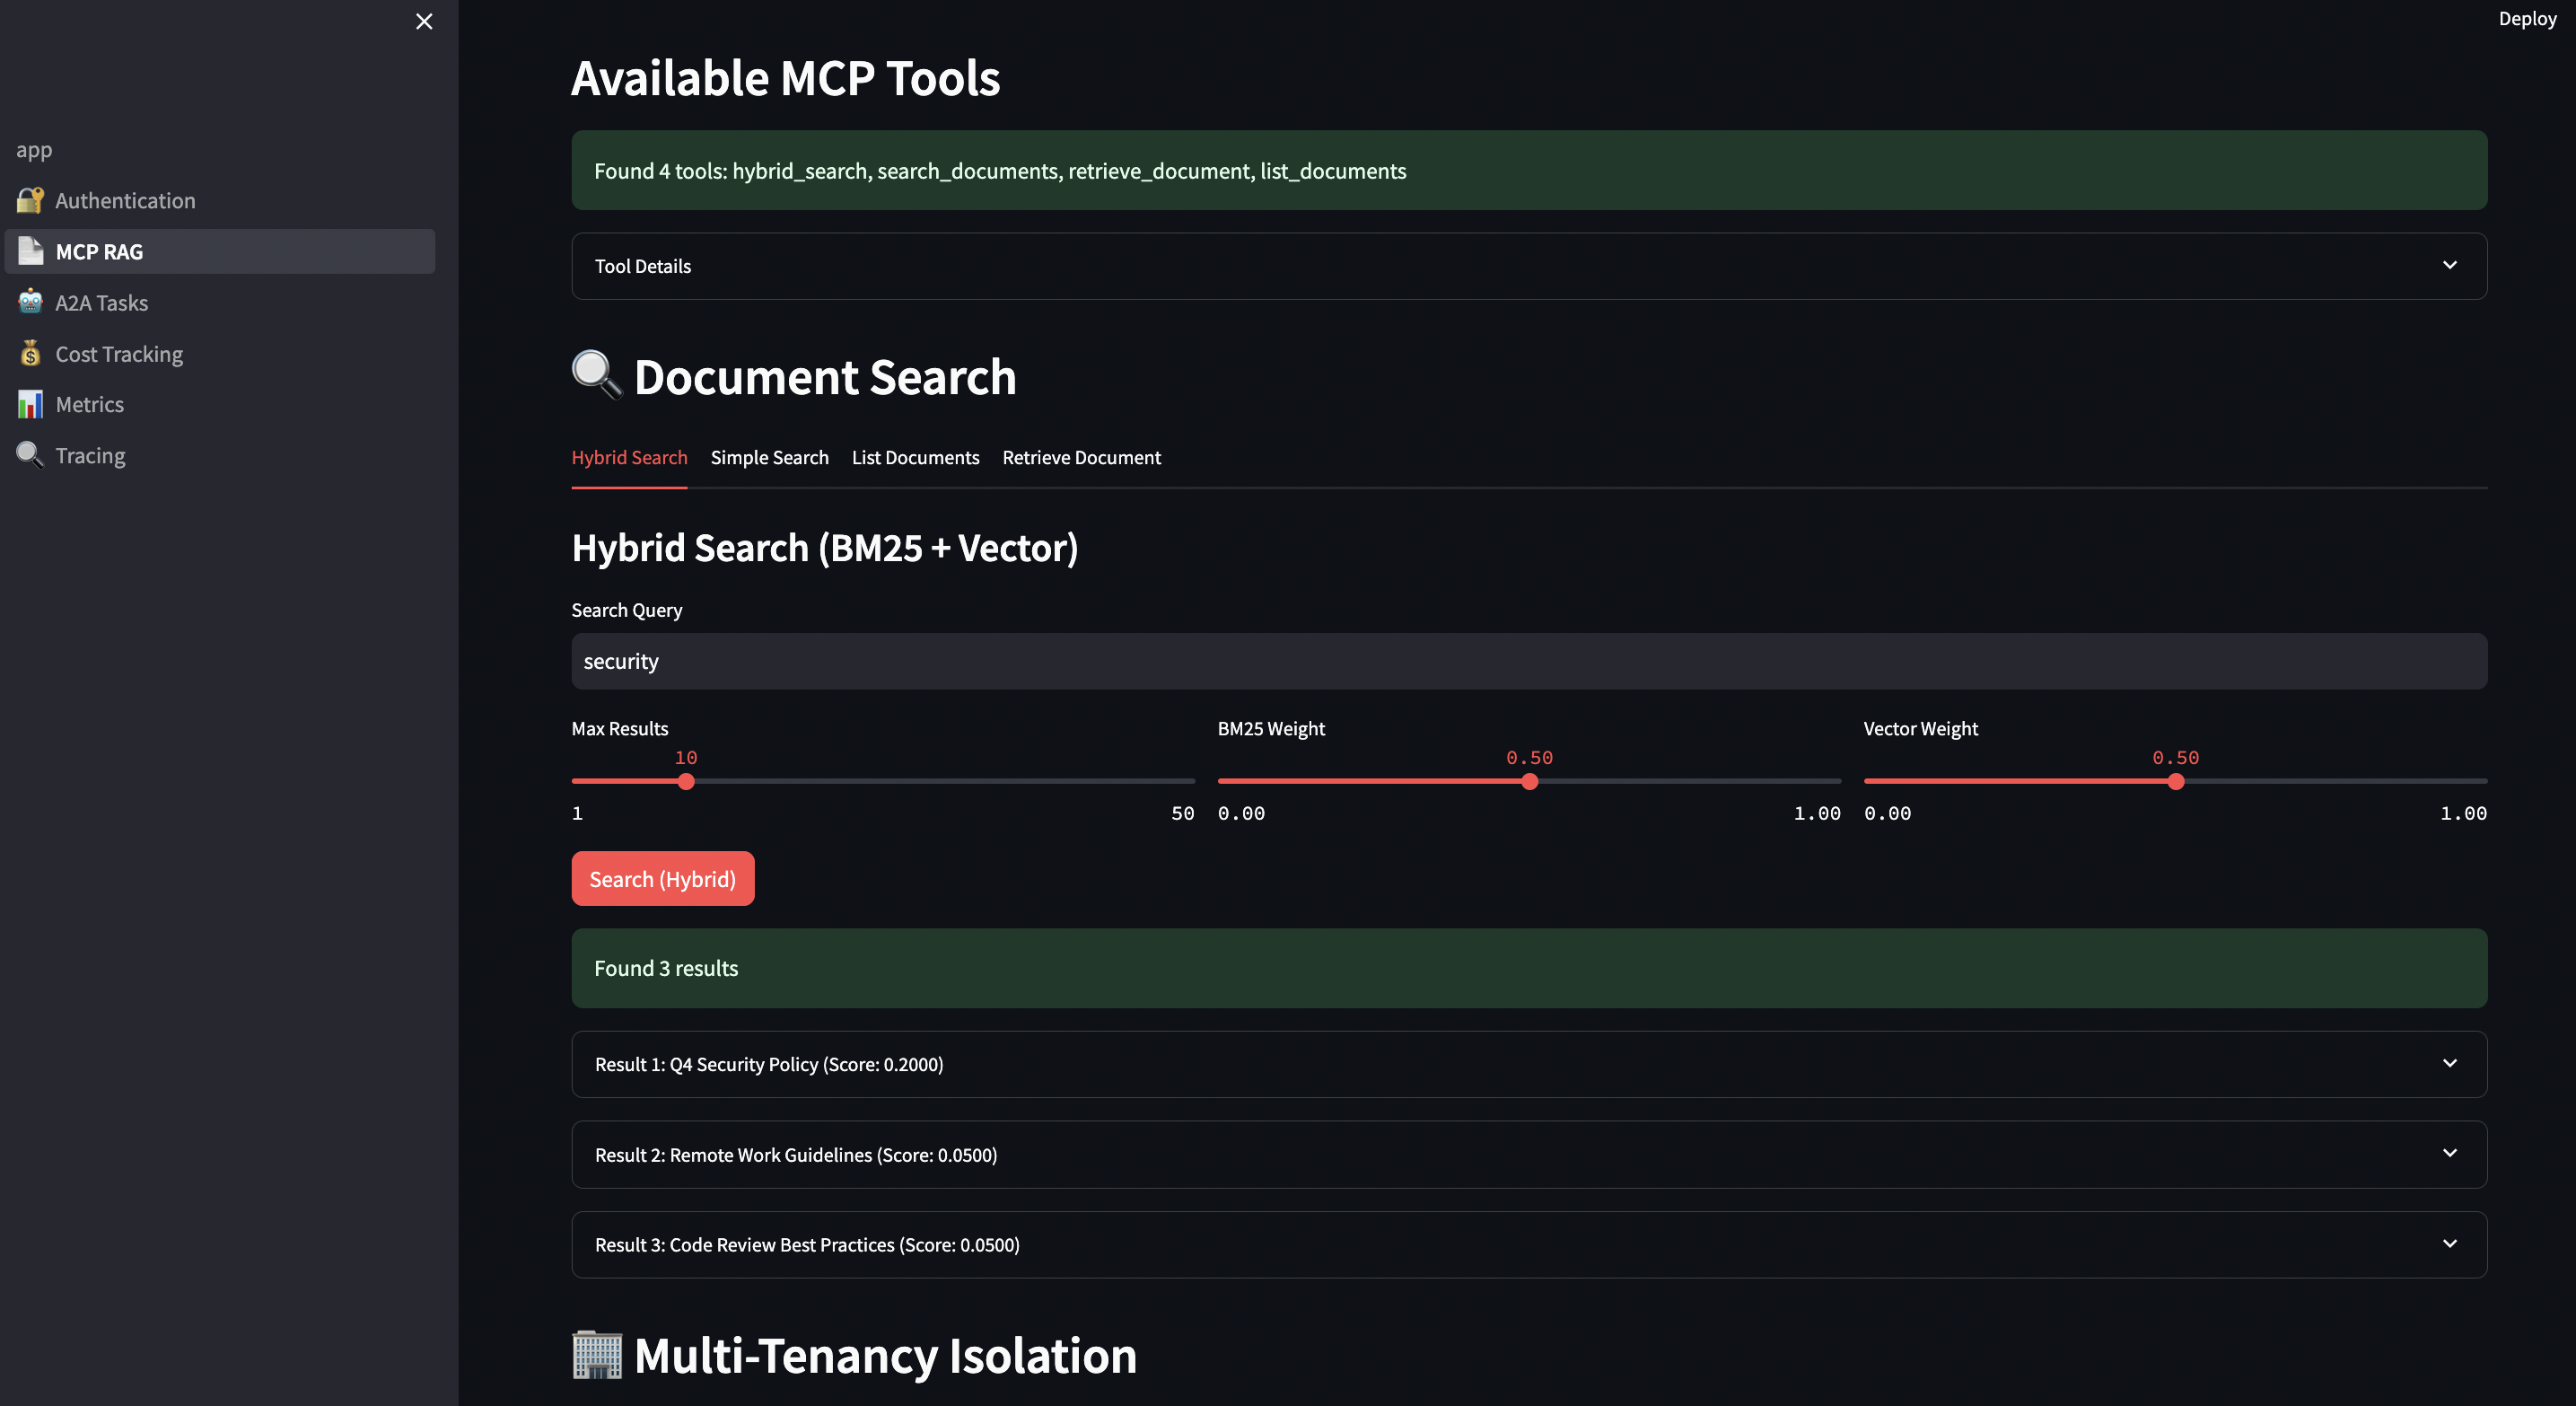
Use Case 1: Enterprise RAG Search
Scenario: Consulting firm managing 50,000+ contract documents across multiple clients. Each client (tenant) must have complete data isolation. Legal team needs to:
Search with exact terms (case citations, contract clauses)
Find semantically similar clauses (non-obvious connections)
Track who accessed what (audit trail)
Enforce budget limits per client matter
Solution: Hybrid search combining BM25 (keywords) and vector similarity (semantics).
# Client code
results = mcp_client.hybrid_search(
    query="data breach notification requirements GDPR Article 33",
    limit=10,
    bm25_weight=0.6,  # Favor exact keyword matches for legal terms
    vector_weight=0.4  # But include semantic similarity
)

for result in results:
    print(f"Document: {result['title']}")
    print(f"BM25 Score: {result['bm25_score']:.2f}")
    print(f"Vector Score: {result['vector_score']:.2f}")
    print(f"Combined: {result['score']:.2f}")
    print(f"Tenant: {result['tenant_id']}")
    print("---")
? Finds documents with exact terms (“GDPR”, “Article 33”)
? Surfaces semantically similar docs (“privacy breach”, “data protection”)
? Tenant isolation ensures Client A can’t see Client B’s contracts
? Audit trail via structured logging
? Cost tracking per client matter
Use Case 2: Multi-Step Research Workflows
Scenario: Investment analyst needs to research a company across multiple data sources:
Company filings (10-K, 10-Q, 8-K)
Competitor analysis
Market trends
Financial metrics
Regulatory filings
News sentiment
Traditional RAG: Query each source separately, manually synthesize results.
With A2A + MCP: Orchestrate multi-step workflow with progress tracking.
# orchestration/workflows/research_workflow.py
class ResearchWorkflow:
    def build_workflow(self):
        workflow = StateGraph(ResearchState)

        # Define research steps
        workflow.add_node("search_company", self.search_company_docs)
        workflow.add_node("search_competitors", self.search_competitors)
        workflow.add_node("search_financials", self.search_financial_data)
        workflow.add_node("analyze_trends", self.analyze_market_trends)
        workflow.add_node("verify_facts", self.verify_with_sources)
        workflow.add_node("generate_report", self.generate_final_report)

        # Define workflow graph
        workflow.add_edge(START, "search_company")
        workflow.add_edge("search_company", "search_competitors")
        workflow.add_edge("search_competitors", "search_financials")
        workflow.add_edge("search_financials", "analyze_trends")
        workflow.add_edge("analyze_trends", "verify_facts")
        workflow.add_edge("verify_facts", "generate_report")
        workflow.add_edge("generate_report", END)

        return workflow.compile()

    def search_company_docs(self, state: ResearchState) -> ResearchState:
        """Step 1: Search company documents via MCP"""
        company = state["company_name"]

        # Call MCP hybrid search
        results = self.mcp_client.hybrid_search(
            query=f"{company} business operations revenue products",
            limit=20,
            bm25_weight=0.5,
            vector_weight=0.5
        )

        state["company_docs"] = results
        state["progress"] = f"Found {len(results)} company documents"

        # Emit progress via A2A SSE
        emit_progress("search_company_complete", state["progress"])

        return state

    def search_competitors(self, state: ResearchState) -> ResearchState:
        """Step 2: Identify and search competitors"""
        company = state["company_name"]

        # Extract competitors from company docs
        competitors = self.extract_competitors(state["company_docs"])

        # Search each competitor
        competitor_data = {}
        for competitor in competitors:
            results = self.mcp_client.hybrid_search(
                query=f"{competitor} market share products revenue",
                limit=10
            )
            competitor_data[competitor] = results

        state["competitors"] = competitor_data
        state["progress"] = f"Analyzed {len(competitors)} competitors"

        emit_progress("search_competitors_complete", state["progress"])

        return state

    def search_financial_data(self, state: ResearchState) -> ResearchState:
        """Step 3: Extract financial metrics"""
        company = state["company_name"]

        # Search for financial documents
        results = self.mcp_client.hybrid_search(
            query=f"{company} revenue earnings profit margin cash flow",
            limit=15,
            bm25_weight=0.7,  # Favor exact financial terms
            vector_weight=0.3
        )

        # Extract key metrics
        metrics = self.extract_financial_metrics(results)

        state["financials"] = metrics
        state["progress"] = f"Extracted {len(metrics)} financial metrics"

        emit_progress("search_financials_complete", state["progress"])

        return state

    def verify_facts(self, state: ResearchState) -> ResearchState:
        """Step 5: Verify all facts with sources"""
        # Check each claim has supporting document
        claims = self.extract_claims(state["report_draft"])

        verified_claims = []
        for claim in claims:
            sources = self.find_supporting_docs(claim, state)
            if sources:
                verified_claims.append({
                    "claim": claim,
                    "sources": sources,
                    "verified": True
                })

        state["verified_claims"] = verified_claims
        state["progress"] = f"Verified {len(verified_claims)} claims"

        emit_progress("verification_complete", state["progress"])

        return state
Benefits:
? Multi-step orchestration with state management
? Real-time progress via SSE (analyst sees each step)
? Intermediate results saved as artifacts
? Each step calls MCP tools for data retrieval
? Final report with verified sources
? Cost tracking across all steps
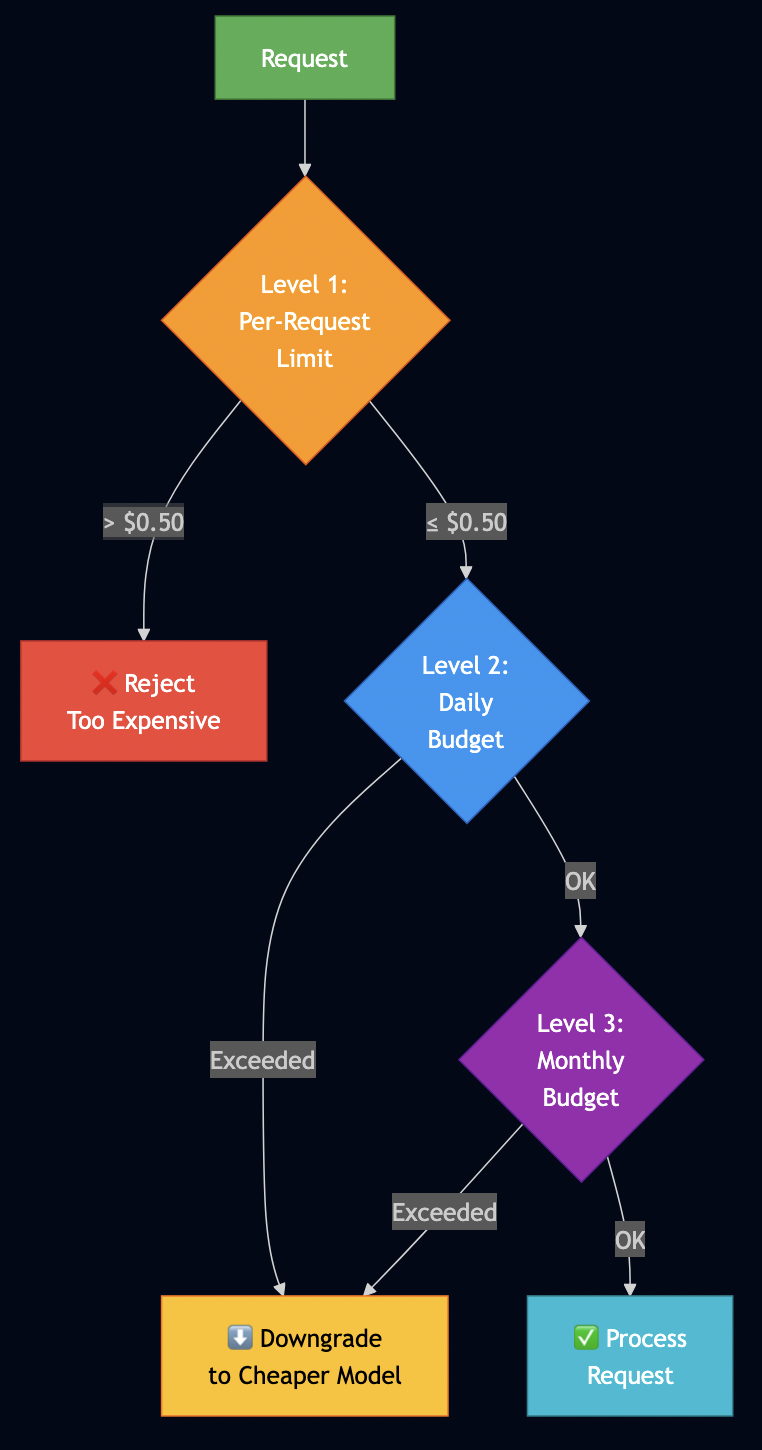
Use Case 3: Budget-Controlled AI Assistance
Scenario: SaaS company (e.g., document management platform) offers AI features to customers based on tiered subscription: Without budget control: Customer on free tier makes 10,000 queries in one day.
With budget control:
# Before each request
tier = get_user_tier(user_id)
budget = BUDGET_TIERS[tier]["monthly_budget"]
allowed, remaining = cost_tracker.check_budget(user_id, budget)

if not allowed:
    raise BudgetExceededError(
        f"Monthly budget of ${budget} exceeded. "
        f"Upgrade to {next_tier} for higher limits."
    )

# Track the request
response = llm.generate(prompt)
cost = cost_tracker.track_request(
    user_id=user_id,
    model="llama3.2",
    input_tokens=len(prompt.split()),
    output_tokens=len(response.split())
)

# Alert when approaching limit
if remaining < 5.0:  # $5 remaining
    send_alert(user_id, f"Budget alert: ${remaining:.2f} remaining")
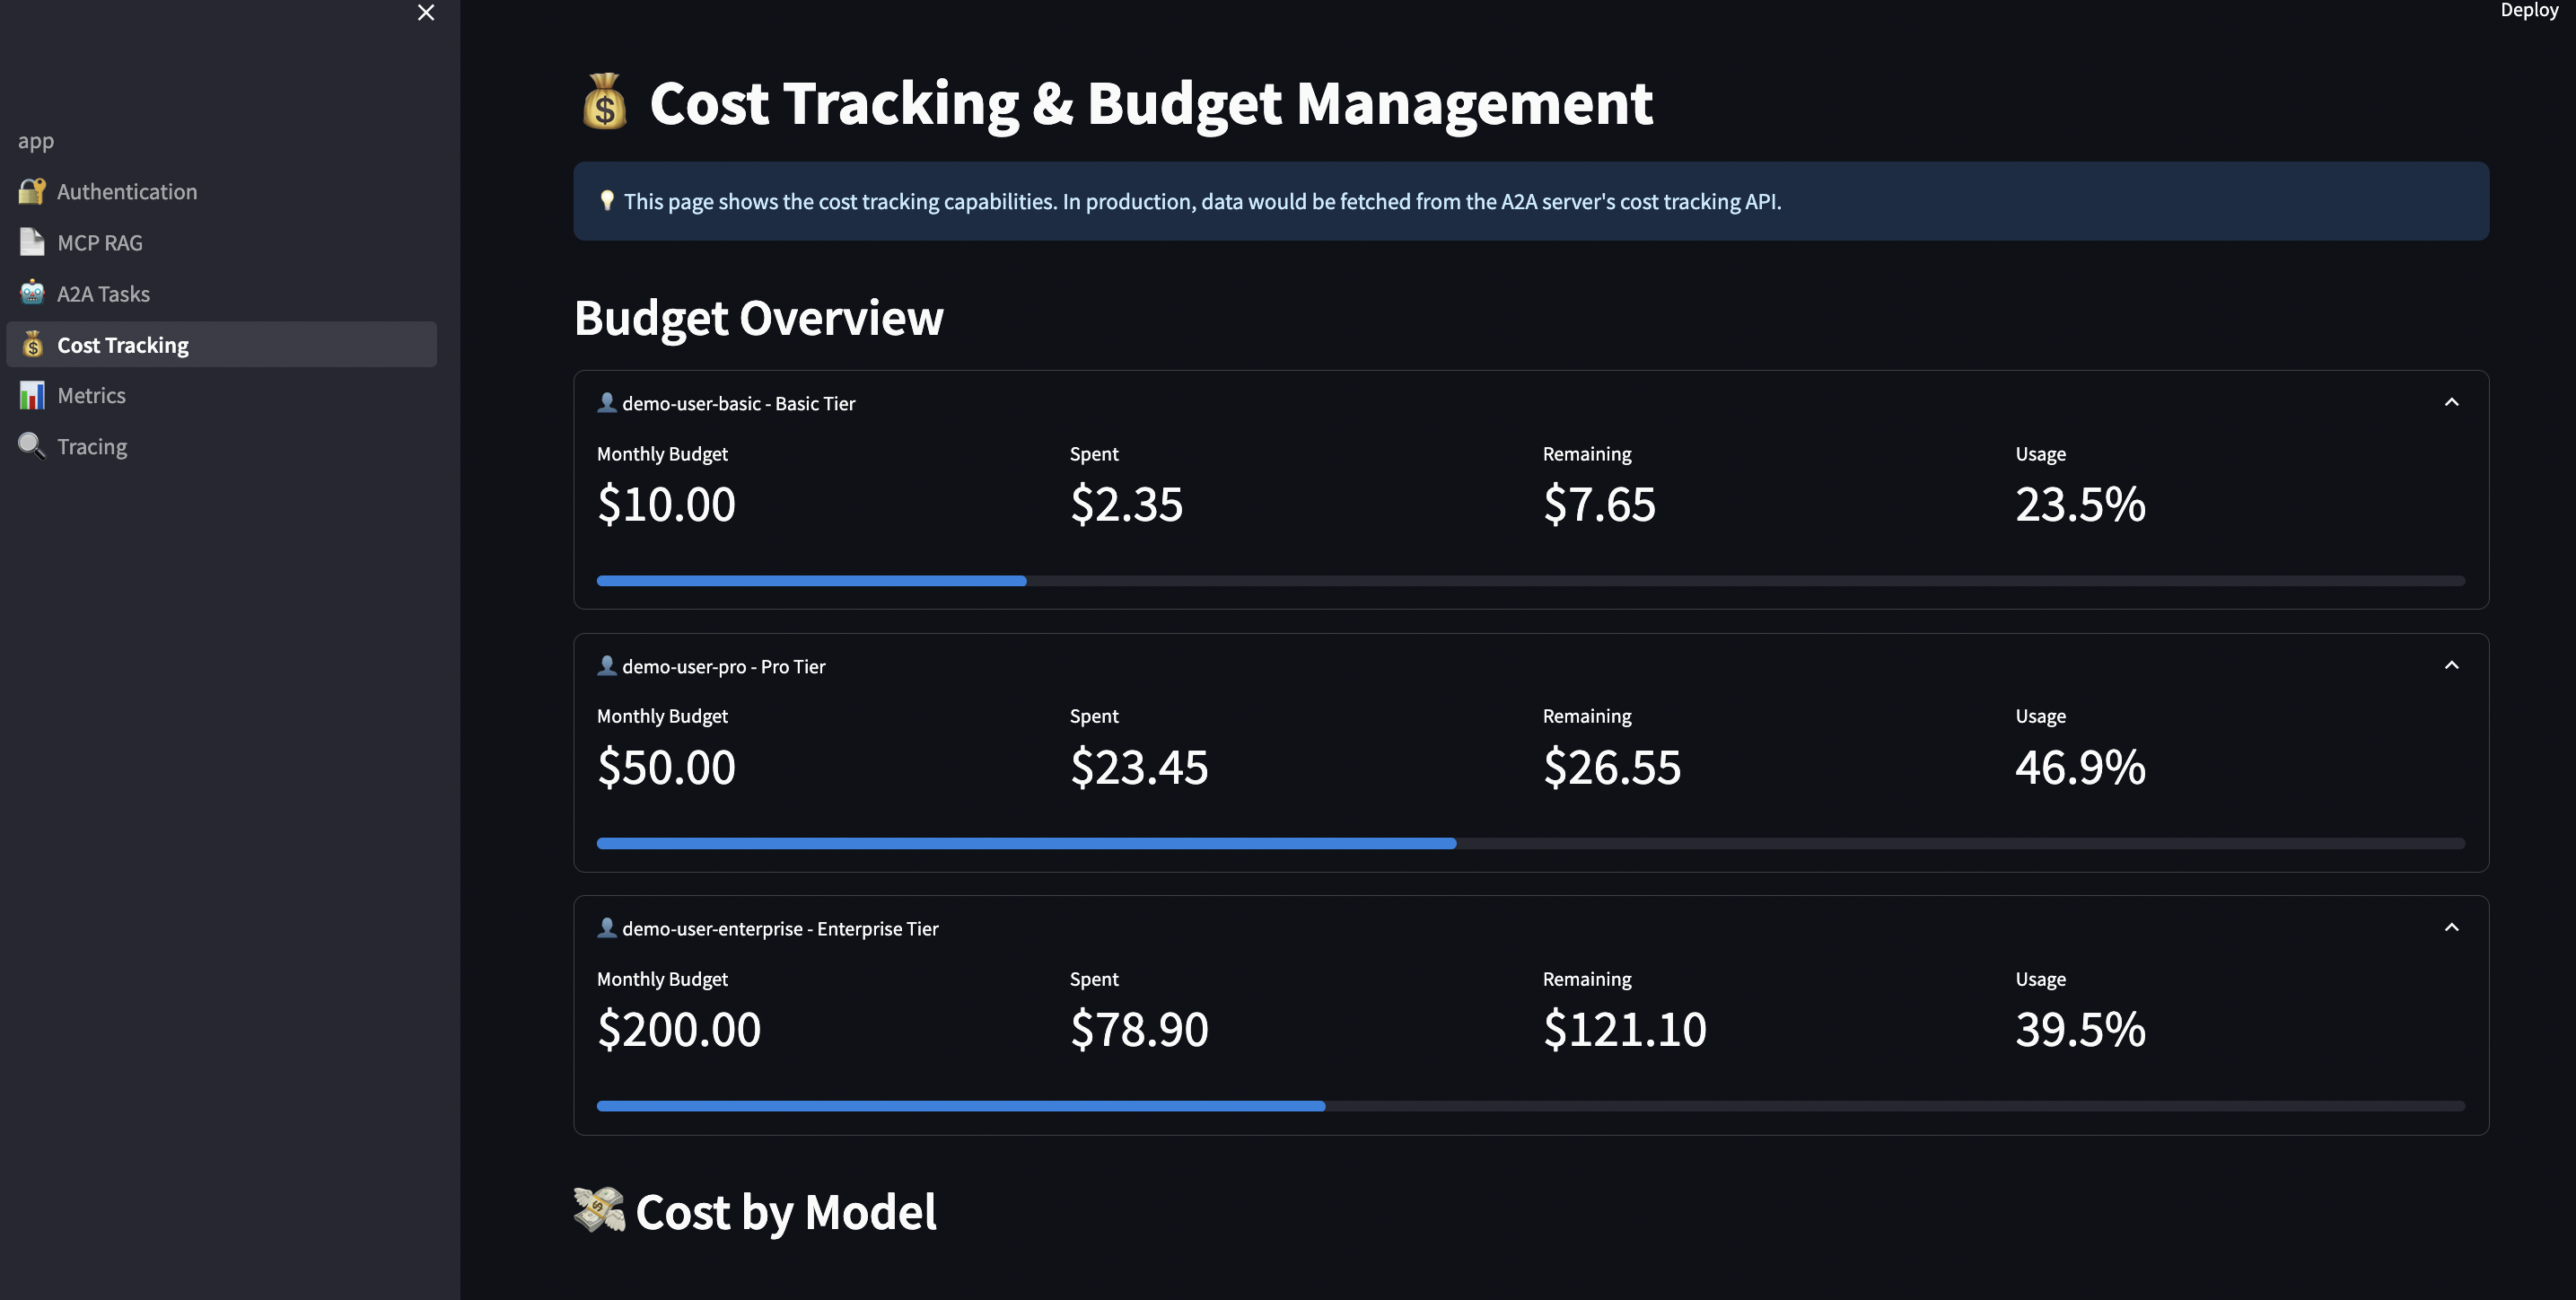
Real-world budget enforcement:
# streamlit-ui/pages/4_?_Cost_Tracking.py
def enforce_budget_limits():
    """Check budget before task creation"""

    user_tier = st.session_state.get("user_tier", "free")
    budget = BUDGET_TIERS[user_tier]["monthly_budget"]

    # Calculate current spend
    spent = cost_tracker.get_total_cost(user_id)
    remaining = budget - spent

    # Display budget status
    col1, col2, col3 = st.columns(3)

    with col1:
        st.metric("Budget", f"${budget:.2f}")

    with col2:
        st.metric("Spent", f"${spent:.2f}",
                 delta=f"-${spent:.2f}", delta_color="inverse")

    with col3:
        progress = (spent / budget) * 100
        st.metric("Remaining", f"${remaining:.2f}")
        st.progress(progress / 100)

    # Block if exceeded
    if remaining <= 0:
        st.error("? Monthly budget exceeded. Upgrade to continue.")
        st.button("Upgrade to Pro ($25/month)", on_click=upgrade_tier)
        return False

    # Warn if close
    if remaining < 5.0:
        st.warning(f"?? Budget alert: Only ${remaining:.2f} remaining this month")

    return True
Benefits:
? Prevent cost overruns per customer
? Fair usage enforcement across tiers
? Export data for billing/accounting
? Different limits per tier
? Automatic alerts before limits
? Graceful degradation (local models for free tier)
5,000+ req/sec means 432 million requests/day per instance
<100ms search means interactive UX
52MB memory means cost-effective scaling
Load Testing Results
# Using hey (HTTP load generator)
hey -n 10000 -c 100 -m POST \
    -H "Authorization: Bearer $TOKEN" \
    -H "Content-Type: application/json" \
    -d '{"jsonrpc":"2.0","id":1,"method":"tools/call","params":{"name":"hybrid_search","arguments":{"query":"machine learning","limit":10}}}' \
    http://localhost:8080/mcp

Summary:
  Total:        19.8421 secs
  Slowest:      0.2847 secs
  Fastest:      0.0089 secs
  Average:      0.1974 secs
  Requests/sec: 503.98

  Status code distribution:
    [200]	10000 responses

Latency distribution:
  10% in 0.0234 secs
  25% in 0.0456 secs
  50% in 0.1842 secs
  75% in 0.3123 secs
  90% in 0.4234 secs
  95% in 0.4867 secs
  99% in 0.5634 secs
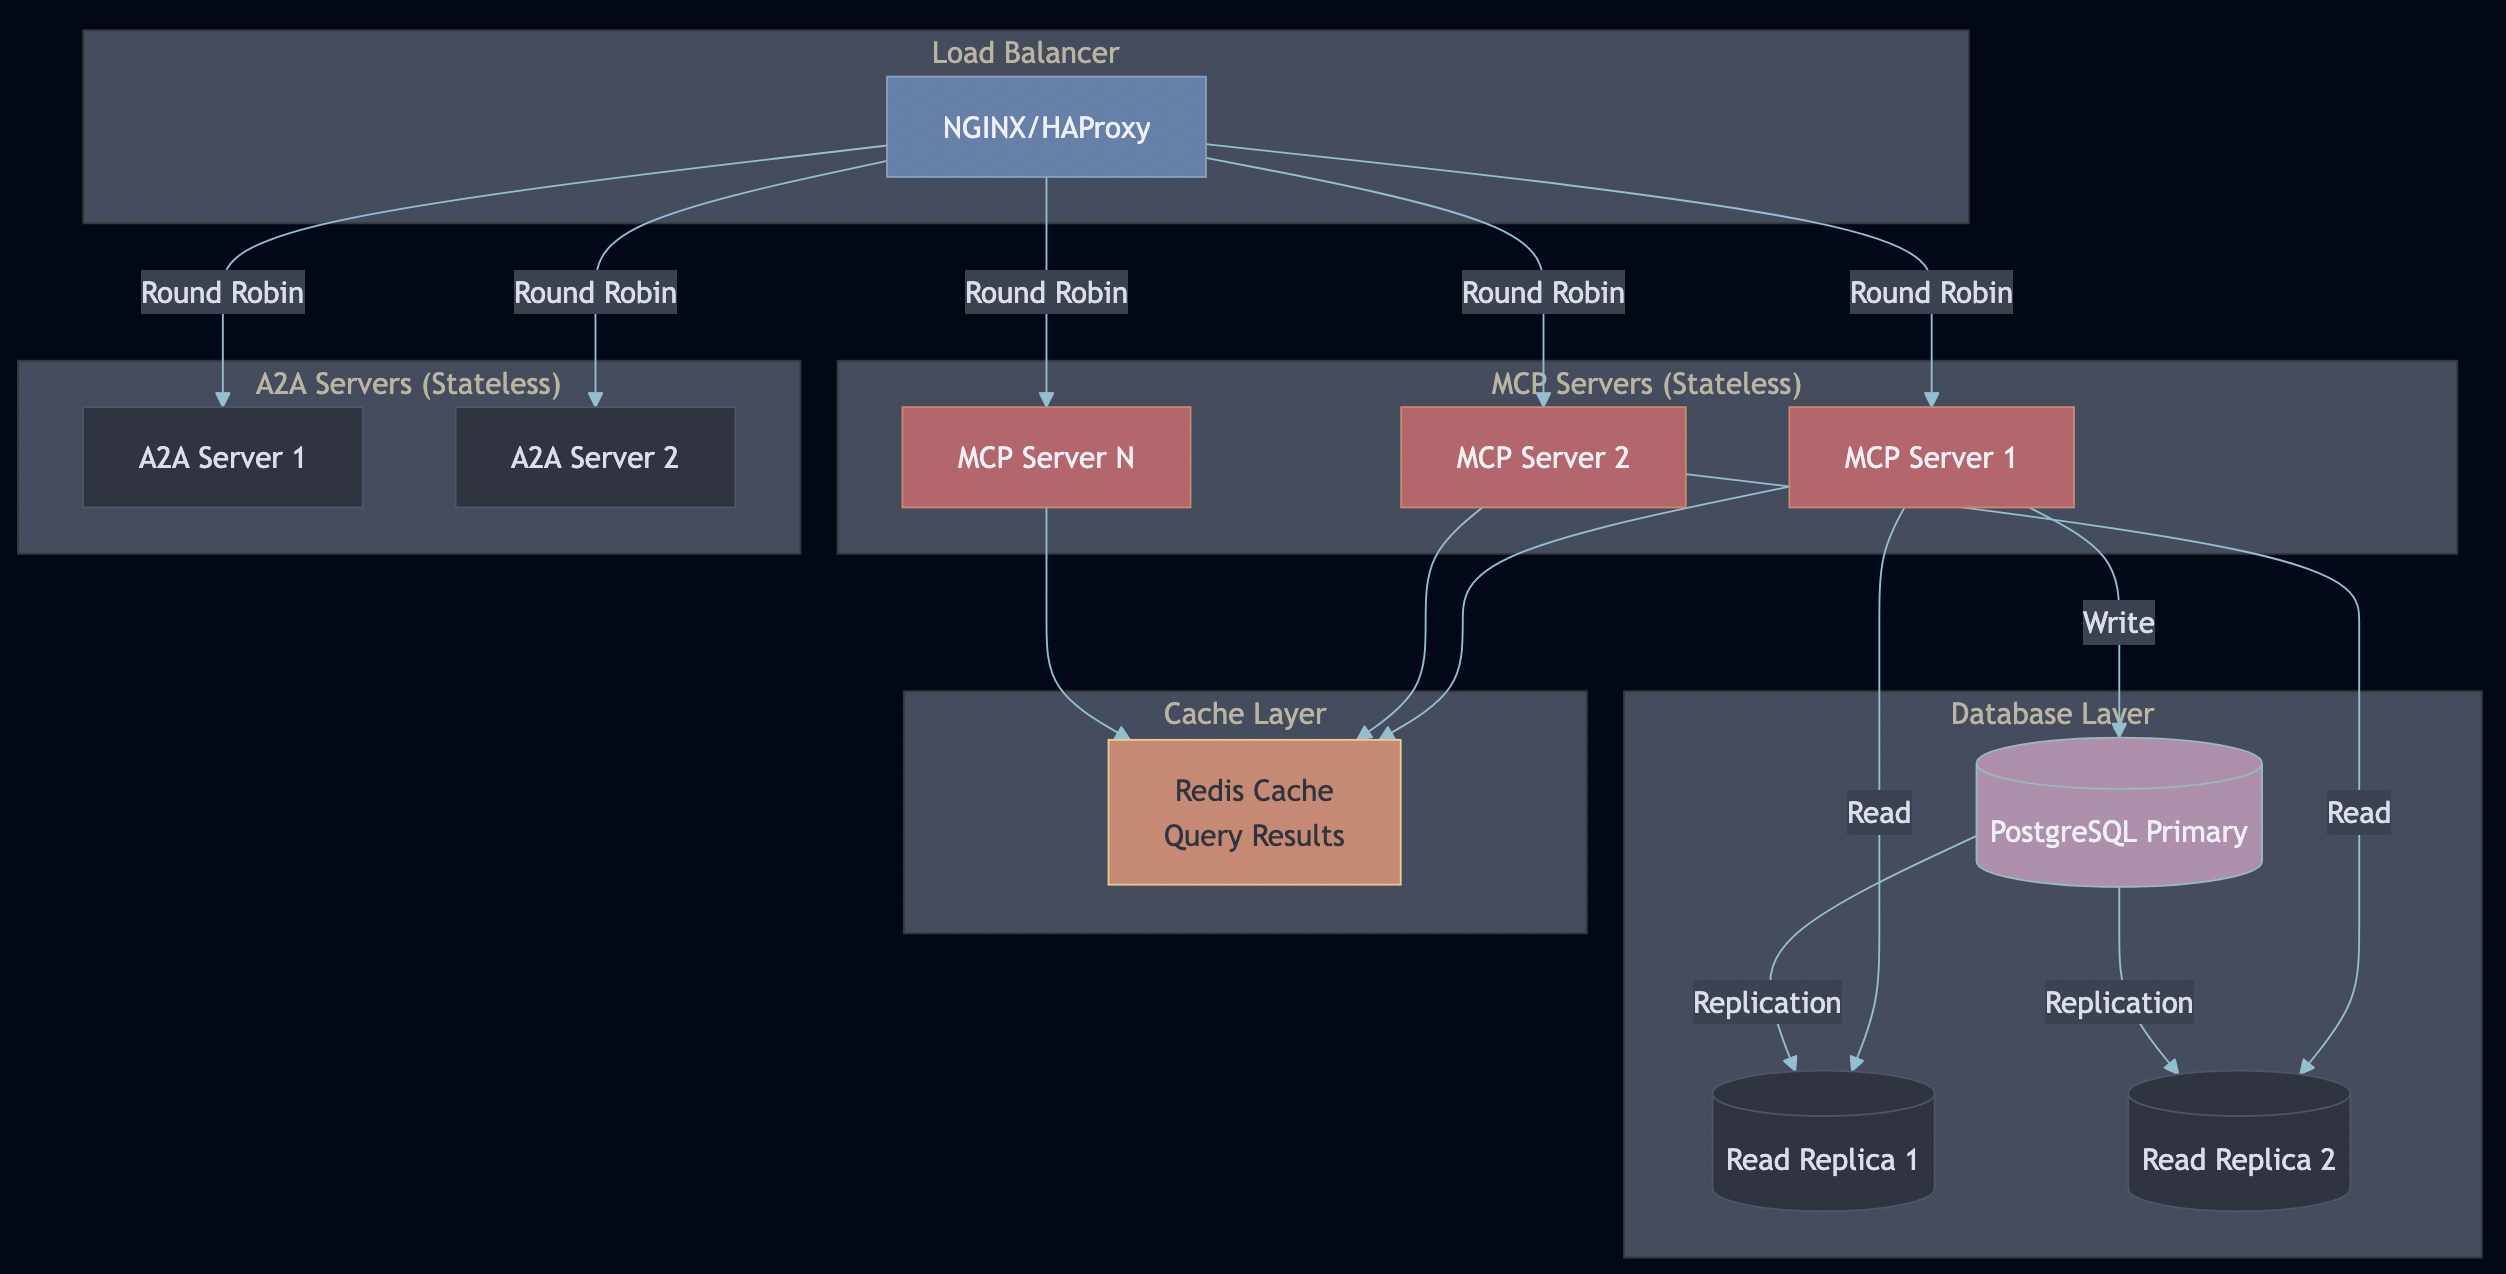
Scaling Strategy
Horizontal Scaling:
MCP and A2A servers are stateless—scale with container replicas
Database read replicas for read-heavy workloads (search queries)
Redis cache for frequently accessed queries (30-second TTL)
Load balancer distributes requests (sticky sessions not needed)
Vertical Scaling:
Increase PostgreSQL resources for larger datasets
Add pgvector HNSW indexes for faster vector search
Tune connection pool sizes (PgBouncer)
When to scale what:
Symptom
Solution
High MCP server CPU
Add more MCP replicas
Slow database queries
Add read replicas
High memory on MCP
Check for memory leaks, add replicas
Cache misses
Increase Redis memory, tune TTL
Slow embeddings
Deploy dedicated embedding service
Part 10: Lessons Learned & Best Practices
1. Go for Protocol Servers
Go’s performance and type safety provides a good support for AI deployment in production.
2. PostgreSQL Row-Level Security
Database-level tenant isolation is non-negotiable for enterprise. Application-level filtering is too easy to screw up. With RLS, even if your application has a bug, the database enforces isolation.
3. Integration Tests Against Real Databases
Unit tests with mocks didn’t catch the NULL embedding issues. Integration tests did. Test against production-like environments.
4. Optional Langfuse
Making Langfuse optional (try/except imports) lets developers run locally without complex setup while enabling full observability in production.
5. Comprehensive Documentation
Document your design and testing process from day one.
Use both Langfuse and OpenTelemetry. OTel traces service flow, Langfuse tracks LLM behavior. They complement, not replace each other.
OpenTelemetry for infrastructure: Trace context propagation across Python ? Go ? Database gave complete visibility into request flow. The traceparent header auto-propagation through requests/httpx made it seamless.
Langfuse for LLM calls: Token counts, costs, and prompt tracking. Essential for budget control and debugging LLM behavior.
Prometheus + Jaeger: Prometheus for metrics dashboards (query “What’s our P95 latency?”), Jaeger for debugging specific slow traces (“Why was this request slow?”).
That’s 10 layers of production concerns. Miss one, and you have a security incident waiting to happen.
Distributed Systems Lessons Apply Here
AI agents are distributed systems. The problems from microservices apply, because agents make autonomous decisions with potentially unbounded costs. From my fault tolerance article, these patterns are essential:
Without timeouts:
embedding = ollama.embed(text) # Ollama down ? hangs forever ? system freezes
Tenant A: 10,000 req/sec ? Database crashes ? ALL tenants down
With rate limiting:
if !rateLimiter.Allow(tenantID) {
    return ErrRateLimitExceeded  // Other tenants unaffected
}
The Bottom Line
MCP and A2A are excellent protocols. They solve real problems:
? MCP standardizes tool execution
? A2A standardizes agent coordination
But protocols are not products. Building on MCP/A2A is like building on HTTP—the protocol is solved, but you still need web servers, frameworks, security layers, and monitoring tools.
This repository shows the other 90%:
Real authentication (not “TODO: add auth”)
Real multi-tenancy (database RLS, not app filtering)
Real observability (Langfuse integration, not “we should add logging”)
Real testing (integration tests, not just mocks)
Real deployment (K8s manifests, not “works on my laptop”)
Get Started
git clone https://github.com/bhatti/mcp-a2a-go
cd mcp-a2a-go
docker compose up -d
./scripts/run-integration-tests.sh
open http://localhost:8501
Building distributed systems means confronting failure modes that are nearly impossible to reproduce in development or testing environments. How do you test for metastable failures that only emerge under specific load patterns? How do you validate that your quorum-based system actually maintains consistency during network partitions? How do you catch cross-system interaction bugs when both systems work perfectly in isolation? Integration testing, performance testing, and chaos engineering all help, but they have limitations. For the past few years, I’ve been using simulation to validate boundary conditions that are hard to test in real environments. Interactive simulators let you tweak parameters, trigger failure scenarios, and see the consequences immediately through metrics and visualizations.
In this post, I will share four simulators I’ve built to explore the failure modes and consistency challenges that are hardest to test in real systems:
Metastable Failure Simulator: Demonstrates how retry storms create self-sustaining collapse
CAP/PACELC Consistency Simulator: Shows the real tradeoffs between consistency, availability, and latency
CRDT Simulator: Explores conflict-free convergence without coordination
Cross-System Interaction (CSI) Failure Simulator: Reveals how correct systems fail through their interactions
Each simulator is built on research findings and real-world incidents. The goal isn’t just to understand these failure modes intellectually, but to develop intuition through experimentation. All simulators available at: https://github.com/bhatti/simulators.
Part 1: Metastable Failures
The Problem: When Systems Attack Themselves
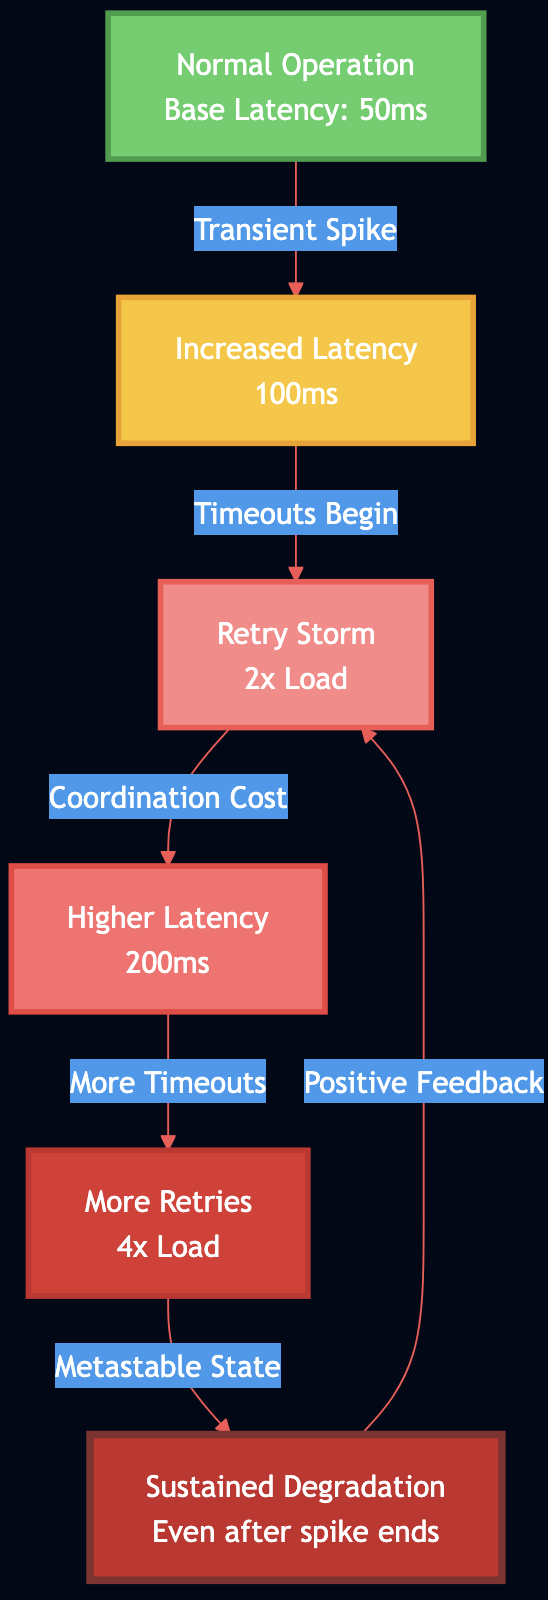
Metastable failures are particularly insidious because the initial trigger can be small and transient, but the system remains degraded long after the trigger is gone. Research in the metastable failures has shown that traditional fault tolerance mechanisms don’t protect against metastability because the failure is self-sustaining through positive feedback loops in retry logic and coordination overhead. The mechanics are deceptively simple:
A transient issue (network blip, brief CPU spike) causes some requests to slow down
Slow requests start timing out
Clients retry timed-out requests, adding more load
The system is now in a stable degraded state, even though the original trigger is gone
For example, AWS Kinesis experienced a 7+ hour outage in 2020 where a transient metadata mismatch triggered retry storms across the fleet. Even after the original issue was fixed, the retry behavior kept the system degraded. The recovery required externally rate-limiting client retries.
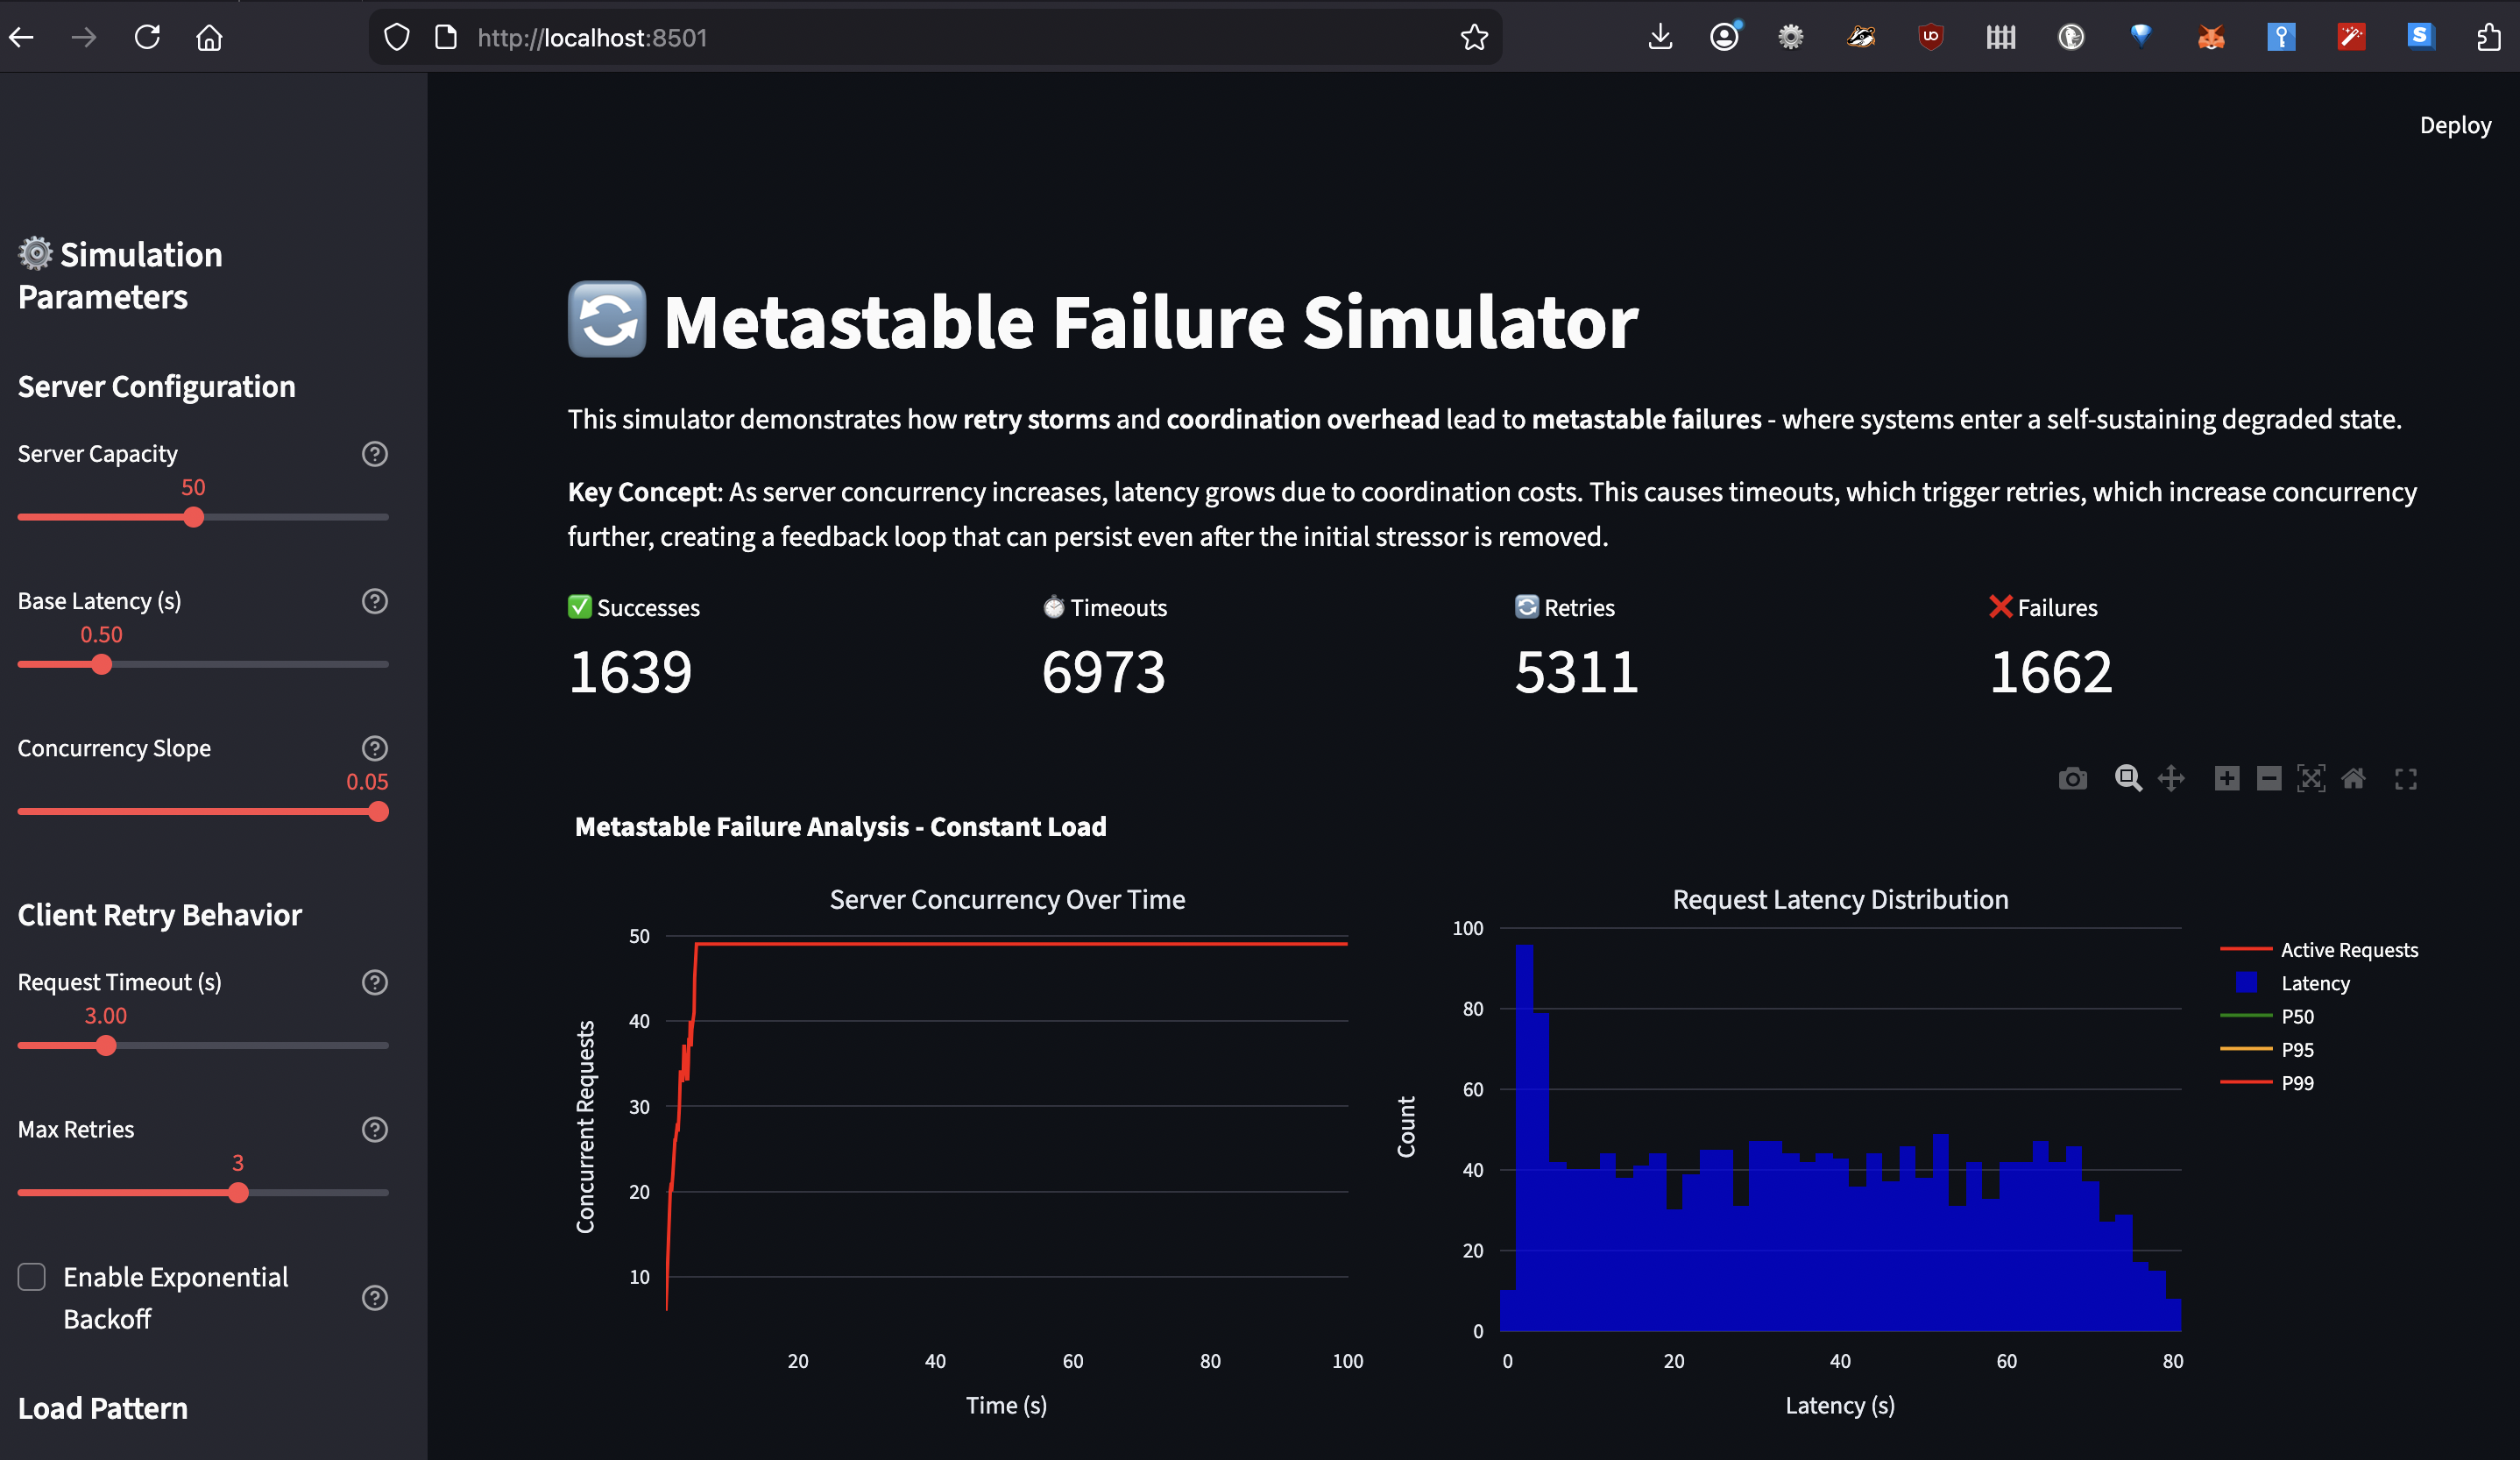
How the Simulator Works
The metastable failure simulator models this feedback loop using discrete event simulation (SimPy). Here’s what it simulates:
Server Model:
Base latency: Time to process a request with no contention
Concurrency slope: Additional latency per concurrent request (coordination cost)
Capacity: Maximum concurrent requests before queueing
# Latency grows linearly with active requests
def current_latency(self):
    return self.base_latency + (self.active_requests * self.concurrency_slope)
Client Model:
Timeout threshold: When to give up on a request
Max retries: How many times to retry
Backoff strategy: Exponential backoff with jitter (configurable)
Load Patterns:
Constant: Steady baseline load
Spike: Sudden increase for a duration, then back to baseline
Ramp: Gradual increase and decrease
Key Parameters to Experiment With:
Parameter
What It Tests
Typical Values
server_capacity
How many concurrent requests before queueing
20-100
base_latency
Processing time without contention
0.1-1.0s
concurrency_slope
Coordination overhead per request
0.001-0.05s
timeout
When clients give up
1-10s
max_retries
Retry attempts before failure
0-5
backoff_enabled
Whether to add jitter and delays
True/False
What You Can Learn:
Trigger a metastable failure: Set spike load high, timeout low, disable backoff ? watch P99 latency stay high after spike ends
See recovery with backoff: Same scenario but enable exponential backoff ? system recovers when spike ends
Understand the tipping point: Gradually increase concurrency slope ? observe when retry amplification begins
Test admission control: Set low server capacity ? see benefit of failing fast vs queueing
The simulator tracks success rate, retry count, timeout count, and latency percentiles over time, letting you see exactly when the system tips into metastability and whether it recovers. With this simulator you can validate various prevention strategies such as:
Exponential backoff with jitter spreads retries over time
Adaptive retry budgets limit total fleet-wide retries
Circuit breakers detect patterns and stop retry storms
Load shedding rejects requests before queues explode
Part 2: CAP and PACELC
The CAP theorem correctly states that during network partitions, you must choose between consistency and availability. However, as Daniel Abadi and others have pointed out, this only addresses partition scenarios. Most systems spend 99.99% of their time in normal operation, where the real tradeoff is between latency and consistency. This is where PACELC comes in:
If Partition happens: choose Availability or Consistency
Else (normal operation): choose Latency or Consistency
PACELC provides a more complete framework for understanding real-world distributed databases:
PA/EL Systems (DynamoDB, Cassandra, Riak):
Partition ? Choose Availability (serve stale data)
Normal ? Choose Latency (1-2ms reads from any replica)
Use when: Shopping carts, session stores, high write throughput needed
Normal ? Choose Consistency (5-100ms for quorum coordination)
Use when: Financial transactions, inventory, anything that can’t be wrong
PA/EC Systems (MongoDB):
Partition ? Choose Availability (with caveats – unreplicated writes go to rollback)
Normal ? Choose Consistency (strong reads/writes in baseline)
Use when: Mixed workloads with mostly consistent needs
PC/EL Systems (PNUTS):
Partition ? Choose Consistency
Normal ? Choose Latency (async replication)
Use when: Read-heavy with timeline consistency acceptable
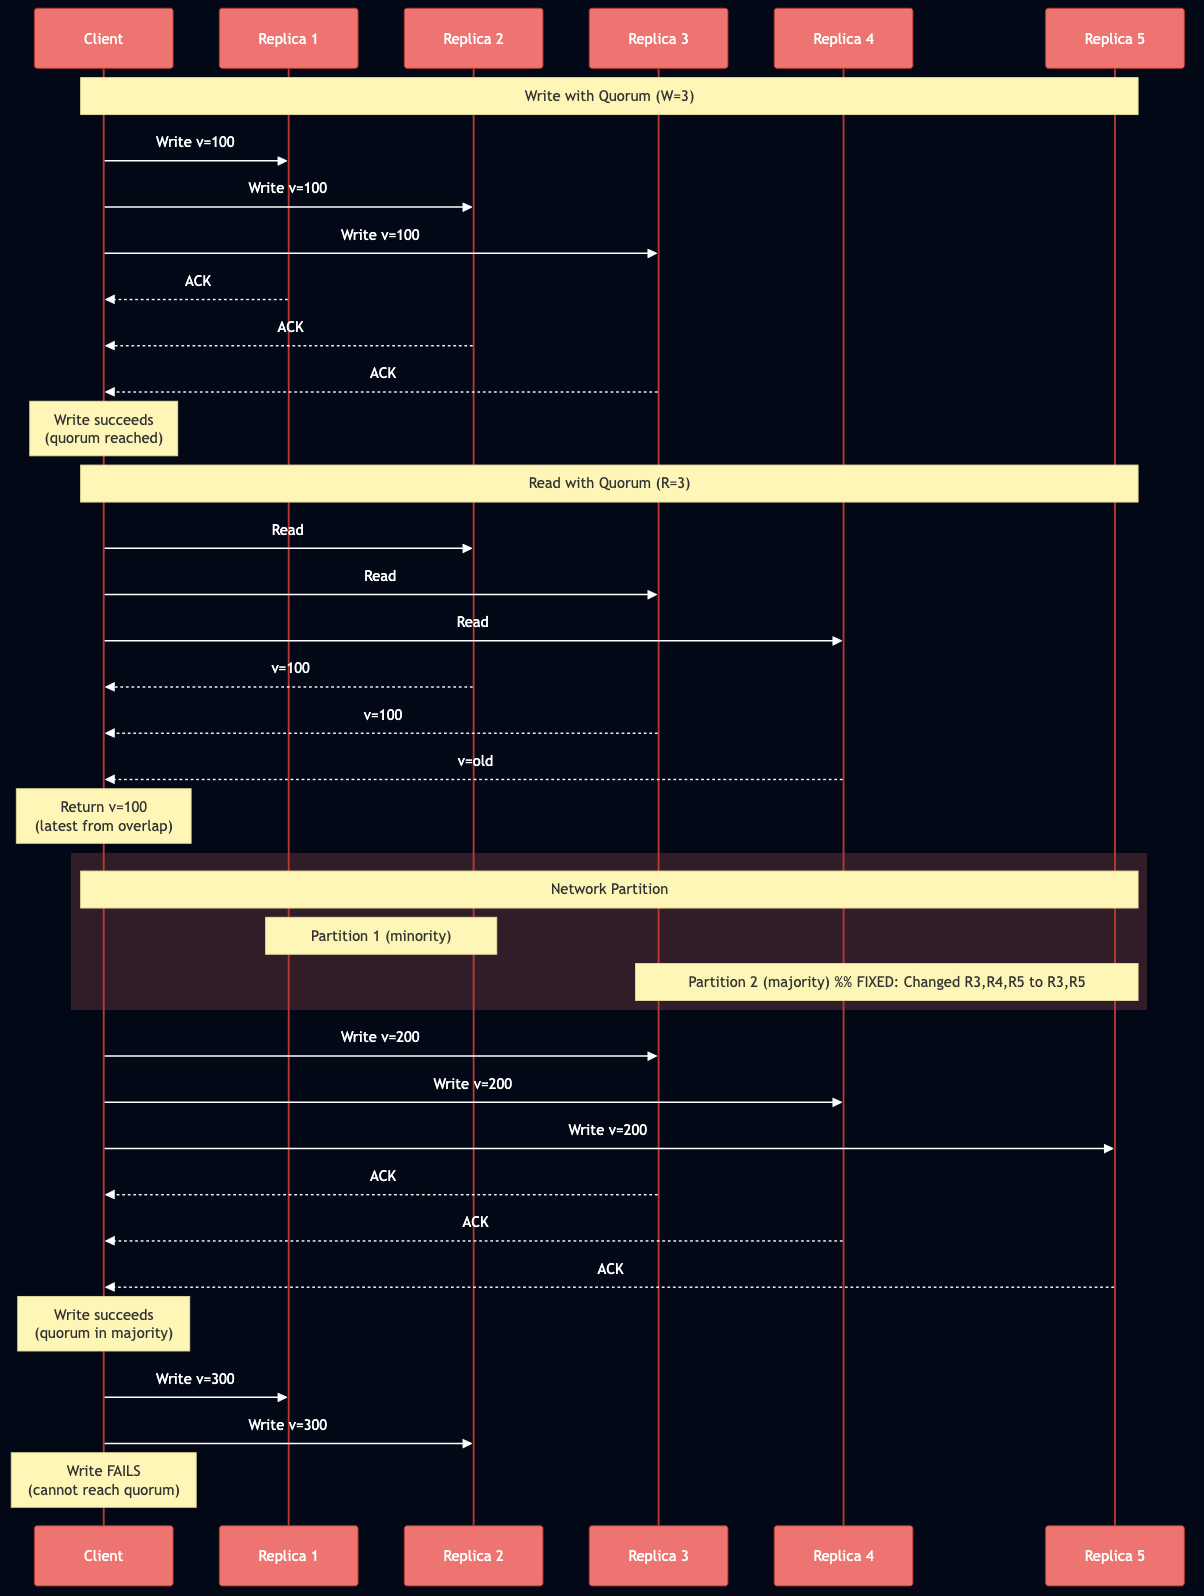
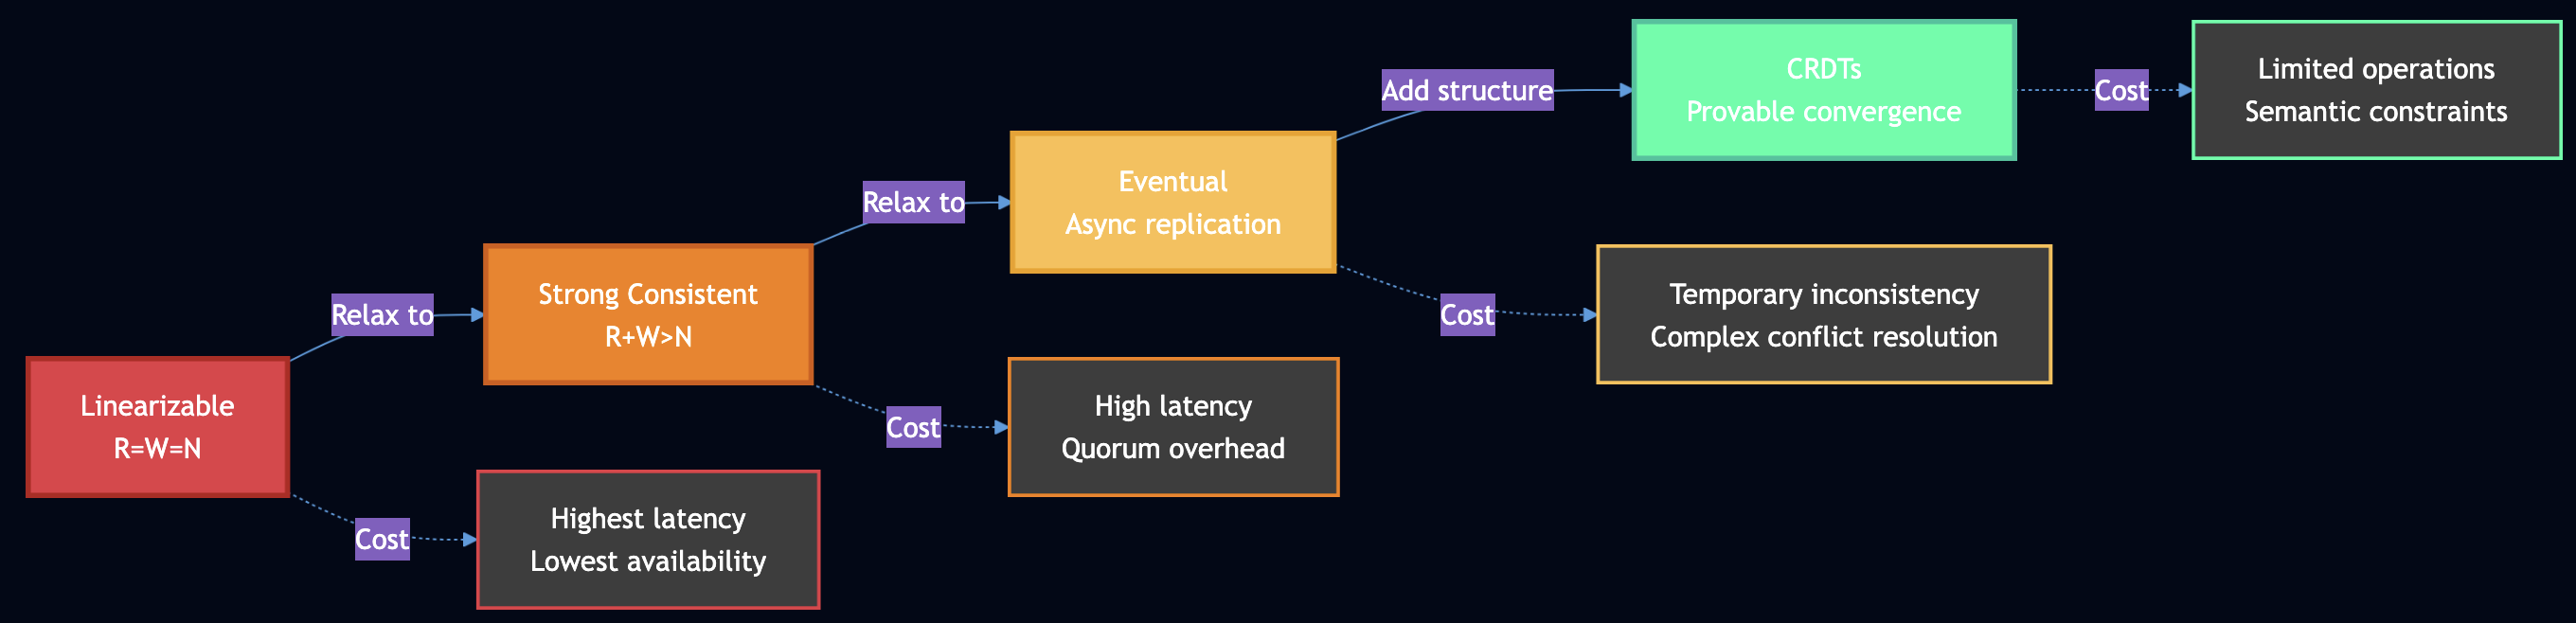
Quorum Consensus: Strong Consistency with Coordination
When R + W > N (read quorum + write quorum > total replicas), the read and write sets must overlap in at least one node. This overlap ensures that any read sees at least one node with the latest write, providing linearizability.
Example with N=5, R=3, W=3:
Write to replicas {1, 2, 3}
Read from replicas {2, 3, 4}
Overlap at {2, 3} guarantees we see the latest value
Critical Nuances:
R + W > N alone is NOT sufficient for linearizability in practice. You need additional mechanisms: readers must perform read repair synchronously before returning results, and writers must read the latest state from a quorum before writing. “Last write wins” based on wall-clock time breaks linearizability due to clock skew. Sloppy quorums like those used in Dynamo are NOT linearizable because the nodes in the quorum can change during failures. Even R = W = N doesn’t guarantee consistency if cluster membership changes. Google Spanner uses atomic clocks and GPS to achieve strong consistency globally, with TrueTime API providing less than 1ms clock uncertainty at the 99th percentile as of 2023.
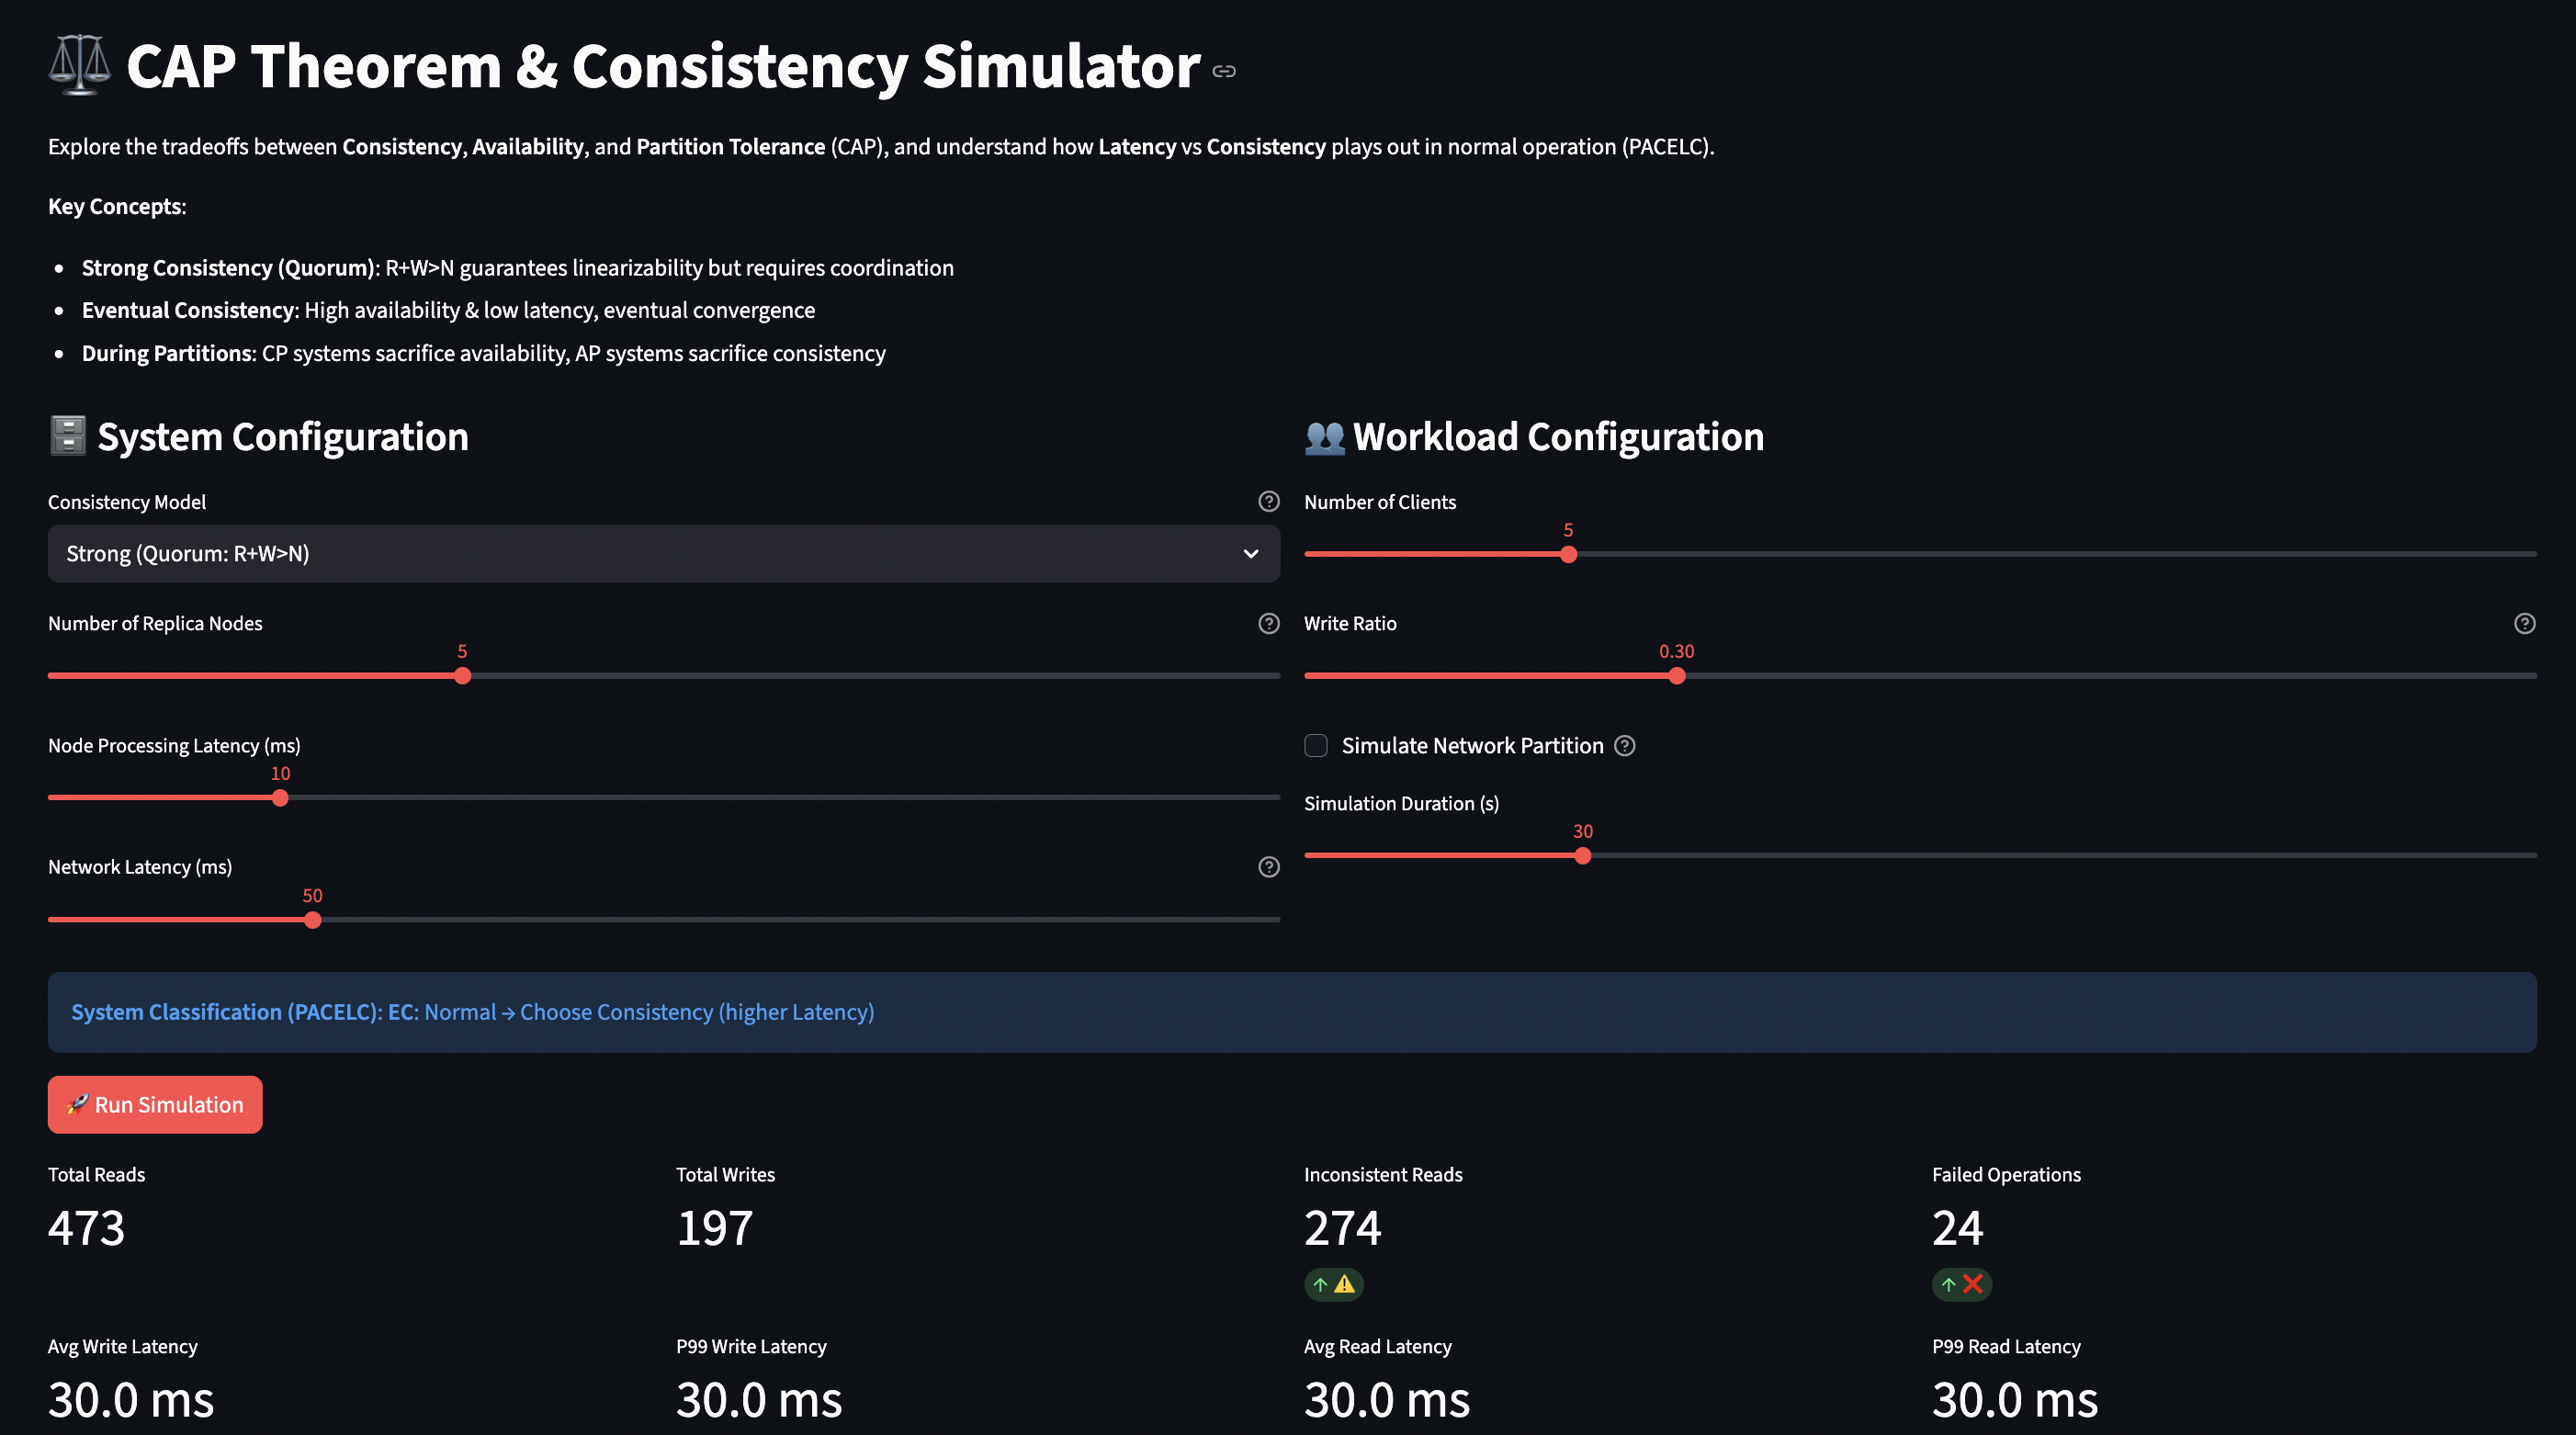
How the Simulator Works
The CAP/PACELC simulator lets you explore these tradeoffs by configuring different consistency models and observing their behavior during normal operation and network partitions.
System Model:
N replica nodes, each with local storage
Configurable schema for data (to test compatibility)
Network latency between nodes (WAN vs LAN)
Optional partition mode (splits cluster)
Consistency Levels:
Strong (R+W>N): Quorum reads and writes, linearizable
Linearizable (R=W=N): All nodes must respond, highest consistency
Weak (R=1, W=1): Single node, eventual consistency
More nodes = more fault tolerance but higher coordination cost
consistency_level
Strong/Eventual/etc
Directly controls latency vs consistency tradeoff
base_latency
Node processing time
Baseline performance
network_latency
Inter-node delay
WAN (50-150ms) vs LAN (1-10ms) dramatically affects quorum cost
partition_active
Network partition
Tests CAP behavior (A vs C during partition)
write_ratio
Read/write mix
Write-heavy shows coordination bottleneck
What You Can Learn:
Latency cost of consistency:
Run with Strong (R=3,W=3) at network_latency=5ms ? ~15ms operations
Same at network_latency=100ms ? ~300ms operations
Switch to Weak (R=1,W=1) ? single-digit milliseconds regardless
CAP during partitions:
Enable partition with Strong consistency ? operations fail (choosing C over A)
Enable partition with Eventual ? stale reads but available (choosing A over C)
Quorum size tradeoffs:
Linearizable (R=W=N) ? single node failure breaks everything
Strong (R=W=3 of N=5) ? can tolerate 2 node failures
Measure failure rate vs consistency guarantees
Geographic distribution:
Network latency 10ms (same datacenter) ? quorum cost moderate
Network latency 150ms (cross-continent) ? quorum cost severe
Observe when you should use eventual consistency for geo-distribution
The simulator tracks write/read latencies, inconsistent reads, failed operations, and success rates, giving you quantitative data on the tradeoffs.
Key Insights from Simulation
The simulator reveals that most architectural decisions are driven by normal operation latency, not partition handling. If you’re building a global system with 150ms cross-region latency, strong consistency means every operation takes 150ms+ for quorum coordination. That’s often unacceptable for user-facing features. This is why hybrid approaches are becoming standard: use strong consistency for critical invariants (financial transactions, inventory), eventual consistency for everything else (user profiles, preferences).
Part 3: CRDTs
CRDTs (Conflict-Free Replicated Data Types) provide strong eventual consistency (SEC) through mathematical guarantees, not probabilistic convergence. They work without coordination, consensus, or concurrency control. CRDTs rely on operations being commutative (order doesn’t matter), merge functions being associative and idempotent (forming a semilattice), and updates being monotonic according to a partial order.
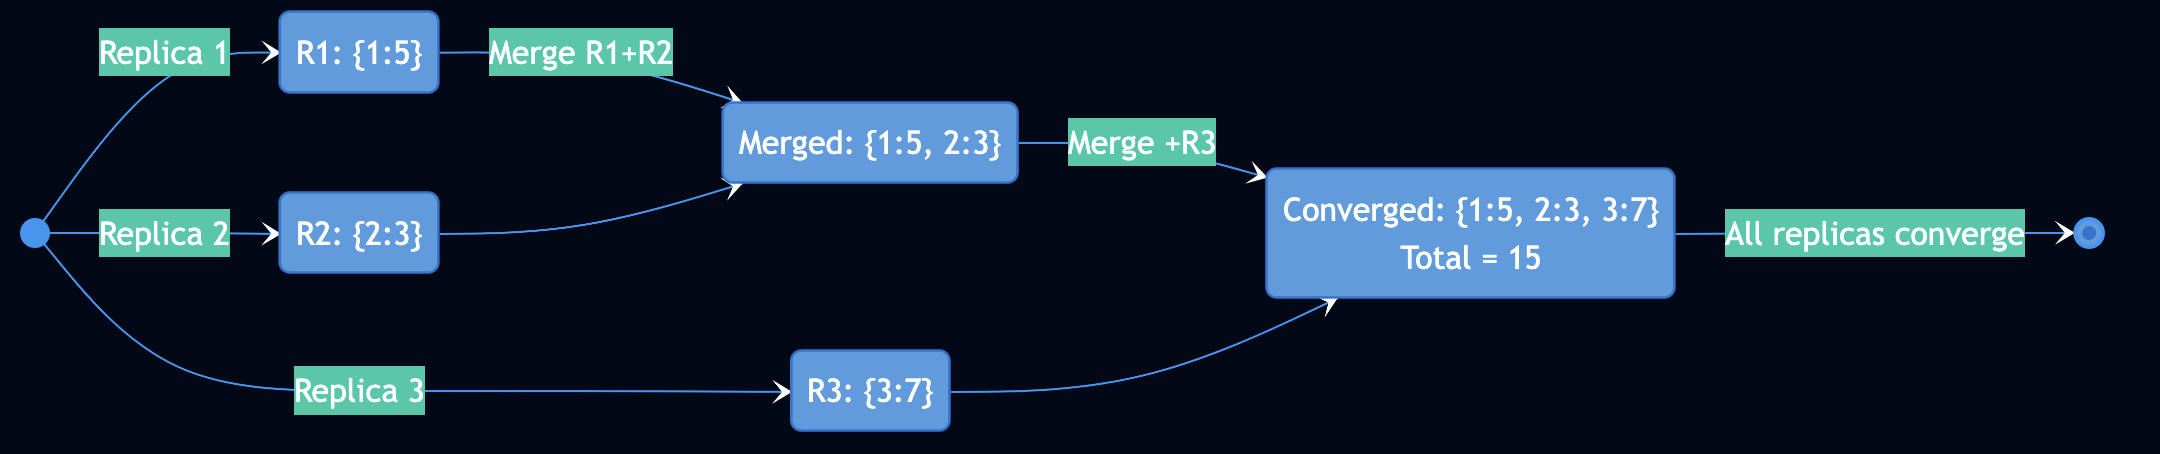
Example: G-Counter (Grow-Only Counter)
class GCounter:
    def __init__(self, replica_id):
        self.counts = {}  # replica_id -> count

    def increment(self, amount=1):
        # Each replica tracks its own increments
        self.counts[self.replica_id] = self.counts.get(self.replica_id, 0) + amount

    def value(self):
        # Total is sum of all replicas
        return sum(self.counts.values())

    def merge(self, other):
        # Take max of each replica's count
        for replica_id, count in other.counts.items():
            self.counts[replica_id] = max(self.counts.get(replica_id, 0), count)
Why this works:
Each replica only increments its own counter (no conflicts)
Merge takes max (idempotent: max(a,a) = a)
Order doesn’t matter: max(max(a,b),c) = max(a,max(b,c))
Eventually all replicas see all increments ? convergence
CRDT Types
There are two main approaches: State-based CRDTs (CvRDTs) send full local state and require merge functions to be commutative, associative, and idempotent. Operation-based CRDTs (CmRDTs) transmit only update operations and require reliable delivery in causal order. Delta-state CRDTs combine the advantages by transmitting compact deltas.
Four CRDTs in the Simulator:
G-Counter: Increment only, perfect for metrics
PN-Counter: Increment and decrement (two G-Counters)
OR-Set: Add/remove elements, concurrent add wins
LWW-Map: Last-write-wins with timestamps
Production systems using CRDTs include Redis Enterprise (CRDBs), Riak, Azure Cosmos DB for distributed data types, and Automerge/Yjs for collaborative editing like Google Docs. SoundCloud uses CRDTs in their audio distribution platform.
Important Limitations
CRDTs only provide eventual consistency, NOT strong consistency or linearizability. Different replicas can see concurrent operations in different orders temporarily. Not all operations are naturally commutative, and CRDTs cannot solve problems requiring atomic coordination like preventing double-booking without additional mechanisms.
The “Shopping Cart Problem”: You can use an OR-Set for shopping cart items, but if two clients concurrently remove the same item, your naive implementation might remove both. The CRDT guarantees convergence to a consistent state, but that state might not match user expectations.
Byzantine fault tolerance is also a concern as traditional CRDTs assume all devices are trustworthy. Malicious devices can create permanent inconsistencies.
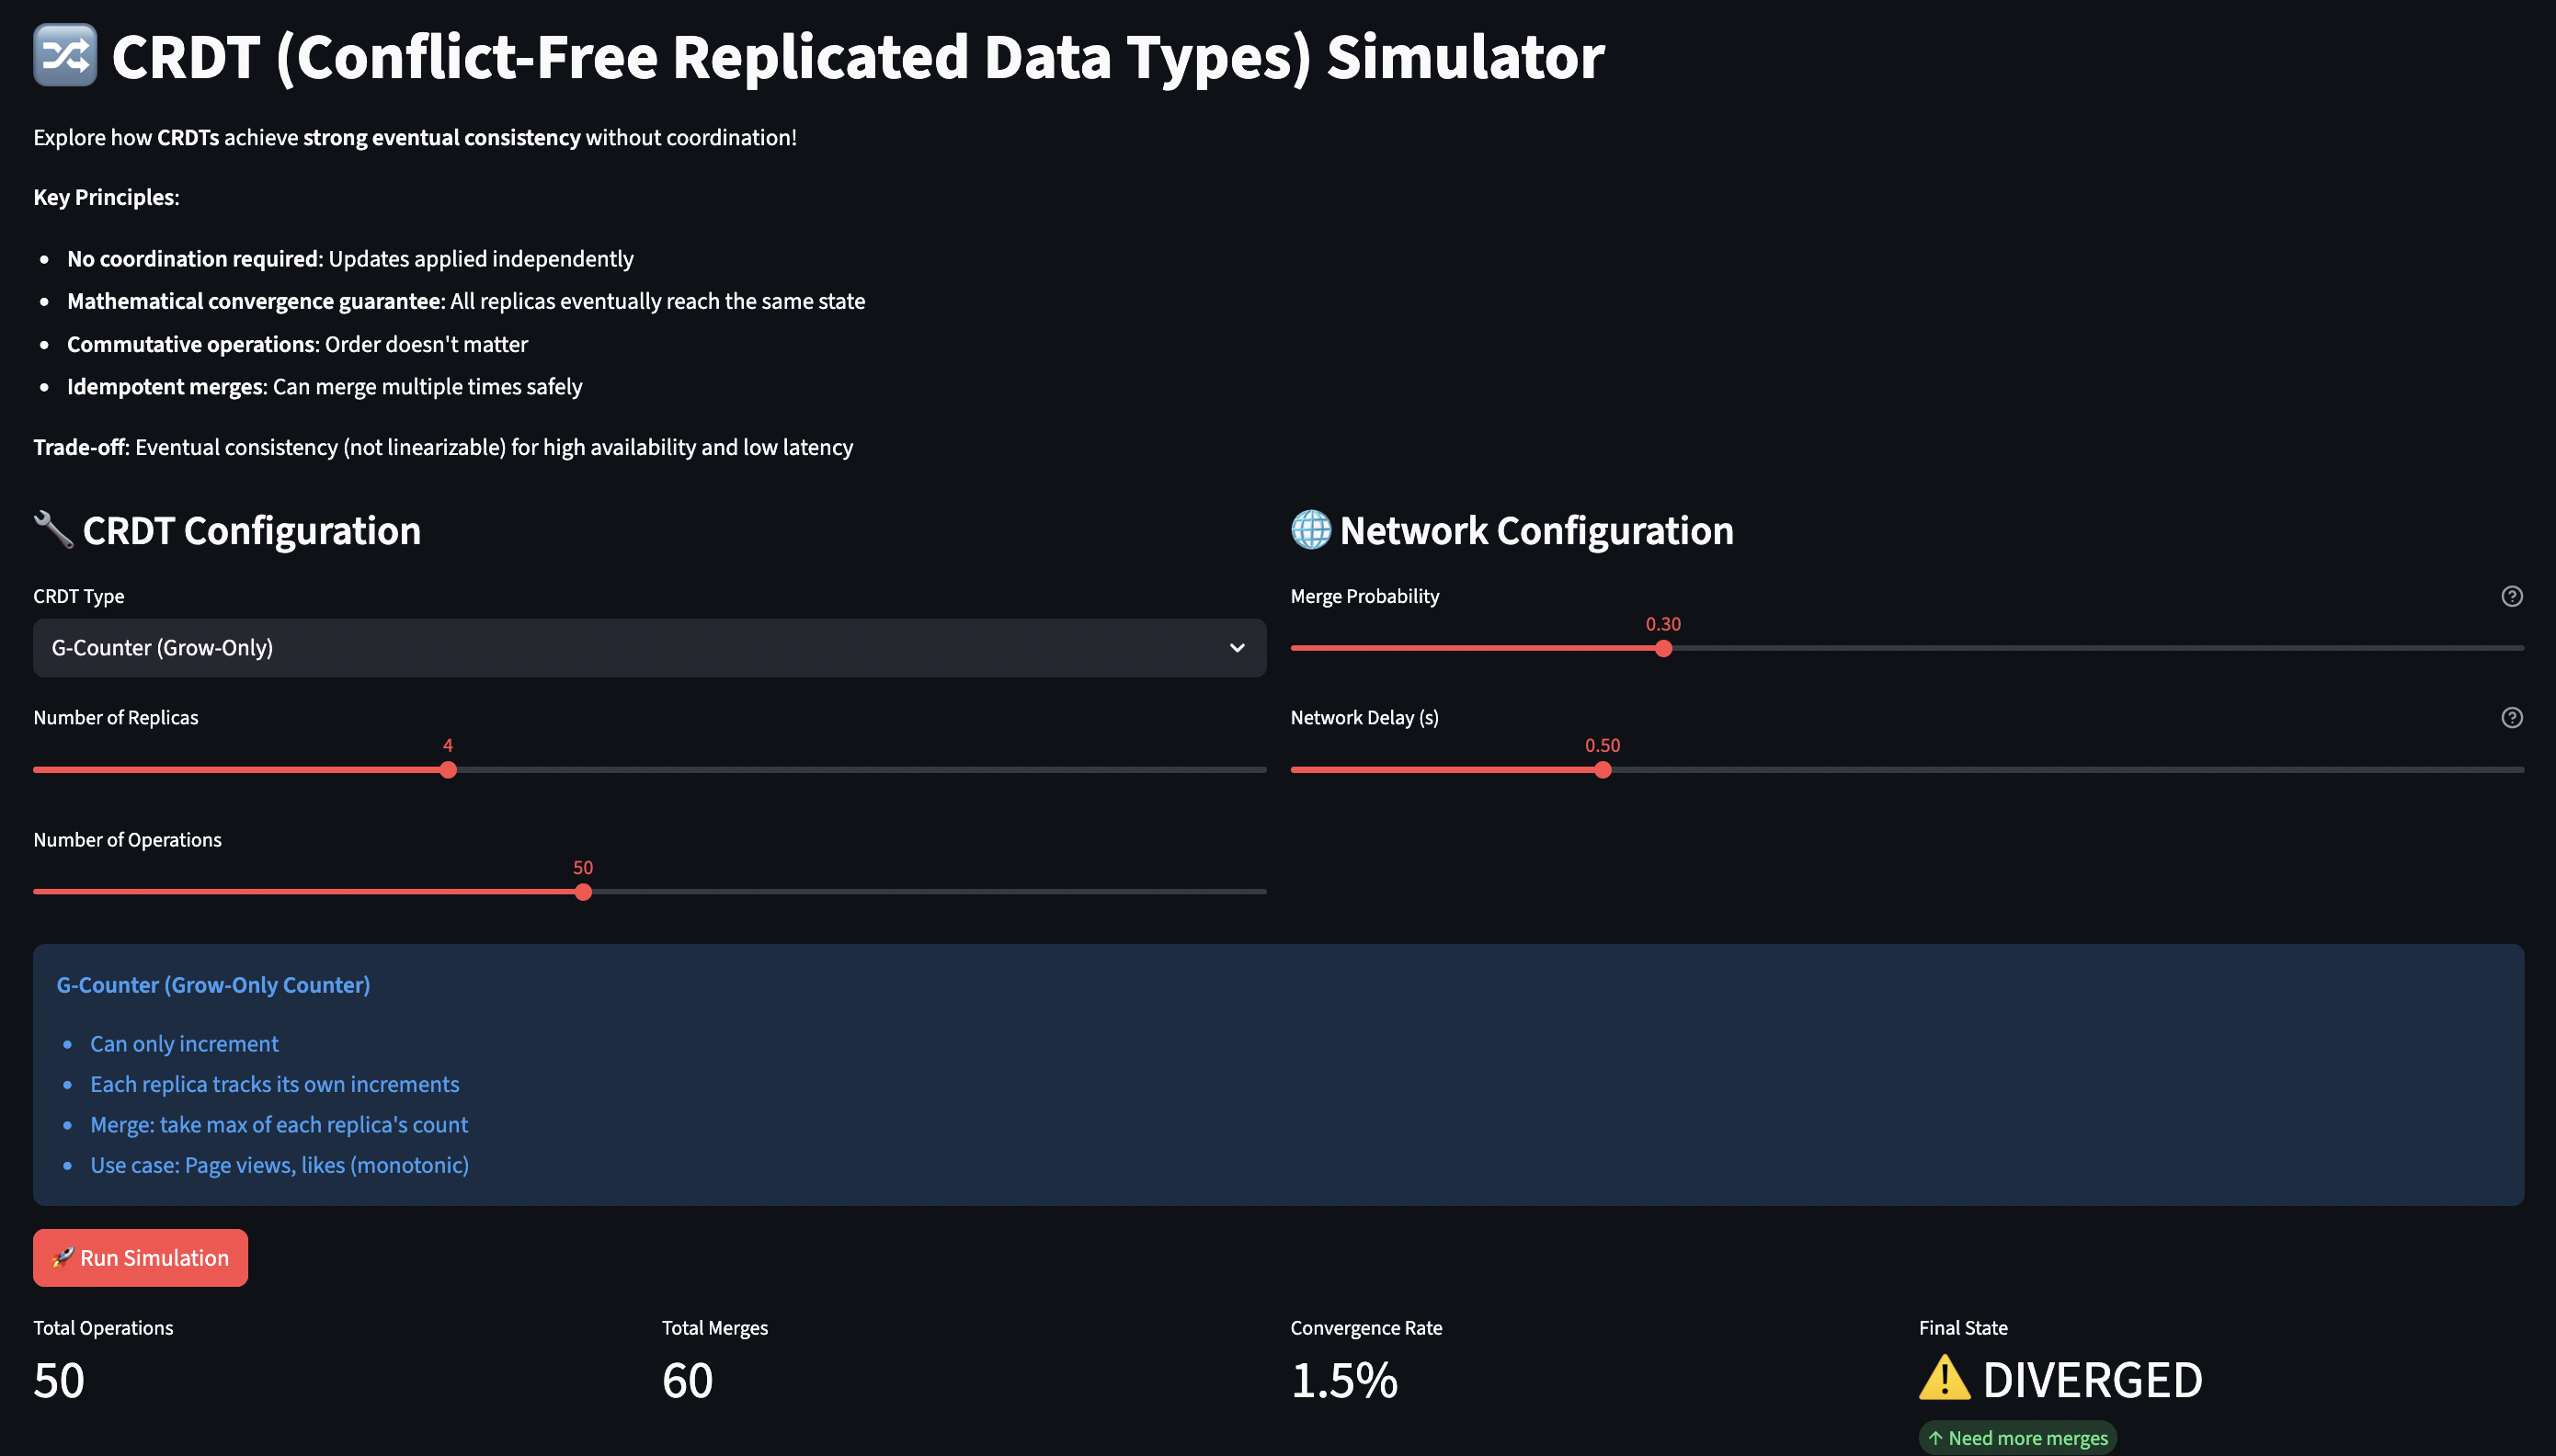
How the Simulator Works
The CRDT simulator demonstrates convergence through gossip-based replication. You can watch replicas diverge and converge as they exchange state.
Simulation Model:
Multiple replica nodes, each with independent CRDT state
Operations applied to random replicas (simulating distributed clients)
Periodic “merges” (gossip protocol) with probability merge_probability
Network delay between merges
Tracks convergence: do all replicas have identical state?
CRDT Implementations: Each CRDT type has its own semantics:
# G-Counter: Each replica has its own count, merge takes max
def merge(self, other):
    for replica_id, count in other.counts.items():
        self.counts[replica_id] = max(self.counts.get(replica_id, 0), count)

# OR-Set: Elements have unique tags, add always beats remove
def add(self, element, unique_tag):
    self.elements[element].add(unique_tag)

def remove(self, element, observed_tags):
    self.elements[element] -= observed_tags  # Only remove what was observed

# LWW-Map: Latest timestamp wins
def set(self, key, value, timestamp):
    current = self.entries.get(key)
    if current is None or timestamp > current[1]:
        self.entries[key] = (value, timestamp, self.replica_id)
Key Parameters:
Parameter
What It Tests
Values
crdt_type
Different convergence semantics
G-Counter, PN-Counter, OR-Set, LWW-Map
n_replicas
Number of nodes
2-8
n_operations
Total updates
10-100
merge_probability
Gossip frequency
0.0-1.0
network_delay
Time for state exchange
0.0-2.0s
What You Can Learn:
Convergence speed:
Set merge_probability=0.1 ? slow convergence, replicas stay diverged
Set merge_probability=0.8 ? fast convergence
Understand gossip frequency vs consistency window tradeoff
OR-Set semantics:
Watch concurrent add/remove ? add wins
See how unique tags prevent unintended deletions
Compare with naive set implementation
LWW-Map data loss:
Two replicas set same key concurrently with different values
One value “wins” based on timestamp (or replica ID tie-break)
Data loss is possible – not suitable for all use cases
Network partition tolerance:
Low merge probability simulates partition
Replicas diverge but operations still succeed (AP in CAP)
After “partition heals” (merges resume), all converge
No coordination needed, no operations failed
The simulator visually shows replica states over time and convergence status, making abstract CRDT theory concrete.
Key Insights from Simulation
CRDTs trade immediate consistency for availability and partition tolerance. The theoretical guarantees are proven: if all replicas receive all updates (eventual delivery), they will converge to the same state (strong convergence).
But the simulator reveals the practical challenges:
Merge semantics don’t always match user intent (LWW can lose data)
Tombstones can grow indefinitely (OR-Set needs garbage collection)
Causal ordering adds complexity (need vector clocks for some CRDTs)
Not suitable for operations requiring coordination (uniqueness constraints, atomic updates)
Research from EuroSys 2023 found that 20% of catastrophic cloud incidents and 37% of failures in major open-source distributed systems are CSI failures – where both systems work correctly in isolation but fail when connected. This is the NASA Mars Climate Orbiter problem: one team used metric units, another used imperial. Both systems worked perfectly. The spacecraft burned up in Mars’s atmosphere because of their interaction.
Why CSI Failures Are Different
Not dependency failures: The downstream system is available, it just can’t process what upstream sends.
Not library bugs: Libraries are single-address-space and well-tested. CSI failures cross system boundaries where testing is expensive.
Not component failures: Each system passes its own test suite. The bug only emerges through interaction.
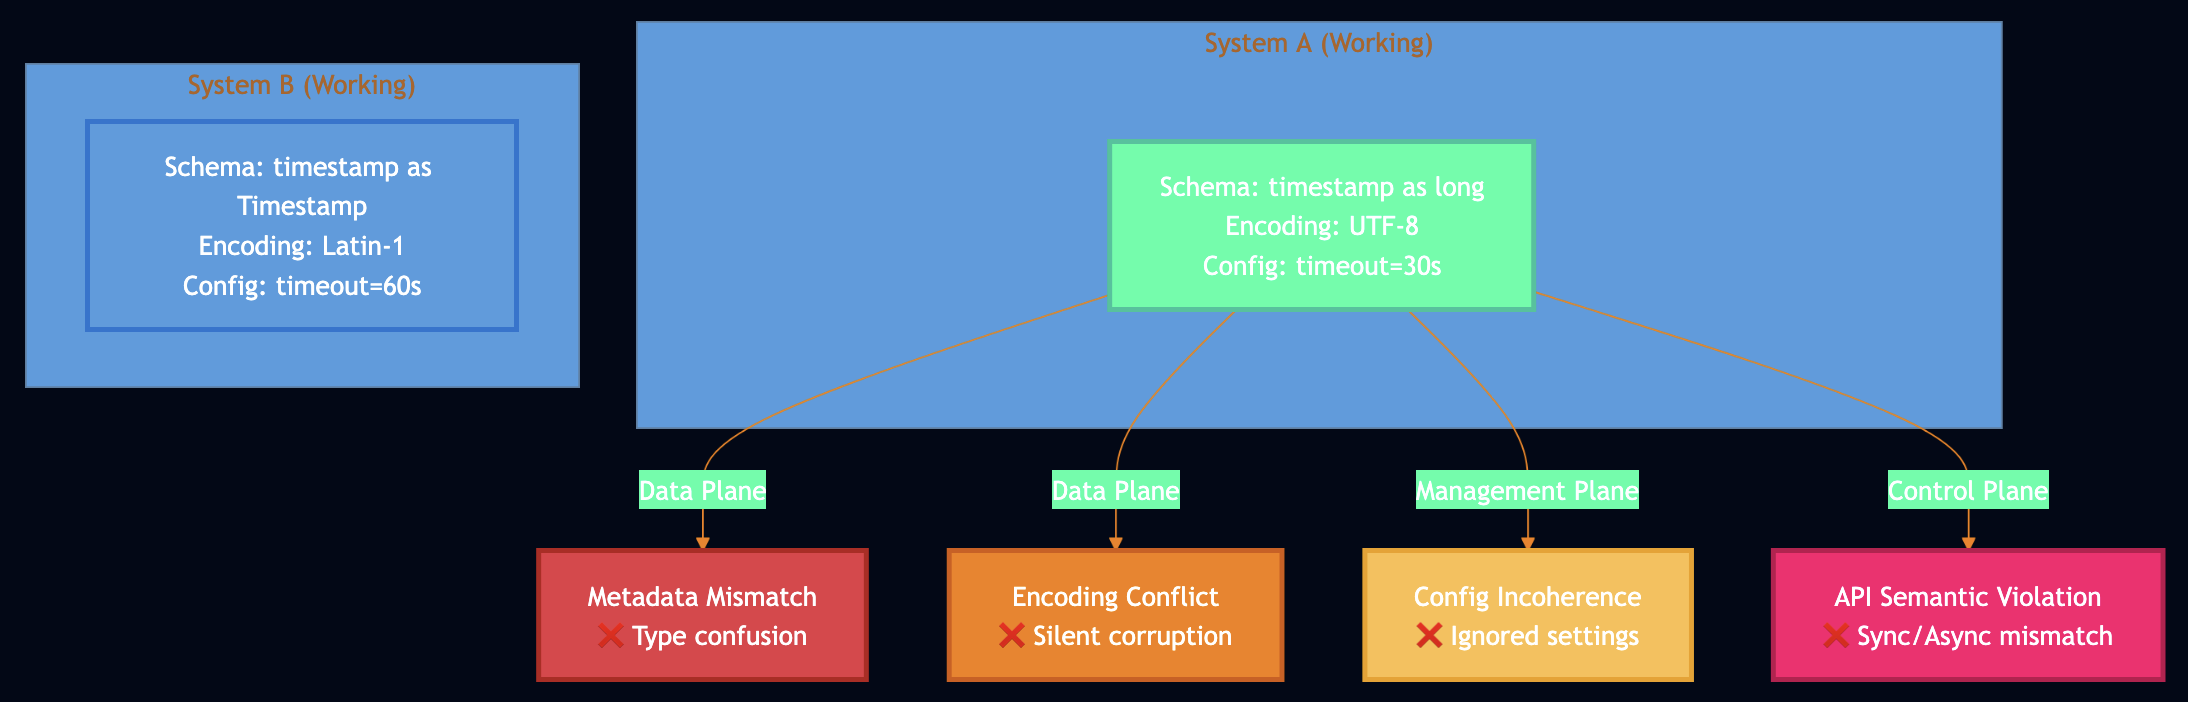
CSI failures manifest across three planes: Data plane (51% – schema/metadata mismatches), Management plane (32% – configuration incoherence), and Control plane (17% – API semantic violations).
For example, study of Apache Spark-Hive integration found 15 distinct discrepancies in simple write-read testing. Hive stored timestamps as long (milliseconds since epoch), Spark expected Timestamp type. Both worked in isolation, failed when integrated. Kafka and Flink encoding mismatch: Kafka set compression.type=lz4, Flink couldn’t decompress due to old LZ4 library. Configuration was silently ignored in Flink, leading to data corruption for 2 weeks before detection.
Why Testing Doesn’t Catch CSI Failures
Analysis of Spark found only 6% of integration tests actually test cross-system interaction. Most “integration tests” test multiple components of the same system. Cross-system testing is expensive and often skipped. The problem compounds with modern architectures:
Microservices: More system boundaries to test
Multi-cloud: Different clouds with different semantics
Serverless: Fine-grained composition increases interaction surface area
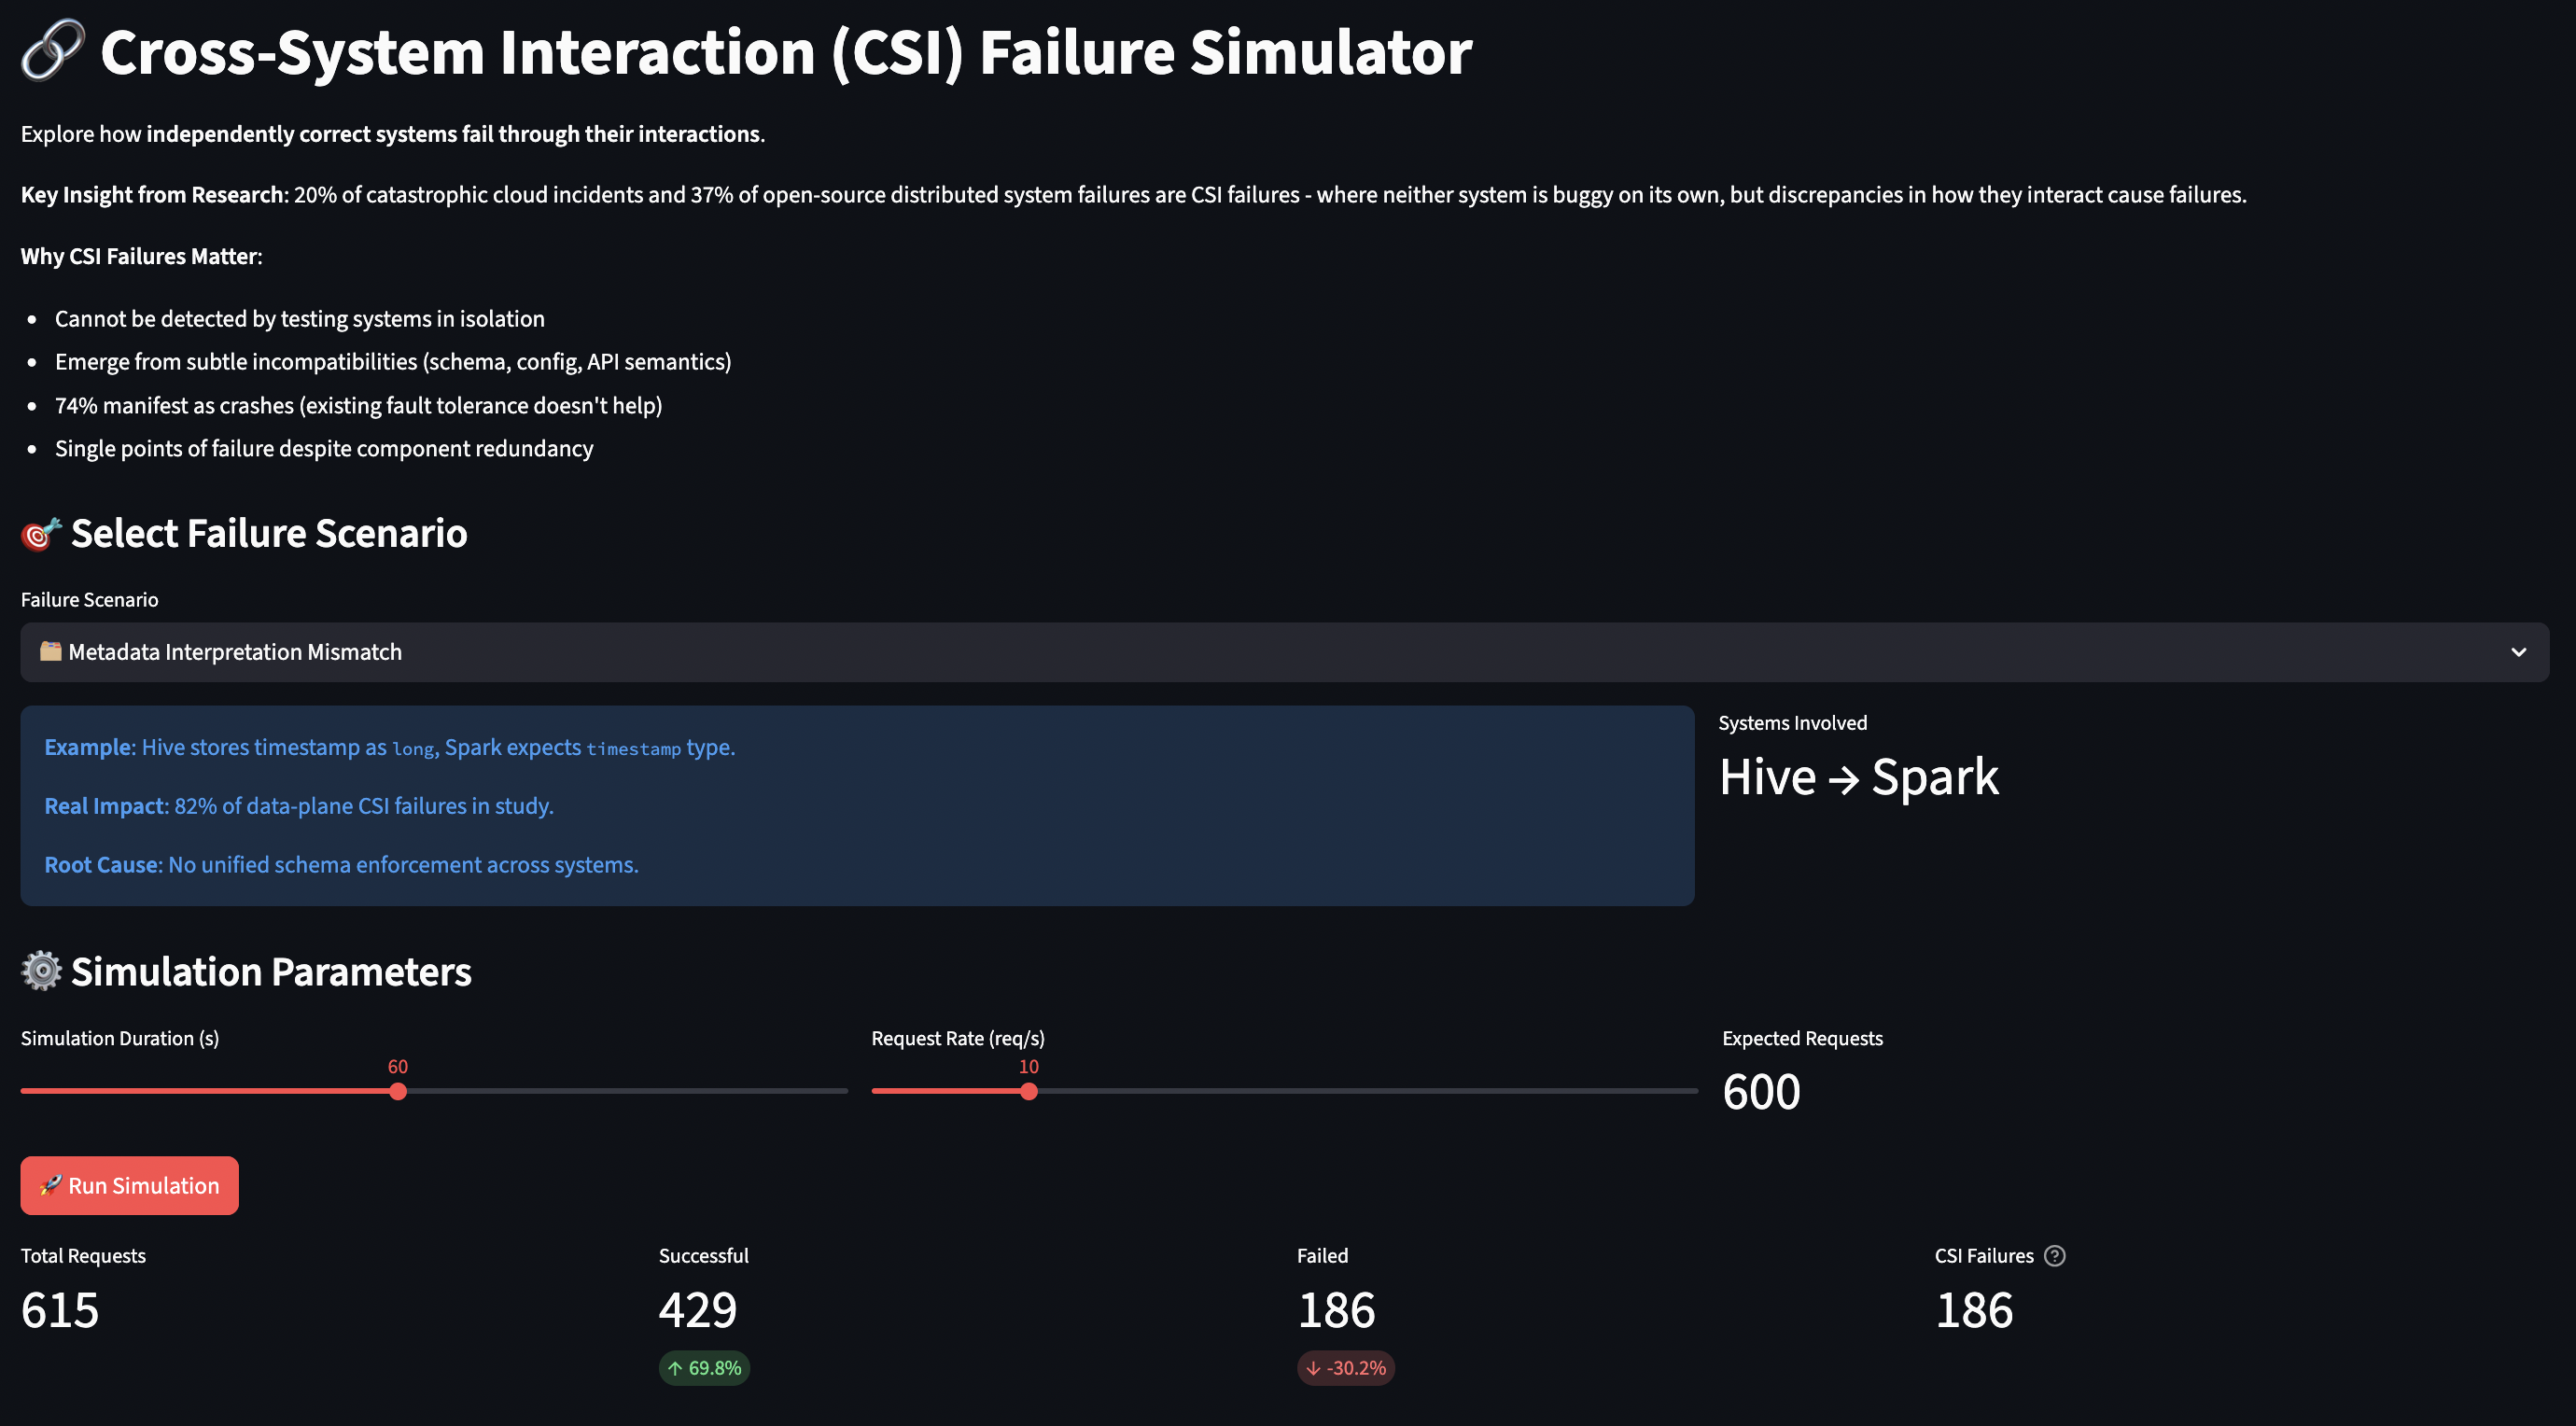
How the Simulator Works
The CSI failure simulator models two systems exchanging data, with configurable discrepancies in schemas, encodings, and configurations.
System Model:
Two systems (upstream ? downstream)
Each has its own schema definition (field types, encoding, nullable fields)
Each has its own configuration (timeouts, retry counts, etc.)
Data flows from System A to System B with potential conversion failures
Failure Scenarios:
Metadata Mismatch (Hive/Spark):
System A: timestamp: long
System B: timestamp: Timestamp
Failure: Type coercion fails ~30% of the time
Schema Conflict (Producer/Consumer):
System A: encoding: latin-1
System B: encoding: utf-8
Failure: Silent data corruption
Configuration Incoherence (ServiceA/ServiceB):
System A: max_retries=3, timeout=30s
System B expects: max_retries=5, timeout=60s
Failure: ~40% of requests fail due to premature timeout
API Semantic Violation (Upstream/Downstream):
Upstream assumes: synchronous, thread-safe
Downstream is: asynchronous, not thread-safe
Failure: Race conditions, out-of-order processing
Type Confusion (SystemA/SystemB):
System A: amount: float
System B: amount: decimal
Failure: Precision loss in financial calculations
Implementation Details:
class DataSchema:
    def __init__(self, schema_id, fields, encoding, nullable_fields):
        self.fields = fields  # field_name -> type
        self.encoding = encoding

    def is_compatible(self, other):
        # Check field types and encoding
        return (self.fields == other.fields and
                self.encoding == other.encoding)

class DataRecord:
    def serialize(self, target_schema):
        # Attempt type coercion
        for field, value in self.data.items():
            expected_type = target_schema.fields[field]
            actual_type = self.schema.fields[field]

            if expected_type != actual_type:
                # 30% failure on type mismatch (simulating real world)
                if random.random() < 0.3:
                    return None  # Serialization failure

        # Check encoding compatibility
        if self.schema.encoding != target_schema.encoding:
            if random.random() < 0.2:  # 20% silent corruption
                return None
Key Parameters:
Parameter
What It Tests
failure_scenario
Type of CSI failure (metadata, schema, config, API, type)
duration
Simulation length
request_rate
Load (requests per second)
The simulator doesn’t have many tunable parameters because CSI failures are about specific incompatibilities, not gradual degradation. Each scenario models a real-world pattern.
What You Can Learn:
Failure rates: CSI failures often manifest in 20-40% of requests (not 100%)
Some requests happen to have compatible data
Makes debugging harder (intermittent failures)
Failure location:
Research shows 69% of CSI fixes go in the upstream system, often in connector modules that are less than 5% of the codebase
Simulator shows which system fails (usually downstream)
Silent vs loud failures:
Type mismatches often crash (loud, easy to detect)
Encoding mismatches corrupt silently (hard to detect)
The simulator demonstrates that cross-system integration testing is essential but often skipped. Unit tests of each system won’t catch these failures.
Prevention strategies validated by simulation:
Write-Read Testing: Write with System A, read with System B, verify integrity
Schema Registry: Single source of truth for data schemas, enforced across systems
Configuration Coherence Checking: Validate that shared configs match
Contract Testing: Explicit, machine-checkable API contracts
Hybrid Consistency Models
Modern systems increasingly use mixed consistency: RedBlue Consistency (2012) marks operations as needing strong consistency (red) or eventual consistency (blue). Replicache (2024) has the server assign final total order while clients do optimistic local updates with rebase. For example: Calendar Application
# Strong consistency for room reservations (prevent double-booking)
def book_conference_room(room_id, time_slot):
    with transaction(consistency='STRONG'):
        if room.is_available(time_slot):
            room.book(time_slot)
            return True
        return False

# CRDTs for collaborative editing (participant lists, notes)
def update_meeting_notes(meeting_id, notes):
    # LWW-Map CRDT, eventual consistency
    meeting.notes.merge(notes)

# Eventual consistency for preferences
def update_user_calendar_color(user_id, color):
    # Who cares if this propagates slowly?
    user_prefs[user_id] = color
Recent theoretical work on the CALM theorem proves that coordination-free consistency is achievable for certain problem classes. Research in 2025 provided mathematical definitions of when coordination is and isn’t required, separating coordination from computation.
What the Simulators Teach Us
Running all four simulators reveals the consistency spectrum:
No “best” consistency model exists:
Quorums are best when you need linearizability and can tolerate latency
CRDTs are best when you need high availability and can tolerate eventual consistency
Neither approach “bypasses” CAP – they make different tradeoffs
Real systems use hybrid models with different consistency for different operations
Practical Lessons
1. Design for Recovery, Not Just Prevention
The metastable failure simulator shows you can’t prevent all failures. Your retry logic, backoff strategy, and circuit breakers are more important than your happy path code. Validated strategies include:
Exponential backoff with jitter (spread retries over time)
Adaptive retry budgets (limit total fleet-wide retries)
Circuit breakers (detect patterns, stop storms)
Load shedding (fail fast rather than queue to death)
2. Understand the Consistency Spectrum
The CAP/PACELC simulator demonstrates that consistency is not binary. You need to understand:
What consistency level do you actually need? (Most operations don’t need linearizability)
What’s the latency cost? (Quorum reads in cross-region deployment can be 100x slower)
What happens during partitions? (Can you sacrifice availability or must you serve stale data?)
Decision framework:
Use strong consistency for: money, inventory, locks, compliance
Use eventual consistency for: feeds, catalogs, analytics, caches
Use hybrid models for: most real-world applications
3. Test Cross-System Interactions
The CSI failure simulator reveals that 86% of fixes go into connector modules that are less than 5% of your codebase. This is where bugs hide. Essential tests include:
Write-read tests (write with System A, read with System B)
Round-trip tests (serialize/deserialize across boundaries)
Version compatibility matrix (test combinations)
Schema validation (machine-checkable contracts)
4. Leverage CRDTs Where Appropriate
The CRDT simulator shows that conflict-free convergence is possible for specific problem types. But you need to:
Understand the semantic limitations (LWW can lose data)
Design merge behavior carefully (does it match user intent?)
git clone https://github.com/bhatti/simulators
cd simulators
pip install -r requirements.txt
Requirements:
Python 3.7+
streamlit (web UI)
simpy (discrete event simulation)
plotly (interactive visualizations)
numpy, pandas (data analysis)
Running Individual Simulators
# Metastable failure simulator
streamlit run metastable_simulator.py

# CAP/PACELC consistency simulator
streamlit run cap_consistency_simulator.py

# CRDT simulator
streamlit run crdt_simulator.py

# CSI failure simulator
streamlit run csi_failure_simulator.py
Running All Simulators
python run_all_simulators.py
Conclusion
Building distributed systems means confronting failure modes that are expensive or impossible to reproduce in real environments:
Metastable failures require specific load patterns and timing
Consistency tradeoffs need multi-region deployments to observe
CRDT convergence requires orchestrating concurrent operations across replicas
CSI failures need exact schema/config mismatches that don’t exist in test environments
Simulators bridge the gap between theoretical understanding and practical intuition:
Cheaper than production testing: No cloud costs, no multi-region setup, instant feedback
Safer than production experiments: Crash the simulator, not your service
More complete than unit tests: See emergent behaviors, not just component correctness
Faster iteration: Tweak parameters, re-run in seconds, build intuition through experimentation
What You Can’t Learn Without Simulation
When does retry amplification tip into metastability? (Depends on coordination slope, timeout, backoff)
How much does quorum coordination actually cost? (Depends on network latency, replica count, workload)
Do your CRDT semantics match user expectations? (Depends on merge behavior, conflict resolution)
Will your schema changes break integration? (Depends on type coercion, encoding, version skew)
The goal isn’t to prevent all failures, that’s impossible. The goal is to understand, anticipate, and recover from the failures that will inevitably occur.
References
Key research papers and resources used in this post:
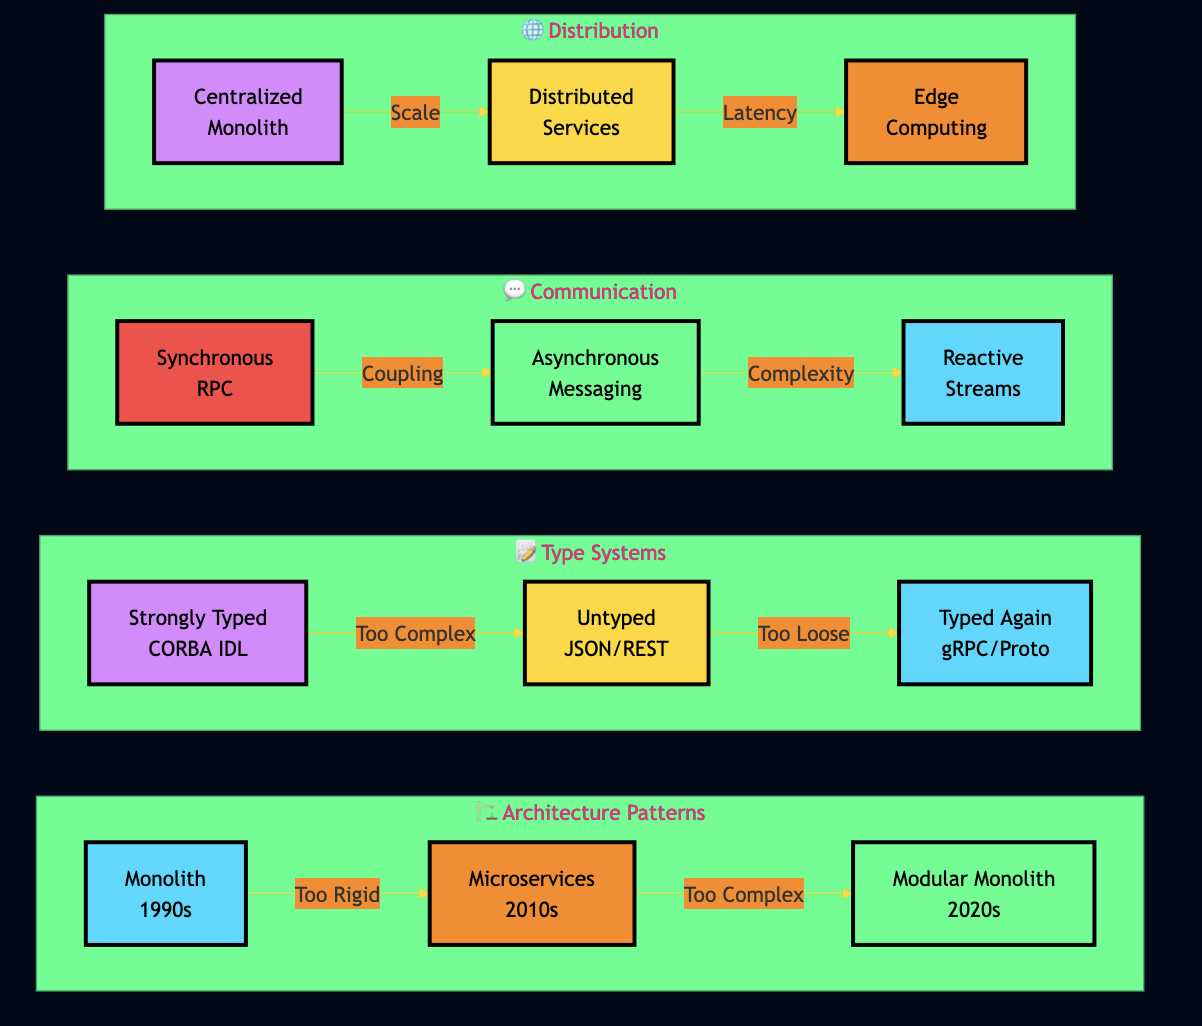
I started writing network code in the early 1990s on IBM mainframes, armed with nothing but Assembly and COBOL. Today, I build distributed AI agents using gRPC, RAG pipelines, and serverless functions. Between these worlds lie decades of technological evolution and an uncomfortable realization: we keep relearning the same lessons. Over the years, I’ve seen simple ideas triumph over complex ones. The technology keeps changing, but the problems stay the same. Network latency hasn’t gotten faster relative to CPU speed. Distributed systems are still hard. Complexity still kills projects. And every new generation has to learn that abstractions leak. I’ll show you the technologies I’ve used, the mistakes I’ve made, and most importantly, what the past teaches us about building better systems in the future.
The Mainframe Era
CICS and 3270 Terminals
I started my career on IBM mainframes running CICS, which was used to build online applications accessed through 3270 “green screen” terminals. It used LU6.2 (Logical Unit 6.2) protocol, part of IBM’s Systems Network Architecture (SNA) to provide peer-to-peer communication. Here’s what a typical CICS application looked like in COBOL:
The CICS environment handled all the complexity—transaction management, terminal I/O, file access, and inter-system communication. For the user interface, I used Basic Mapping Support (BMS), which was notoriously finicky. You had to define screen layouts in a rigid format specifying exactly where each field appeared on the 24×80 character grid:
CUSTMAP  DFHMSD TYPE=&SYSPARM,                                    X
               MODE=INOUT,                                        X
               LANG=COBOL,                                        X
               CTRL=FREEKB
         DFHMDI SIZE=(24,80)
CUSTID   DFHMDF POS=(05,20),                                      X
               LENGTH=08,                                         X
               ATTRB=(UNPROT,NUM),                                X
               INITIAL='________'
CUSTNAME DFHMDF POS=(07,20),                                      X
               LENGTH=30,                                         X
               ATTRB=PROT
This was so painful that I wrote my own tool to convert simple text-based UI templates into BMS format. Looking back, this was my first foray into creating developer tools. Key lesson I learned from the mainframe era was that developer experience mattered. Cumbersome tools slow down development and introduce errors.
Moving to UNIX
Berkeley Sockets
After working on mainframes for a couple of years, I saw the mainframes were already in decline and I then transitioned to C and UNIX systems, which I studied previously in my college. I learned about Berkeley Sockets, which was a lot more powerful and you had complete control over the network. Here’s a simple TCP server in C using Berkeley Sockets:
As you can see, you had to track a lot of housekeeping like socket creation, binding, listening, accepting, reading, writing, and meticulous error handling at every step. Memory management was entirely manual—forget to close() a file descriptor and you’d leak resources. If you make a mistake with recv() buffer sizes and you’d overflow memory. I also experimented with Fast Sockets from UC Berkeley, which used kernel bypass techniques for lower latency and offered better performance.
Key lesson I learned was that low-level control comes at a steep cost. The cognitive load of managing these details makes it nearly impossible to focus on business logic.
Sun RPC and XDR
When working for a physics lab with a large computing facilities consists of Sun workstations, Solaris, and SPARC processors, I discovered Sun RPC (Remote Procedure Call) with XDR (External Data Representation). XDR solved a critical problem: how do you exchange data between machines with different architectures? A SPARC processor uses big-endian byte ordering, while x86 uses little-endian. XDR provided a canonical, architecture-neutral format for representing data. Here’s an XDR definition file (types.x):
/* Define a structure for customer data */
struct customer {
    int customer_id;
    string name<30>;
    float balance;
};

/* Define the RPC program */
program CUSTOMER_PROG {
    version CUSTOMER_VERS {
        int ADD_CUSTOMER(customer) = 1;
        customer GET_CUSTOMER(int) = 2;
    } = 1;
} = 0x20000001;
You’d run rpcgen on this file:
$ rpcgen types.x
This generated the client stub, server stub, and XDR serialization code automatically. Here’s what the server implementation looked like:
This was my first introduction to Interface Definition Languages (IDL) and I found that defining the contract once and generating code automatically reduces errors. This pattern would reappear in CORBA, Protocol Buffers, and gRPC.
Parallel Computing
During my graduate and post-graduate studies in mid 1990s while working full time, I researched into the parallel and distributed computing. I worked with MPI (Message Passing Interface) and IBM’s MPL on SP1/SP2 systems. MPI provided collective operations like broadcast, scatter, gather, and reduce (predecessor to Hadoop like map/reduce). Here’s a simple MPI example that computes the sum of an array in parallel:
#include <mpi.h>
#include <stdio.h>
#include <stdlib.h>

#define ARRAY_SIZE 1000

int main(int argc, char** argv) {
    int rank, size;
    int data[ARRAY_SIZE];
    int local_sum = 0, global_sum = 0;
    int chunk_size, start, end;

    MPI_Init(&argc, &argv);
    MPI_Comm_rank(MPI_COMM_WORLD, &rank);
    MPI_Comm_size(MPI_COMM_WORLD, &size);

    // Initialize data on root
    if (rank == 0) {
        for (int i = 0; i < ARRAY_SIZE; i++) {
            data[i] = i + 1;
        }
    }

    // Broadcast data to all processes
    MPI_Bcast(data, ARRAY_SIZE, MPI_INT, 0, MPI_COMM_WORLD);

    // Each process computes sum of its chunk
    chunk_size = ARRAY_SIZE / size;
    start = rank * chunk_size;
    end = (rank == size - 1) ? ARRAY_SIZE : start + chunk_size;

    for (int i = start; i < end; i++) {
        local_sum += data[i];
    }

    // Reduce all local sums to global sum
    MPI_Reduce(&local_sum, &global_sum, 1, MPI_INT,
               MPI_SUM, 0, MPI_COMM_WORLD);

    if (rank == 0) {
        printf("Global sum: %d\n", global_sum);
    }

    MPI_Finalize();
    return 0;
}
For my post-graduate project, I built JavaNOW (Java on Networks of Workstations), which was inspired by Linda’s tuple spaces and MPI’s collective operations, but implemented in pure Java for portability. The key innovation was our Actor-inspired model. Instead of heavyweight processes communicating through message passing, I used lightweight Java threads with an Entity Space (distributed associative memory) where “actors” could put and get entities asynchronously. Here’s a simple example:
public class SumTask extends ActiveEntity {
    public Object execute(Object arg, JavaNOWAPI api) {
        Integer myId = (Integer) arg;
        EntitySpace workspace = new EntitySpace("RESULTS");

        // Compute partial sum
        int partialSum = 0;
        for (int i = myId * 100; i < (myId + 1) * 100; i++) {
            partialSum += i;
        }

        // Store result in EntitySpace
        return new Integer(partialSum);
    }
}

// Main application
public class ParallelSum extends JavaNOWApplication {
    public void master() {
        EntitySpace workspace = new EntitySpace("RESULTS");

        // Spawn parallel tasks
        for (int i = 0; i < 10; i++) {
            ActiveEntity task = new SumTask(new Integer(i));
            getJavaNOWAPI().eval(workspace, task, new Integer(i));
        }

        // Collect results
        int totalSum = 0;
        for (int i = 0; i < 10; i++) {
            Entity result = getJavaNOWAPI().get(
                workspace, new Entity(new Integer(i)));
            totalSum += ((Integer)result.getEntityValue()).intValue();
        }

        System.out.println("Total sum: " + totalSum);
    }

    public void slave(int id) {
        // Slave nodes wait for work
    }
}
Since then, I have seen the Actor model have gained a wide adoption. For example, today’s serverless functions (AWS Lambda, Azure Functions, Google Cloud Functions) and modern frameworks like Akka, Orleans, and Dapr all embrace Actor-inspired patterns.
Novell and CGI
I also briefly worked with Novell’s IPX (Internetwork Packet Exchange) protocol, which had painful APIs. Here’s a taste of IPX socket programming (simplified):
When the web emerged in early 1990s, I built applications using CGI (Common Gateway Interface) with Perl and C. I deployed these on Apache HTTP Server, which was the first production-quality open source web server and quickly became the dominant web server of the 1990s. Apache used process-driven concurrency where it forked a new process for each request or maintained a pool of pre-forked processes. CGI was conceptually simple: the web server launched a new UNIX process for every request, passing input via stdin and receiving output via stdout. Here’s a simple Perl CGI script:
#!/usr/bin/perl
use strict;
use warnings;
use CGI;

my $cgi = CGI->new;

print $cgi->header('text/html');
print "<html><body>\n";
print "<h1>Hello from CGI!</h1>\n";

my $name = $cgi->param('name') || 'Guest';
print "<p>Welcome, $name!</p>\n";

# Simulate database query
my $user_count = 42;
print "<p>Total users: $user_count</p>\n";

print "</body></html>\n";
Later, I migrated to more performant servers: Tomcat for Java servlets, Jetty as an embedded server, and Netty for building custom high-performance network applications. These servers used asynchronous I/O and lightweight threads (or even non-blocking event loops in Netty‘s case).
Key Lesson I learned was that scalability matters. The CGI model’s inability to maintain persistent connections or share state made it unsuitable for modern web applications. The shift from process-per-request to thread pools and then to async I/O represented fundamental improvements in how we handle concurrency.
Java Adoption
When Java was released in 1995, I adopted it wholeheartedly. It saved developers from manual memory management using malloc() and free() debugging. Network programming became far more approachable:
import java.io.*;
import java.net.*;

public class SimpleServer {
    public static void main(String[] args) throws IOException {
        int port = 8080;

        try (ServerSocket serverSocket = new ServerSocket(port)) {
            System.out.println("Server listening on port " + port);

            while (true) {
                try (Socket clientSocket = serverSocket.accept();
                     BufferedReader in = new BufferedReader(
                         new InputStreamReader(clientSocket.getInputStream()));
                     PrintWriter out = new PrintWriter(
                         clientSocket.getOutputStream(), true)) {

                    String request = in.readLine();
                    System.out.println("Received: " + request);

                    out.println("Message received");
                }
            }
        }
    }
}
Java Threads
I had previously used pthreads in C, which were hard to use but Java’s threading model was far simpler:
public class ConcurrentServer {
    public static void main(String[] args) throws IOException {
        ServerSocket serverSocket = new ServerSocket(8080);

        while (true) {
            Socket clientSocket = serverSocket.accept();

            // Spawn thread to handle client
            new Thread(new ClientHandler(clientSocket)).start();
        }
    }

    static class ClientHandler implements Runnable {
        private Socket socket;

        public ClientHandler(Socket socket) {
            this.socket = socket;
        }

        public void run() {
            try (BufferedReader in = new BufferedReader(
                     new InputStreamReader(socket.getInputStream()));
                 PrintWriter out = new PrintWriter(
                     socket.getOutputStream(), true)) {

                String request = in.readLine();
                // Process request
                out.println("Response");

            } catch (IOException e) {
                e.printStackTrace();
            } finally {
                try { socket.close(); } catch (IOException e) {}
            }
        }
    }
}
public class ThreadSafeCounter {
    private int count = 0;

    public synchronized void increment() {
        count++;
    }

    public synchronized int getCount() {
        return count;
    }
}
This was so much easier than managing mutexes, condition variables, and semaphores in C!
Java RMI: Remote Objects Made
When Java added RMI (1997), distributed objects became practical. You could invoke methods on objects running on remote machines almost as if they were local. Define a remote interface:
import java.rmi.Remote;
import java.rmi.RemoteException;

public interface Calculator extends Remote {
    int add(int a, int b) throws RemoteException;
    int multiply(int a, int b) throws RemoteException;
}
Implement it:
import java.rmi.server.UnicastRemoteObject;
import java.rmi.RemoteException;

public class CalculatorImpl extends UnicastRemoteObject
                            implements Calculator {

    public CalculatorImpl() throws RemoteException {
        super();
    }

    public int add(int a, int b) throws RemoteException {
        return a + b;
    }

    public int multiply(int a, int b) throws RemoteException {
        return a * b;
    }
}
Server:
import java.rmi.Naming;
import java.rmi.registry.LocateRegistry;

public class Server {
    public static void main(String[] args) {
        try {
            LocateRegistry.createRegistry(1099);
            Calculator calc = new CalculatorImpl();
            Naming.rebind("Calculator", calc);
            System.out.println("Server ready");
        } catch (Exception e) {
            e.printStackTrace();
        }
    }
}
Client:
import java.rmi.Naming;

public class Client {
    public static void main(String[] args) {
        try {
            Calculator calc = (Calculator) Naming.lookup(
                "rmi://localhost/Calculator");

            int result = calc.add(5, 3);
            System.out.println("5 + 3 = " + result);

        } catch (Exception e) {
            e.printStackTrace();
        }
    }
}
I found that RMI was constrained and everything had to extend Remote, and you were stuck with Java-to-Java communication. Key lesson I learned was that abstractions that feel natural to developers get adopted.
JINI: RMI with Service Discovery
At a travel booking company in the mid 2000s, I used JINI, which Sun Microsystems pitched as “RMI on steroids.” JINI extended RMI with automatic service discovery, leasing, and distributed events. The core idea: services could join a network, advertise themselves, and be discovered by clients without hardcoded locations. Here’s a JINI service interface and registration:
import net.jini.core.lookup.ServiceRegistrar;
import net.jini.discovery.LookupDiscovery;
import net.jini.lease.LeaseRenewalManager;
import java.rmi.Remote;
import java.rmi.RemoteException;

// Service interface
public interface BookingService extends Remote {
    String searchFlights(String origin, String destination)
        throws RemoteException;
    boolean bookFlight(String flightId, String passenger)
        throws RemoteException;
}

// Service provider
public class BookingServiceProvider implements DiscoveryListener {

    public void discovered(DiscoveryEvent event) {
        ServiceRegistrar[] registrars = event.getRegistrars();

        for (ServiceRegistrar registrar : registrars) {
            try {
                BookingService service = new BookingServiceImpl();
                Entry[] attributes = new Entry[] {
                    new Name("FlightBookingService")
                };

                ServiceItem item = new ServiceItem(null, service, attributes);
                ServiceRegistration reg = registrar.register(
                    item, Lease.FOREVER);

                // Auto-renew lease
                leaseManager.renewUntil(reg.getLease(), Lease.FOREVER, null);

            } catch (Exception e) {
                e.printStackTrace();
            }
        }
    }
}
Client discovery and usage:
public class BookingClient implements DiscoveryListener {

    public void discovered(DiscoveryEvent event) {
        ServiceRegistrar[] registrars = event.getRegistrars();

        for (ServiceRegistrar registrar : registrars) {
            try {
                ServiceTemplate template = new ServiceTemplate(
                    null, new Class[] { BookingService.class }, null);

                ServiceItem item = registrar.lookup(template);

                if (item != null) {
                    BookingService booking = (BookingService) item.service;
                    String flights = booking.searchFlights("SFO", "NYC");
                    booking.bookFlight("FL123", "John Smith");
                }
            } catch (Exception e) {
                e.printStackTrace();
            }
        }
    }
}
Though, JINI provided automatic discovery, leasing and location transparency but it was too complex and only supported Java ecosystem. The ideas were sound and reappeared later in service meshes (Consul, Eureka) and Kubernetes service discovery. I learned that service discovery is essential for dynamic systems, but the implementation must be simple.
CORBA
I used CORBA (Common Object Request Broker Architecture) for many years in 1990s when building intelligent traffic Systems. CORBA promised the language-independent, platform-independent distributed objects. You could write a service in C++, invoke it from Java, and have clients in Python using the same IDL. Here’s a simple CORBA IDL definition:
This generated client stubs and server skeletons for your target language. I built a message-oriented middleware (MOM) system with CORBA that collected traffic data from road sensors and provided real-time traffic information.
C++ server implementation:
#include "TrafficService_impl.h"
#include <iostream>
#include <vector>

class TrafficServiceImpl : public POA_TrafficMonitor::TrafficService {
private:
    std::vector<TrafficMonitor::SensorData> data_store;

public:
    void reportData(const TrafficMonitor::SensorData& data) {
        data_store.push_back(data);
        std::cout << "Received data from sensor "
                  << data.sensor_id << std::endl;
    }

    TrafficMonitor::SensorDataList* getRecentData(CORBA::Long minutes) {
        TrafficMonitor::SensorDataList* result =
            new TrafficMonitor::SensorDataList();

        // Filter data from last N minutes
        time_t cutoff = time(NULL) - (minutes * 60);
        for (const auto& entry : data_store) {
            if (entry.timestamp >= cutoff) {
                result->length(result->length() + 1);
                (*result)[result->length() - 1] = entry;
            }
        }
        return result;
    }

    CORBA::Float getAverageSpeed() {
        if (data_store.empty()) return 0.0;

        float sum = 0.0;
        for (const auto& entry : data_store) {
            sum += entry.speed;
        }
        return sum / data_store.size();
    }
};
Java client:
import org.omg.CORBA.*;
import TrafficMonitor.*;

public class TrafficClient {
    public static void main(String[] args) {
        try {
            // Initialize ORB
            ORB orb = ORB.init(args, null);

            // Get reference to service
            org.omg.CORBA.Object obj =
                orb.string_to_object("corbaname::localhost:1050#TrafficService");
            TrafficService service = TrafficServiceHelper.narrow(obj);

            // Report sensor data
            SensorData data = new SensorData();
            data.sensor_id = 101;
            data.speed = 65.5f;
            data.timestamp = (int)(System.currentTimeMillis() / 1000);

            service.reportData(data);

            // Get average speed
            float avgSpeed = service.getAverageSpeed();
            System.out.println("Average speed: " + avgSpeed + " mph");

        } catch (Exception e) {
            e.printStackTrace();
        }
    }
}
However, CORBA specification was massive and different ORB (Object Request Broker) implementations like Orbix, ORBacus, and TAO couldn’t reliably interoperate despite claiming CORBA compliance. The binary protocol, IIOP, had subtle incompatibilities. CORBA did introduce valuable concepts:
Interceptors for cross-cutting concerns (authentication, logging, monitoring)
IDL-first design that forced clear interface definitions
Language-neutral protocols that actually worked (sometimes)
I learned that standards designed by committee are often over-engineer. CORBA, SOAP tried to solve every problem for everyone and ended up being optimal for no one.
SOAP and WSDL
I used SOAP (Simple Object Access Protocol) and WSDL (Web Services Description Language) on a number of projects in early 2000s that emerged as the standard for web services. The pitch: XML-based, platform-neutral, and “simple.” Here’s a WSDL definition:
You can look at all that XML overhead! A simple request became hundreds of bytes of markup. As SOAP was designed by committee (IBM, Oracle, Microsoft), it tried to solve every possible enterprise problem: transactions, security, reliability, routing, orchestration. I learned that simplicity beats features and SOAP collapsed under its own weight.
Java Servlets and Filters
With Java 1.1, it added support for Servlets that provided a much better model than CGI. Instead of spawning a process per request, servlets were Java classes instantiated once and reused across requests:
You could chain filters for compression, logging, transformation, rate limiting with clean separation of concerns without touching business logic. I previously had experienced with CORBA interceptors for injecting cross-cutting business logic and the filter pattern solved similar cross-cutting concerns problem. This pattern would reappear in service meshes and API gateways.
Enterprise Java Beans
I used Enterprise Java Beans (EJB) in late 1990s and early 2000s that attempted to make distributed objects transparent. Its key idea was that use regular Java objects and let the application server handle all the distribution, persistence, transactions, and security. Here’s what an EJB 2.x entity bean looked like:
// Remote interface
public interface Customer extends EJBObject {
    String getName() throws RemoteException;
    void setName(String name) throws RemoteException;
    double getBalance() throws RemoteException;
    void setBalance(double balance) throws RemoteException;
}

// Home interface
public interface CustomerHome extends EJBHome {
    Customer create(Integer id, String name) throws CreateException, RemoteException;
    Customer findByPrimaryKey(Integer id) throws FinderException, RemoteException;
}

// Bean implementation
public class CustomerBean implements EntityBean {
    private Integer id;
    private String name;
    private double balance;

    public String getName() { return name; }
    public void setName(String name) { this.name = name; }
    public double getBalance() { return balance; }
    public void setBalance(double balance) { this.balance = balance; }

    // Container callbacks
    public void ejbActivate() {}
    public void ejbPassivate() {}
    public void ejbLoad() {}
    public void ejbStore() {}
    public void setEntityContext(EntityContext ctx) {}
    public void unsetEntityContext() {}

    public Integer ejbCreate(Integer id, String name) {
        this.id = id;
        this.name = name;
        this.balance = 0.0;
        return null;
    }

    public void ejbPostCreate(Integer id, String name) {}
}
The N+1 Selects Problem and Network Fallacy
The fatal flaw: EJB pretended network calls were free. I watched teams write code like this:
CustomerHome home = // ... lookup
Customer customer = home.findByPrimaryKey(customerId);

// Each getter is a remote call!
String name = customer.getName();        // Network call
double balance = customer.getBalance();  // Network call
Worse, I saw code that made remote calls in loops:
Collection customers = home.findAll();
double totalBalance = 0.0;
for (Customer customer : customers) {
    // Remote call for EVERY iteration!
    totalBalance += customer.getBalance();
}
This violated the first Fallacy of Distributed Computing: The network is reliable. It’s also not zero latency. What looked like simple property access actually made HTTP calls to a remote server. I had previously built distributed and parallel applications, so I understood network latency. But it blindsided most developers because EJB deliberately hid it.
I learned that you can’t hide distribution. Network calls are fundamentally different from local calls. Latency, failure modes, and semantics are different. Transparency is a lie.
REST Standard
Before REST became mainstream, I experimented with “Plain Old XML” (POX) over HTTP by just sending XML documents via HTTP POST without all the SOAP ceremony:
import requests
import xml.etree.ElementTree as ET

# Create XML request
root = ET.Element('getCustomer')
ET.SubElement(root, 'customerId').text = '12345'
xml_data = ET.tostring(root, encoding='utf-8')

# Send HTTP POST
response = requests.post(
    'http://api.example.com/customer',
    data=xml_data,
    headers={'Content-Type': 'application/xml'}
)

# Parse response
response_tree = ET.fromstring(response.content)
name = response_tree.find('name').text
This was simpler than SOAP, but still ad-hoc. Then REST (Representational State Transfer), based on Roy Fielding’s 2000 dissertation offered a principled approach:
Use HTTP methods semantically (GET, POST, PUT, DELETE)
Resources have URLs
Stateless communication
Hypermedia as the engine of application state (HATEOAS)
Here’s a RESTful API in Python with Flask:
from flask import Flask, jsonify, request

app = Flask(__name__)

# In-memory data store
customers = {
    '12345': {'id': '12345', 'name': 'John Smith', 'balance': 5000.00}
}

@app.route('/customers/<customer_id>', methods=['GET'])
def get_customer(customer_id):
    customer = customers.get(customer_id)
    if customer:
        return jsonify(customer), 200
    return jsonify({'error': 'Customer not found'}), 404

@app.route('/customers', methods=['POST'])
def create_customer():
    data = request.get_json()
    customer_id = data['id']
    customers[customer_id] = data
    return jsonify(data), 201

@app.route('/customers/<customer_id>', methods=['PUT'])
def update_customer(customer_id):
    if customer_id not in customers:
        return jsonify({'error': 'Customer not found'}), 404

    data = request.get_json()
    customers[customer_id].update(data)
    return jsonify(customers[customer_id]), 200

@app.route('/customers/<customer_id>', methods=['DELETE'])
def delete_customer(customer_id):
    if customer_id in customers:
        del customers[customer_id]
        return '', 204
    return jsonify({'error': 'Customer not found'}), 404

if __name__ == '__main__':
    app.run(debug=True)
In practice, most APIs called “REST” weren’t truly RESTful and didn’t implement HATEOAS or use HTTP status codes correctly. But even “REST-ish” APIs were far simpler than SOAP. Key lesson I leared was that REST succeeded because it built on HTTP, something every platform already supported. No new protocols, no complex tooling. Just URLs, HTTP verbs, and JSON.
JSON Replaces XML
With adoption of REST, I saw a decline of XML Web Services (JAX-WS) and I used JAX-RS for REST services that supported JSON payload. XML required verbose markup:
You have to encode references manually, unlike some XML schemas that support IDREF.
Erlang/OTP
I learned about actor model in college and built a framework based on actors and Linda memory model. In the mid-2000s, I encountered Erlang that used actors for building distributed systems. Erlang was designed in the 1980s at Ericsson for building telecom switches and is based on following design:
“Let it crash” philosophy
No shared memory between processes
Lightweight processes (not OS threads—Erlang processes)
If a process crashed, the supervisor automatically restarted it and the system self-healed. A key lesson I learned from actor model and Erlang was that a shared mutable state is the enemy. Message passing with isolated state is simpler, more reliable, and easier to reason about. Today, AWS Lambda, Azure Durable Functions, and frameworks like Akka all embrace the Actor model.
Distributed Erlang
Erlang made distributed computing almost trivial. Processes on different nodes communicated identically to local processes:
% On node1@host1
RemotePid = spawn('node2@host2', module, function, [args]),
RemotePid ! {message, data}.

% On node2@host2 - receives the message
receive
    {message, Data} ->
        io:format("Received: ~p~n", [Data])
end.
The VM handled all the complexity of node discovery, connection management, and message routing. Today’s serverless functions are actors and kubernetes pods are supervised processes.
Asynchronous Messaging
As systems grew more complex, asynchronous messaging became essential. I worked extensively with Oracle Tuxedo, IBM MQSeries, WebLogic JMS, WebSphere MQ, and later ActiveMQ, MQTT / AMQP, ZeroMQ and RabbitMQ primarily for inter-service communication and asynchronous processing. Here’s a JMS producer in Java:
import javax.jms.*;
import javax.naming.*;

public class OrderConsumer implements MessageListener {

    public static void main(String[] args) throws Exception {
        Context ctx = new InitialContext();
        ConnectionFactory factory =
            (ConnectionFactory) ctx.lookup("ConnectionFactory");
        Queue queue = (Queue) ctx.lookup("OrderQueue");

        Connection connection = factory.createConnection();
        Session session = connection.createSession(
            false, Session.AUTO_ACKNOWLEDGE);
        MessageConsumer consumer = session.createConsumer(queue);

        consumer.setMessageListener(new OrderConsumer());
        connection.start();

        System.out.println("Waiting for messages...");
        Thread.sleep(Long.MAX_VALUE);  // Keep running
    }

    public void onMessage(Message message) {
        try {
            TextMessage textMessage = (TextMessage) message;
            System.out.println("Received order: " +
                             textMessage.getText());

            // Process order
            processOrder(textMessage.getText());

        } catch (JMSException e) {
            e.printStackTrace();
        }
    }

    private void processOrder(String orderJson) {
        // Business logic here
    }
}
Asynchronous messaging is essential for building resilient, scalable systems. It decouples producers from consumers, provides natural backpressure, and enables event-driven architectures.
Spring Framework and Aspect-Oriented Programming
In early 2000, I used aspect oriented programming (AOP) to inject cross cutting concerns like logging, security, monitoring, etc. Here is a typical example:
@Aspect
@Component
public class LoggingAspect {

    private static final Logger logger =
        LoggerFactory.getLogger(LoggingAspect.class);

    @Before("execution(* com.example.service.*.*(..))")
    public void logBefore(JoinPoint joinPoint) {
        logger.info("Executing: " +
                   joinPoint.getSignature().getName());
    }

    @AfterReturning(
        pointcut = "execution(* com.example.service.*.*(..))",
        returning = "result")
    public void logAfterReturning(JoinPoint joinPoint, Object result) {
        logger.info("Method " +
                   joinPoint.getSignature().getName() +
                   " returned: " + result);
    }

    @Around("@annotation(com.example.Monitored)")
    public Object measureTime(ProceedingJoinPoint joinPoint)
            throws Throwable {
        long start = System.currentTimeMillis();
        Object result = joinPoint.proceed();
        long time = System.currentTimeMillis() - start;
        logger.info(joinPoint.getSignature().getName() +
                   " took " + time + " ms");
        return result;
    }
}
I later adopted Spring Framework that revolutionized Java development with dependency injection and aspect-oriented programming (AOP):
// Spring configuration
@Configuration
public class AppConfig {

    @Bean
    public CustomerService customerService() {
        return new CustomerServiceImpl(customerRepository());
    }

    @Bean
    public CustomerRepository customerRepository() {
        return new DatabaseCustomerRepository(dataSource());
    }

    @Bean
    public DataSource dataSource() {
        DriverManagerDataSource ds = new DriverManagerDataSource();
        ds.setDriverClassName("com.mysql.jdbc.Driver");
        ds.setUrl("jdbc:mysql://localhost/mydb");
        return ds;
    }
}

// Service class
@Service
public class CustomerServiceImpl implements CustomerService {
    private final CustomerRepository repository;

    @Autowired
    public CustomerServiceImpl(CustomerRepository repository) {
        this.repository = repository;
    }

    @Transactional
    public void updateBalance(String customerId, double newBalance) {
        Customer customer = repository.findById(customerId);
        customer.setBalance(newBalance);
        repository.save(customer);
    }
}
Spring Remoting
Spring added its own remoting protocols. HTTP Invoker serialized Java objects over HTTP:
// Server configuration
@Configuration
public class ServerConfig {

    @Bean
    public HttpInvokerServiceExporter customerService() {
        HttpInvokerServiceExporter exporter =
            new HttpInvokerServiceExporter();
        exporter.setService(customerServiceImpl());
        exporter.setServiceInterface(CustomerService.class);
        return exporter;
    }
}

// Client configuration
@Configuration
public class ClientConfig {

    @Bean
    public HttpInvokerProxyFactoryBean customerService() {
        HttpInvokerProxyFactoryBean proxy =
            new HttpInvokerProxyFactoryBean();
        proxy.setServiceUrl("http://localhost:8080/customer");
        proxy.setServiceInterface(CustomerService.class);
        return proxy;
    }
}
I learned that AOP addressed cross-cutting concerns elegantly for monoliths. But in microservices, these concerns moved to the infrastructure layer like service meshes, API gateways, and sidecars.
Proprietary Protocols
When working for large companies like Amazon, I encountered Amazon Coral, which is a proprietary RPC framework influenced by CORBA. Coral used an IDL to define service interfaces and supported multiple languages:
The IDL compiler generated client and server code for Java, C++, and other languages. Coral handled serialization, versioning, and service discovery. When I later worked for AWS, I used Smithy that was successor Coral, which Amazon open-sourced. Here is a similar example of a Smithy contract:
I learned IDL-first design remains valuable. Smithy learned from CORBA, Protocol Buffers, and Thrift.
Long Polling, WebSockets, and Real-Time
In late 2000s, I built real-time applications for streaming financial charts and technical data. I used long polling where the client made a request that the server held open until data was available:
// Client-side long polling
function pollServer() {
    fetch('/api/events')
        .then(response => response.json())
        .then(data => {
            console.log('Received event:', data);
            updateUI(data);

            // Immediately poll again
            pollServer();
        })
        .catch(error => {
            console.error('Polling error:', error);
            // Retry after delay
            setTimeout(pollServer, 5000);
        });
}

pollServer();
Server-side (Node.js):
const express = require('express');
const app = express();

let pendingRequests = [];

app.get('/api/events', (req, res) => {
    // Hold request open
    pendingRequests.push(res);

    // Timeout after 30 seconds
    setTimeout(() => {
        const index = pendingRequests.indexOf(res);
        if (index !== -1) {
            pendingRequests.splice(index, 1);
            res.json({ type: 'heartbeat' });
        }
    }, 30000);
});

// When an event occurs
function broadcastEvent(event) {
    pendingRequests.forEach(res => {
        res.json(event);
    });
    pendingRequests = [];
}
WebSockets
I also used WebSockets for real time applications that supported true bidirectional communication. However, earlier browsers didn’t fully support them so I used long polling as a fallback when websockets were not supported:
// Server (Node.js with ws library)
const WebSocket = require('ws');
const wss = new WebSocket.Server({ port: 8080 });

wss.on('connection', (ws) => {
    console.log('Client connected');

    // Send initial data
    ws.send(JSON.stringify({
        type: 'INIT',
        data: getInitialData()
    }));

    // Handle messages
    ws.on('message', (message) => {
        const msg = JSON.parse(message);

        if (msg.type === 'SUBSCRIBE') {
            subscribeToSymbol(ws, msg.symbol);
        }
    });

    ws.on('close', () => {
        console.log('Client disconnected');
        unsubscribeAll(ws);
    });
});

// Stream live data
function streamPriceUpdate(symbol, price) {
    wss.clients.forEach((client) => {
        if (client.readyState === WebSocket.OPEN) {
            if (isSubscribed(client, symbol)) {
                client.send(JSON.stringify({
                    type: 'PRICE_UPDATE',
                    symbol: symbol,
                    price: price,
                    timestamp: Date.now()
                }));
            }
        }
    });
}
I learned that different problems need different protocols. REST works for request-response. WebSockets excel for real-time bidirectional communication.
Vert.x and Hazelcast for High-Performance Streaming
For a production streaming chart system handling high-volume market data, I used Vert.x with Hazelcast. Vert.x is a reactive toolkit built on Netty that excels at handling thousands of concurrent connections with minimal resources. Hazelcast provided distributed caching and coordination across multiple Vert.x instances. Market data flowed into Hazelcast distributed topics, Vert.x instances subscribed to these topics and pushed updates to connected WebSocket clients. If WebSocket wasn’t supported, we fell back to long polling automatically.
import io.vertx.core.Vertx;
import io.vertx.core.http.HttpServer;
import io.vertx.core.http.ServerWebSocket;
import com.hazelcast.core.Hazelcast;
import com.hazelcast.core.HazelcastInstance;
import com.hazelcast.core.ITopic;
import com.hazelcast.core.Message;
import com.hazelcast.core.MessageListener;
import java.util.concurrent.ConcurrentHashMap;
import java.util.Set;

public class MarketDataServer {
    private final Vertx vertx;
    private final HazelcastInstance hazelcast;
    private final ConcurrentHashMap<String, Set<ServerWebSocket>> subscriptions;

    public MarketDataServer() {
        this.vertx = Vertx.vertx();
        this.hazelcast = Hazelcast.newHazelcastInstance();
        this.subscriptions = new ConcurrentHashMap<>();

        // Subscribe to market data topic
        ITopic<MarketData> topic = hazelcast.getTopic("market-data");
        topic.addMessageListener(new MessageListener<MarketData>() {
            public void onMessage(Message<MarketData> message) {
                broadcastToSubscribers(message.getMessageObject());
            }
        });
    }

    public void start() {
        HttpServer server = vertx.createHttpServer();

        server.webSocketHandler(ws -> {
            String path = ws.path();

            if (path.startsWith("/stream/")) {
                String symbol = path.substring(8);
                handleWebSocketConnection(ws, symbol);
            } else {
                ws.reject();
            }
        });

        // Long polling fallback
        server.requestHandler(req -> {
            if (req.path().startsWith("/poll/")) {
                String symbol = req.path().substring(6);
                handleLongPolling(req, symbol);
            }
        });

        server.listen(8080, result -> {
            if (result.succeeded()) {
                System.out.println("Market data server started on port 8080");
            }
        });
    }

    private void handleWebSocketConnection(ServerWebSocket ws, String symbol) {
        subscriptions.computeIfAbsent(symbol, k -> ConcurrentHashMap.newKeySet())
                     .add(ws);

        ws.closeHandler(v -> {
            Set<ServerWebSocket> sockets = subscriptions.get(symbol);
            if (sockets != null) {
                sockets.remove(ws);
            }
        });

        // Send initial snapshot from Hazelcast cache
        IMap<String, MarketData> cache = hazelcast.getMap("market-snapshot");
        MarketData data = cache.get(symbol);
        if (data != null) {
            ws.writeTextMessage(data.toJson());
        }
    }

    private void handleLongPolling(HttpServerRequest req, String symbol) {
        String lastEventId = req.getParam("lastEventId");

        // Hold request until data available or timeout
        long timerId = vertx.setTimer(30000, id -> {
            req.response()
               .putHeader("Content-Type", "application/json")
               .end("{\"type\":\"heartbeat\"}");
        });

        // Register one-time listener
        subscriptions.computeIfAbsent(symbol + ":poll",
            k -> ConcurrentHashMap.newKeySet())
            .add(new PollHandler(req, timerId));
    }

    private void broadcastToSubscribers(MarketData data) {
        String symbol = data.getSymbol();

        // WebSocket subscribers
        Set<ServerWebSocket> sockets = subscriptions.get(symbol);
        if (sockets != null) {
            String json = data.toJson();
            sockets.forEach(ws -> {
                if (!ws.isClosed()) {
                    ws.writeTextMessage(json);
                }
            });
        }

        // Update Hazelcast cache for new subscribers
        IMap<String, MarketData> cache = hazelcast.getMap("market-snapshot");
        cache.put(symbol, data);
    }

    public static void main(String[] args) {
        new MarketDataServer().start();
    }
}
Publishing market data to Hazelcast from data feed:
public class MarketDataPublisher {
    private final HazelcastInstance hazelcast;

    public void publishUpdate(String symbol, double price, long volume) {
        MarketData data = new MarketData(symbol, price, volume,
                                         System.currentTimeMillis());

        // Publish to topic - all Vert.x instances receive it
        ITopic<MarketData> topic = hazelcast.getTopic("market-data");
        topic.publish(data);
    }
}
Hazelcast Distribution: Market data shared across multiple Vert.x instances without a central message broker
Horizontal Scaling: Adding Vert.x instances automatically joined the Hazelcast cluster
Low Latency: Sub-millisecond message propagation within the cluster
Automatic Fallback: Clients detected WebSocket support; older browsers used long polling
Facebook Thrift and Google Protocol Buffers
I experimented with Facebook Thrift and Google Protocol Buffers that provided IDL-based RPC with multiple protocols: Here is an example of Protocol Buffers:
Python server with gRPC (which uses Protocol Buffers):
import grpc
from concurrent import futures
import customer_pb2
import customer_pb2_grpc

class CustomerServicer(customer_pb2_grpc.CustomerServiceServicer):

    def GetCustomer(self, request, context):
        return customer_pb2.Customer(
            customer_id=request.customer_id,
            name="John Doe",
            balance=5000.00
        )

    def UpdateBalance(self, request, context):
        print(f"Updating balance for {request.customer_id} " +
              f"to {request.new_balance}")
        return customer_pb2.UpdateBalanceResponse(success=True)

    def ListCustomers(self, request, context):
        customers = [
            customer_pb2.Customer(customer_id=1, name="Alice", balance=1000),
            customer_pb2.Customer(customer_id=2, name="Bob", balance=2000),
        ]
        return customer_pb2.CustomerList(customers=customers)

def serve():
    server = grpc.server(futures.ThreadPoolExecutor(max_workers=10))
    customer_pb2_grpc.add_CustomerServiceServicer_to_server(
        CustomerServicer(), server)
    server.add_insecure_port('[::]:50051')
    server.start()
    print("Server started on port 50051")
    server.wait_for_termination()

if __name__ == '__main__':
    serve()
I learned that binary protocols offer significant efficiency gains. JSON is human-readable and convenient for debugging, but in high-performance scenarios, binary protocols like Protocol Buffers reduce payload size and serialization overhead.
Serverless and Lambda: Functions as a Service
Around 2015, AWS Lambda introduced serverless computing where you wrote functions, and AWS handled all the infrastructure:
Serverless was powerful with no servers to manage, automatic scaling, pay-per-invocation pricing. It felt like the Actor model I’d worked for my research that offered small, stateless, event-driven functions.
However, I also encountered several problems with serverless:
Cold starts: First invocation could be slow (though it has improved with recent updates)
Timeouts: Functions had maximum execution time (15 minutes for Lambda)
State management: Functions were stateless; you needed external state stores
Orchestration: Coordinating multiple functions was complex
The ping-pong anti-pattern emerged where Lambda A calls Lambda B, which calls Lambda C, which calls Lambda D. This created hard-to-debug systems with unpredictable costs. AWS Step Functions and Azure Durable Functions addressed orchestration:
gRPC had one major gotcha in Kubernetes: connection persistence breaks load balancing. I documented this exhaustively in my blog post The Complete Guide to gRPC Load Balancing in Kubernetes and Istio. HTTP/2 multiplexes multiple requests over a single TCP connection. Once that connection is established to one pod, all requests go there. Kubernetes Service load balancing happens at L4 (TCP), so it doesn’t see individual gRPC calls and it only sees one connection. I used Istio’s Envoy sidecar, which operates at L7 and routes each gRPC call independently:
I learned that modern protocols solve old problems but introduce new ones. gRPC is excellent, but you must understand how it interacts with infrastructure. Production systems require deep integration between application protocol and deployment environment.
Modern Messaging and Streaming
I have been using Apache Kafka for many years that transformed how we think about data. It’s not just a message queue instead it’s a distributed commit log:
from kafka import KafkaProducer, KafkaConsumer
import json

# Producer
producer = KafkaProducer(
    bootstrap_servers='localhost:9092',
    value_serializer=lambda v: json.dumps(v).encode('utf-8')
)

order = {
    'order_id': '12345',
    'customer_id': '67890',
    'amount': 99.99,
    'timestamp': time.time()
}

producer.send('orders', value=order)
producer.flush()

# Consumer
consumer = KafkaConsumer(
    'orders',
    bootstrap_servers='localhost:9092',
    auto_offset_reset='earliest',
    value_deserializer=lambda m: json.loads(m.decode('utf-8')),
    group_id='order-processors'
)

for message in consumer:
    order = message.value
    print(f"Processing order: {order['order_id']}")
    # Process order
Kafka’s provided:
Durability: Messages are persisted to disk
Replayability: Consumers can reprocess historical events
Partitioning: Horizontal scalability through partitions
Consumer groups: Multiple consumers can process in parallel
Key Lesson: Event-driven architectures enable loose coupling and temporal decoupling. Systems can be rebuilt from the event log. This is Event Sourcing—a powerful pattern that Kafka makes practical at scale.
Agentic RPC: MCP and Agent-to-Agent Protocol
Over the last year, I have been building Agentic AI applications using Model Context Protocol (MCP) and more recently Agent-to-Agent (A2A) protocol. Both use JSON-RPC 2.0 underneath. After decades of RPC evolution, from Sun RPC to CORBA to gRPC, we’ve come full circle to JSON-RPC for AI agents. I recently built a daily minutes assistant that aggregates information from multiple sources into a morning briefing. After decades of RPC evolution, from Sun RPC to CORBA to gRPC, it has come full circle to JSON-RPC for AI agents.
Service Discovery
A2A immediately reminded me of Sun’s Network Information Service (NIS), originally called Yellow Pages that I used in early 1990s. NIS provided a centralized directory service for Unix systems to look up user accounts, host names, and configuration data across a network. I saw this pattern repeated throughout the decades:
CORBA Naming Service (1990s): Objects registered themselves with a hierarchical naming service, and clients discovered them by name
JINI (late 1990s): Services advertised themselves via multicast, and clients discovered them through lookup registrars (as I described earlier in the JINI section)
UDDI (2000s): Universal Description, Discovery, and Integration for web services—a registry where SOAP services could be published and discovered
Consul, Eureka, etcd (2010s): Modern service discovery for microservices
Kubernetes DNS/Service Discovery (2010s-present): Built-in service registry and DNS-based discovery
Model Context Protocol (MCP)
MCP lets AI agents discover and invoke tools provided by servers. I recently built a daily minutes assistant that aggregates information from multiple sources into a morning briefing. Here’s the MCP server that exposes tools to the AI agent:
from mcp.server import Server
import mcp.types as types
from typing import Any
import asyncio

class DailyMinutesServer:
    def __init__(self):
        self.server = Server("daily-minutes")
        self.setup_handlers()

    def setup_handlers(self):
        @self.server.list_tools()
        async def handle_list_tools() -> list[types.Tool]:
            return [
                types.Tool(
                    name="get_emails",
                    description="Fetch recent emails from inbox",
                    inputSchema={
                        "type": "object",
                        "properties": {
                            "hours": {
                                "type": "number",
                                "description": "Hours to look back"
                            },
                            "limit": {
                                "type": "number",
                                "description": "Max emails to fetch"
                            }
                        }
                    }
                ),
                types.Tool(
                    name="get_hackernews",
                    description="Fetch top Hacker News stories",
                    inputSchema={
                        "type": "object",
                        "properties": {
                            "limit": {
                                "type": "number",
                                "description": "Number of stories"
                            }
                        }
                    }
                ),
                types.Tool(
                    name="get_rss_feeds",
                    description="Fetch latest RSS feed items",
                    inputSchema={
                        "type": "object",
                        "properties": {
                            "feed_urls": {
                                "type": "array",
                                "items": {"type": "string"}
                            }
                        }
                    }
                ),
                types.Tool(
                    name="get_weather",
                    description="Get current weather forecast",
                    inputSchema={
                        "type": "object",
                        "properties": {
                            "location": {"type": "string"}
                        }
                    }
                )
            ]

        @self.server.call_tool()
        async def handle_call_tool(
            name: str,
            arguments: dict[str, Any]
        ) -> list[types.TextContent]:
            if name == "get_emails":
                result = await email_connector.fetch_recent(
                    hours=arguments.get("hours", 24),
                    limit=arguments.get("limit", 10)
                )
            elif name == "get_hackernews":
                result = await hn_connector.fetch_top_stories(
                    limit=arguments.get("limit", 10)
                )
            elif name == "get_rss_feeds":
                result = await rss_connector.fetch_feeds(
                    feed_urls=arguments["feed_urls"]
                )
            elif name == "get_weather":
                result = await weather_connector.get_forecast(
                    location=arguments["location"]
                )
            else:
                raise ValueError(f"Unknown tool: {name}")

            return [types.TextContent(
                type="text",
                text=json.dumps(result, indent=2)
            )]
Each connector is a simple async module. Here’s the Hacker News connector:
import aiohttp
from typing import List, Dict

class HackerNewsConnector:
    BASE_URL = "https://hacker-news.firebaseio.com/v0"

    async def fetch_top_stories(self, limit: int = 10) -> List[Dict]:
        async with aiohttp.ClientSession() as session:
            # Get top story IDs
            async with session.get(f"{self.BASE_URL}/topstories.json") as resp:
                story_ids = await resp.json()

            # Fetch details for top N stories
            stories = []
            for story_id in story_ids[:limit]:
                async with session.get(
                    f"{self.BASE_URL}/item/{story_id}.json"
                ) as resp:
                    story = await resp.json()
                    stories.append({
                        "title": story.get("title"),
                        "url": story.get("url"),
                        "score": story.get("score"),
                        "by": story.get("by"),
                        "time": story.get("time")
                    })

            return stories
RSS and weather connectors follow the same pattern—simple, focused modules that the MCP server orchestrates.
JSON-RPC Under the Hood
MCP is that it’s just JSON-RPC 2.0 over stdio or HTTP. Here’s what a tool call looks like on the wire:
Agent synthesizes everything into a concise morning briefing
The AI decides which tools to call, in what order, based on the user’s preferences. I don’t hardcode the workflow.
Agent-to-Agent Protocol (A2A)
While MCP focuses on tool calling, A2A addresses agent-to-agent discovery and communication. It’s the modern equivalent of NIS/Yellow Pages for agents. Agents register their capabilities in a directory, and other agents discover and invoke them. A2A also uses JSON-RPC 2.0, but adds a discovery layer. Here’s how an agent registers itself:
Though, I appreciate the simplicity of MCP and A2A but here’s what worries me: both protocols largely ignore decades of hard-won lessons about security. The Salesloft breach in 2024 showed exactly what happens: their AI chatbot stored authentication tokens for hundreds of services. MCP and A2A give us standard protocols for tool calling and agent coordination, which is valuable. But they create a false sense of security while ignoring fundamentals we solved decades ago:
Authentication: How do we verify an agent’s identity?
Authorization: What capabilities should this agent have access to?
Credential rotation: How do we handle token expiration and renewal?
Observability: How do we trace agent interactions for debugging and auditing?
Principle of least privilege: How do we ensure agents only access what they need?
Rate limiting: How do we prevent a misbehaving agent from overwhelming services?
The community needs to address this before A2A and MCP see widespread enterprise adoption.
Lessons Learned
1. Complexity is the Enemy
Every failed technology I’ve used failed because of complexity. CORBA, SOAP, EJB—they all collapsed under their own weight. Successful technologies like REST, gRPC, Kafka focused on doing one thing well.
Implication: Be suspicious of solutions that try to solve every problem. Prefer composable, focused tools.
2. Network Calls Are Expensive
The first Fallacy of Distributed Computing haunts us still: The network is not reliable. It’s also not zero latency, infinite bandwidth, or secure. I’ve watched this lesson be relearned in every generation:
EJB entity beans made chatty network calls
Microservices make chatty REST calls
GraphQL makes chatty database queries
Implication: Design APIs to minimize round trips. Batch operations. Cache aggressively. Monitor network latency religiously. (See my blog on fault tolerance in microservices for details.)
3. Statelessness Scales
Stateless services scale horizontally. But real applications need state—session data, shopping carts, user preferences. The solution isn’t to make services stateful instead it’s to externalize state:
Session stores (Redis, Memcached)
Databases (PostgreSQL, DynamoDB)
Event logs (Kafka)
Distributed caches
Implication: Keep service logic stateless. Push state to specialized systems designed for it.
4. The Actor Model Is Underappreciated
My research with actors and Linda memory model convinced me that the Actor model simplifies concurrent and distributed systems. Today’s serverless functions are essentially actors. Frameworks like Akka, Orleans, and Dapr embrace it. Actors eliminate shared mutable shared state, which the source of most concurrency bugs.
Implication: For event-driven systems, consider Actor-based frameworks. They map naturally to distributed problems.
5. Observability
Modern distributed systems require extensive instrumentation. You need:
Structured logging with correlation IDs
Metrics for performance and health
Distributed tracing to follow requests across services
Alarms with proper thresholds
Implication: Instrument your services from day one. Observability is infrastructure, not a nice-to-have. (See my blog posts on fault tolerance and load shedding for specific metrics.)
6. Throttling and Load Shedding
Every production system eventually faces traffic spikes or DDoS attacks. Without throttling and load shedding, your system will collapse. Key techniques:
Rate limiting by client/user/IP
Admission control based on queue depth
Circuit breakers to fail fast
Backpressure to slow down producers
Implication: Build throttling and load shedding into your architecture early. They’re harder to retrofit. (See my comprehensive blog post on this topic.)
7. Idempotency
Network failures mean requests may be retried. If your operations aren’t idempotent, you’ll process payments twice, create duplicate orders, and corrupt data (See my blog on idempotency topic). Make operations idempotent:
Use idempotency keys
Check if operation already succeeded
Design APIs to be safely retryable
Implication: Every non-read operation should be idempotent. It saves you from a world of hurt.
8. External and Internal APIs Should Differ
I have learned that external APIs need a good UX and developer empathy so that APIs are intuitive, consistent, well-documented. Internal APIs can optimize for performance, reliability, and operational needs. Don’t expose your internal architecture to external consumers. Use API gateways to translate between external contracts and internal services.
Implication: Design external APIs for developers using them. Design internal APIs for operational excellence.
9. Standards Beat Proprietary Solutions
Novell IPX failed because it was proprietary. Sun RPC succeeded as an open standard. REST thrived because it built on HTTP. gRPC uses open standards (HTTP/2, Protocol Buffers).
Implication: Prefer open standards. If you must use proprietary tech, understand the exit strategy.
10. Developer Experience Matters
Technologies with great developer experience get adopted. Java succeeded because it was easier than C++. REST beat SOAP because it was simpler. Kubernetes won because it offered a powerful abstraction.
Implication: Invest in developer tools, documentation, and ergonomics. Friction kills momentum.
Upcoming Trends
WebAssembly: The Next Runtime
WebAssembly (Wasm) is emerging as a universal runtime. Code written in Rust, Go, C, or AssemblyScript compiles to Wasm and runs anywhere. Platforms like wasmCloud, Fermyon, and Lunatic are building Actor-based systems on Wasm. Combined with the Component Model and WASI (WebAssembly System Interface), Wasm offers near-native performance, strong sandboxing, and portability. It might replace Docker containers for some workloads. Solomon Hykes, creator of Docker, famously said:
“If WASM+WASI existed in 2008, we wouldn’t have needed to create Docker. That’s how important it is. WebAssembly on the server is the future of computing. A standardized system interface was the missing link. Let’s hope WASI is up to the task!” — Solomon Hykes, March 2019
WebAssembly isn’t ready yet. Critical gaps:
WASI maturity: Still evolving (Preview 2 in development)
Async I/O: Limited compared to native runtimes
Database drivers: Many don’t support WASM
Networking: WASI sockets still experimental
Ecosystem tooling: Debugging, profiling still primitive
Service Meshes
Istio, Linkerd, Dapr move cross-cutting concerns out of application code:
Authentication/authorization
Rate limiting
Circuit breaking
Retries with exponential backoff
Distributed tracing
Metrics collection
Tradeoff: Complexity shifts from application code to infrastructure. Teams need deep Kubernetes and service mesh expertise.
The Edge Is Growing
Edge computing brings computation closer to users. CDNs like Cloudflare Workers and Fastly Compute@Edge run code globally with single-digit millisecond latency. This requires new thinking like eventual consistency, CRDTs (Conflict-free Replicated Data Types), and geo-distributed state management.
AI Agents and Multi-Agent Systems
I’m currently building agentic AI systems using LangGraph, RAG, and MCP. These are inherently distributed and agents communicate asynchronously, maintain local state, and coordinate through message passing. It’s the Actor model again.
What’s Missing
Despite all this progress, we still struggle with:
Distributed transactions: Two-phase commit doesn’t scale; SAGA patterns are complex
Testing distributed systems: Mocking services, simulating failures, and reproducing production bugs remain hard. I have written a number of tools for mock testing.
Observability at scale: Tracing millions of requests generates too much data
Cost management: Cloud bills spiral as systems grow
Cognitive load: Modern systems require expertise in dozens of technologies
Conclusion
I’ve been writing network code for decades and have used dozens of protocols, frameworks, and paradigms. Here is what I have learned:
Design for Failure from Day One (Systems built with circuit breakers, retries, timeouts, and graceful degradation from the start).
Other tips from evolution of remote services include:
Design systems as message-passing actors from the start. Whether that’s Erlang processes, Akka actors, Orleans grains, or Lambda functions—embrace isolated state and message passing.
Invest in Observability with structured logging with correlation IDs, instrumented metrics, distributed tracing and alarms.
Separate External and Internal APIs. Use REST or GraphQL for external APIs (with versioning) and use gRPC or Thrift for internal communication (efficient).
Build Throttling and Load Shedding by rate limiting by client/user/IP at the edge and implement admission control at the service level (See my blog on Effective Load Shedding and Throttling).
Make Everything Idempotent as networks fail and requests get retried. Use idempotency keys for all mutations.
Choose Boring Technology (See Choose Boring Technology). For your core infrastructure, use proven tech (PostgreSQL, Redis, Kafka).
Test for Failure. Most code only handles the happy path. Production is all about unhappy paths.
Make chaos engineering part of CI/CD and use property-based testing (See my blog on property-based testing).
The technologies change like mainframes to serverless, Assembly to Go, CICS to Kubernetes. But the underlying principles remain constant. We oscillate between extremes:
Each swing teaches us something. CORBA was too complex, but IDL-first design is valuable. REST was liberating, but binary protocols are more efficient. Microservices enable agility, but operational complexity explodes. The sweet spot is usually in the middle. Modular monoliths with clear boundaries. REST for external APIs, gRPC for internal communication. Some synchronous calls, some async messaging.
Here are a few trends that I see becoming prevalent:
WebAssembly may replace containers for some workloads: Faster startup, better security with platforms like wasmCloud and Fermyon.
Service meshes are becoming invisible: Currently they are too complex. Ambient mesh (no sidecars) and eBPF-based routing are gaining wider adoption.
The Actor model will eat the world: Serverless functions are actors and durable functions are actor orchestration.
Edge computing will force new patterns: We can’t rely on centralized state and may need CRDTs and eventual consistency.
AI agents will need distributed coordination. Multi-agent systems = distributed systems and may need message passing between agents.
The best engineers don’t just learn the latest framework, they study the history, understand the trade-offs, and recognize when old ideas solve new problems. The future of distributed systems won’t be built by inventing entirely new paradigms instead it’ll be built by taking the best ideas from the past, learning from the failures, and applying them with better tools.
TL;DR: Tested open-source LLM serving (vLLM) on GCP L4 GPUs. Achieved 93% cost savings vs OpenAI GPT-4, 100% routing accuracy, and 91% cache hit rates. Prototype proves feasibility; production requires 5-7 months additional work (security, HA, ops). All code at github.com/bhatti/vllm-tutorial.
Background
Last year, our CEO mandated “AI adoption” across the organization and everyone had access to LLMs through an internal portal that used Vertex AI. However, there was a little training or best practices. I saw engineers using the most expensive models for simple queries, no cost tracking, zero observability into what was being used, and no policies around data handling. People tried AI, built some demos and got mixed results.
This mirrors what’s happening across the industry. Recent research shows 95% of AI pilots fail at large companies, and McKinsey found 42% of companies abandoned generative AI projects citing “no significant bottom line impact.” The 5% that succeed do something fundamentally different: they treat AI as infrastructure requiring proper tooling, not just API access.
This experience drove me to explore better approaches. I built prototypes using vLLM and open-source tools, tested them on GCP L4 GPUs, and documented what actually works. This blog shares those findings with real code, benchmarks, and lessons from building production-ready AI infrastructure. Every benchmark ran on actual hardware (GCP L4 GPUs), every pattern emerged from solving real problems, and all code is available at github.com/bhatti/vllm-tutorial.
Why Hosted LLM Access Isn’t Enough
Even with managed services like Vertex AI or Bedrock, enterprise AI needs additional layers that most organizations overlook:
Cost Management
No intelligent routing between models (GPT-4 for simple definitions that Phi-2 could handle)
No per-user, per-team budgets or limits
No cost attribution or chargeback
Result: Unpredictable expenses, no accountability
Observability
Can’t track which prompts users send
Can’t identify failing queries or quality degradation
Can’t measure actual usage patterns
Result: Flying blind when issues occur
Security & Governance
Data flows through third-party infrastructure
No granular access controls beyond API keys
Limited audit trails for compliance
Result: Compliance gaps, security risks
Performance Control
Can’t deploy custom fine-tuned models
No A/B testing between models
Limited control over routing logic
Result: Vendor lock-in, inflexibility
The Solution: vLLM with Production Patterns
After evaluating options, I built prototypes using vLLM—a high-performance inference engine for running open-source LLMs (Llama, Mistral, Phi) on your infrastructure. Think of vLLM as NGINX for LLMs: battle-tested, optimized runtime that makes production deployments feasible.
Production error handling (retries, circuit breakers, fallbacks)
System Architecture
Here’s the complete system architecture I’ve built and tested:
Production AI requires three monitoring layers:
Layer 1: Infrastructure (Prometheus + Grafana)
GPU utilization, memory usage
Request rate, error rate, latency (P50, P95, P99)
Integration via /metrics endpoint that vLLM exposes
Grafana dashboards visualize trends and trigger alerts
Layer 2: Application Metrics
Time to First Token (TTFT), tokens per second
Cost per request, model distribution
Budget tracking (daily, monthly limits)
Custom Prometheus metrics embedded in application code
Layer 3: LLM Observability (Langfuse)
Full prompt/response history for debugging
Cost attribution per user/team
Quality tracking over time
Essential for understanding what users actually do
Here’s what I’ve built and tested:
Setting Up Your Environment: GCP L4 GPU Setup
Before we dive into the concepts, let’s get your environment ready. I’m using GCP L4 GPUs because they offer the best price/performance for this workload ($0.45/hour), but the code works on any CUDA-capable GPU.
# Test vLLM installation
python -c "import vllm; print(f'vLLM version: {vllm.__version__}')"

# Quick functionality test
python examples/01_basic_vllm.py
Expected output:
Loading model microsoft/phi-2...
Model loaded in 8.3 seconds

Generating response...
Generated 50 tokens in 987ms
Throughput: 41.5 tokens/sec

? vLLM is working!
Quick Start
Before we dive deep, let’s get something running:
Clone the repo:
   git clone https://github.com/bhatti/vllm-tutorial.git
   cd vllm-tutorial
If you have a GPU available:
   # Follow setup instructions in README
   python examples/01_basic_vllm.py
No GPU? Run the benchmarks locally:
   # See the actual results from GCP L4 testing
   cat benchmarks/results/01_throughput_results.json
from typing import Callable
from dataclasses import dataclass
import time

@dataclass
class RetryConfig:
    """Retry configuration"""
    max_retries: int = 3
    initial_delay: float = 1.0
    max_delay: float = 60.0
    exponential_base: float = 2.0

def retry_with_backoff(config: RetryConfig = RetryConfig()):
    """
    Decorator: Retry with exponential backoff

    Example:
        @retry_with_backoff()
        def generate_text(prompt):
            return llm.generate(prompt)
    """
    def decorator(func: Callable) -> Callable:
        def wrapper(*args, **kwargs):
            delay = config.initial_delay

            for attempt in range(config.max_retries):
                try:
                    return func(*args, **kwargs)

                except Exception as e:
                    if attempt == config.max_retries - 1:
                        raise  # Last attempt, re-raise

                    error_type = classify_error(e)

                    # Don't retry on invalid input
                    if error_type == ErrorType.INVALID_INPUT:
                        raise

                    print(f"??  Attempt {attempt + 1} failed: {error_type.value}")
                    print(f"   Retrying in {delay:.1f}s...")
                    time.sleep(delay)

                    # Exponential backoff
                    delay = min(delay * config.exponential_base, config.max_delay)

            raise RuntimeError(f"Failed after {config.max_retries} retries")

        return wrapper
    return decorator

# Usage
@retry_with_backoff(RetryConfig(max_retries=3, initial_delay=1.0))
def generate_with_retry(prompt: str):
    """Generate with automatic retry on failure"""
    return llm.generate(prompt)

# This will retry up to 3 times with exponential backoff
result = generate_with_retry("Analyze earnings report")
Pattern 2: Circuit Breaker
When a service starts failing repeatedly, stop calling it:
from datetime import datetime, timedelta
from enum import Enum

class CircuitState(Enum):
    CLOSED = "closed"      # Normal operation
    OPEN = "open"          # Failing, reject requests
    HALF_OPEN = "half_open"  # Testing recovery

class CircuitBreaker:
    """
    Circuit breaker for fault tolerance

    Prevents cascading failures by stopping calls to
    failing services
    """

    def __init__(
        self,
        failure_threshold: int = 5,
        timeout: int = 60,
        expected_exception: type = Exception
    ):
        self.failure_threshold = failure_threshold
        self.timeout = timeout
        self.expected_exception = expected_exception

        self.failure_count = 0
        self.last_failure_time = None
        self.state = CircuitState.CLOSED

    def call(self, func: Callable, *args, **kwargs):
        """Execute function with circuit breaker protection"""

        if self.state == CircuitState.OPEN:
            # Check if timeout elapsed
            if datetime.now() - self.last_failure_time > timedelta(seconds=self.timeout):
                self.state = CircuitState.HALF_OPEN
                print("? Circuit breaker: HALF_OPEN (testing recovery)")
            else:
                raise RuntimeError("Circuit breaker OPEN - service unavailable")

        try:
            result = func(*args, **kwargs)

            # Success - reset if recovering
            if self.state == CircuitState.HALF_OPEN:
                self.state = CircuitState.CLOSED
                self.failure_count = 0
                print("? Circuit breaker: CLOSED (service recovered)")

            return result

        except self.expected_exception as e:
            self.failure_count += 1
            self.last_failure_time = datetime.now()

            if self.failure_count >= self.failure_threshold:
                self.state = CircuitState.OPEN
                print(f"? Circuit breaker: OPEN (threshold {self.failure_threshold} reached)")

            raise

# Usage
circuit_breaker = CircuitBreaker(failure_threshold=5, timeout=60)

def generate_protected(prompt: str):
    """Generate with circuit breaker protection"""
    return circuit_breaker.call(llm.generate, prompt)

# If llm.generate fails 5 times, circuit breaker opens
# Requests fail fast for 60 seconds
# Then one test request (half-open)
# If successful, normal operation resumes
This prevents:
Thundering herd problem
Resource exhaustion
Long timeouts on every request
Pattern 3: Rate Limiting
Protect your system from overload:
import time

class RateLimiter:
    """
    Token bucket rate limiter

    Limits requests per second to prevent overload
    """

    def __init__(self, max_requests: int, time_window: float = 1.0):
        self.max_requests = max_requests
        self.time_window = time_window
        self.tokens = max_requests
        self.last_update = time.time()

    def acquire(self, tokens: int = 1) -> bool:
        """Try to acquire tokens, return True if allowed"""

        now = time.time()
        elapsed = now - self.last_update

        # Refill tokens based on elapsed time
        self.tokens = min(
            self.max_requests,
            self.tokens + (elapsed / self.time_window) * self.max_requests
        )
        self.last_update = now

        if self.tokens >= tokens:
            self.tokens -= tokens
            return True
        else:
            return False

    def wait_for_token(self, tokens: int = 1):
        """Wait until token is available"""
        while not self.acquire(tokens):
            time.sleep(0.1)

# Usage
rate_limiter = RateLimiter(max_requests=100, time_window=1.0)

@app.post("/generate")
async def generate(request: GenerateRequest):
    # Check rate limit
    if not rate_limiter.acquire():
        raise HTTPException(
            status_code=429,
            detail="Rate limit exceeded (100 req/sec)"
        )

    # Process request
    result = llm.generate(request.prompt)
    return result
Why this matters:
Prevents DoS (accidental or malicious)
Protects GPU from overload
Ensures fair usage
Pattern 4: Fallback Strategies
When primary fails, don’t just error—degrade gracefully:
def generate_with_fallback(prompt: str) -> str:
    """
    Try multiple strategies before failing

    Strategy 1: Primary model (Llama-3-8B)
    Strategy 2: Cached response (if available)
    Strategy 3: Simpler model (Phi-2)
    Strategy 4: Template response
    """

    # Try primary model
    try:
        return llm_primary.generate(prompt)

    except Exception as e:
        print(f"??  Primary model failed: {e}")

        # Fallback 1: Check cache
        cached_response = cache.get(prompt)
        if cached_response:
            print("? Returning cached response")
            return cached_response

        # Fallback 2: Try simpler model
        try:
            print("? Falling back to Phi-2")
            return llm_simple.generate(prompt)

        except Exception as e2:
            print(f"??  Fallback model also failed: {e2}")

            # Fallback 3: Template response
            return (
                "I apologize, but I'm unable to process your request right now. "
                "Please try again in a few minutes, or contact support if the issue persists."
            )

# User never sees "Internal Server Error"
# They always get SOME response
Graceful degradation examples:
Can’t generate full analysis? Return summary
Can’t use complex model? Use simple model
Can’t generate? Return cached response
Everything failing? Return polite error message
Pattern 5: Timeout Handling
Don’t let requests hang forever:
import signal

class TimeoutError(Exception):
    pass

def timeout_handler(signum, frame):
    raise TimeoutError("Request timed out")

def generate_with_timeout(prompt: str, timeout_seconds: int = 30):
    """Generate with timeout"""

    # Set timeout
    signal.signal(signal.SIGALRM, timeout_handler)
    signal.alarm(timeout_seconds)

    try:
        result = llm.generate(prompt)

        # Cancel timeout
        signal.alarm(0)
        return result

    except TimeoutError:
        print(f"? Request timed out after {timeout_seconds}s")
        return "Request timed out. Please try a shorter prompt."

# Or using asyncio
import asyncio

async def generate_with_timeout_async(prompt: str, timeout_seconds: int = 30):
    """Generate with async timeout"""

    try:
        result = await asyncio.wait_for(
            llm.generate_async(prompt),
            timeout=timeout_seconds
        )
        return result

    except asyncio.TimeoutError:
        return "Request timed out. Please try a shorter prompt."
Why timeouts matter:
Prevent resource leaks
Free up GPU for other requests
Give users fast feedback
Combined Example
Here’s how I combine all patterns:
from fastapi import FastAPI, HTTPException
from circuitbreaker import CircuitBreaker, CircuitBreakerError

app = FastAPI()

# Initialize components
circuit_breaker = CircuitBreaker(failure_threshold=5, timeout=60)
rate_limiter = RateLimiter(max_requests=100, time_window=1.0)
cache = ResponseCache(ttl=3600)

@app.post("/generate")
@retry_with_backoff(max_retries=3)
async def generate(request: GenerateRequest):
    """
    Generate with full error handling:
    - Rate limiting
    - Circuit breaker
    - Retry with backoff
    - Timeout
    - Fallback strategies
    - Caching
    """

    # Rate limiting
    if not rate_limiter.acquire():
        raise HTTPException(status_code=429, detail="Rate limit exceeded")

    # Check cache first
    cached = cache.get(request.prompt)
    if cached:
        return {"text": cached, "cached": True}

    try:
        # Circuit breaker protection
        result = circuit_breaker.call(
            generate_with_timeout,
            request.prompt,
            timeout_seconds=30
        )

        # Cache successful response
        cache.set(request.prompt, result)

        return {"text": result, "status": "success"}

    except CircuitBreakerError:
        # Circuit breaker open - return fallback
        return {
            "text": "Service temporarily unavailable. Using cached response.",
            "status": "degraded",
            "fallback": True
        }

    except TimeoutError:
        raise HTTPException(status_code=504, detail="Request timed out")

    except Exception as e:
        # Log error
        logger.error(f"Generation failed: {e}")

        # Return graceful error
        return {
            "text": "I apologize, but I'm unable to process your request.",
            "status": "error",
            "fallback": True
        }
What this provides:
? Prevents overload (rate limiting)
? Fast failure (circuit breaker)
? Automatic recovery (retry)
? Resource protection (timeout)
? Graceful degradation (fallback)
? Performance (caching)
Deployment Recommendations
While my testing remained at POC level, these patterns prepare for production deployment:
Before deploying:
Load Testing
Test with expected peak load (10-100x normal traffic)
Measure P95 latency under load (<500ms target)
Verify error rate stays <1%
Confirm GPU memory stable (no leaks)
Production Deployment Checklist
Before going live, verify:
Infrastructure:
[ ] GPU drivers installed and working (nvidia-smi)
[ ] Alert destinations set (PagerDuty, Slack, email)
[ ] Langfuse set up (if using LLM observability)
Testing:
[ ] Health check returns 200 OK
[ ] Can generate completions via API
[ ] Metrics endpoint returning data
[ ] Error handling works (try invalid input)
[ ] Budget limits enforced (if configured)
[ ] Load test passed (see next section)
Security:
[ ] API authentication enabled
[ ] Rate limiting configured
[ ] HTTPS enforced (no HTTP)
[ ] CORS policies set
[ ] Input validation in place
[ ] Secrets not in git (use env variables)
Operations:
[ ] Backup strategy for logs
[ ] Model cache backed up
[ ] Runbook written (how to handle incidents)
[ ] On-call rotation defined
[ ] SLAs documented
[ ] Disaster recovery plan
Real-World Results
Testing on GCP L4 GPUs with 11 queries produced these validated results:
End-to-End Integration Test Results
Test configuration:
Model: Phi-2 (2.7B parameters)
Quantization: None (FP16 baseline)
Prefix caching: Enabled
Budget: $10/day
Hardware: GCP L4 GPU
Results:
Metric
Value
Total Requests
11
Success Rate
100% (11/11) ?
Total Tokens Generated
2,200
Total Cost
$0.000100
Average Latency
5,418ms
Cache Hit Rate
90.9% ?
Budget Utilization
0.001%
Model distribution:
Phi-2: 54.5% (6 requests)
Llama-3-8B: 27.3% (3 requests)
Mistral-7B: 18.2% (2 requests)
What this proves: ? Intelligent routing works (3 models selected correctly) ? Budget enforcement works (under budget, no overruns) ? Prefix caching works (91% hit rate = huge savings) ? Multi-model support works (distributed correctly) ? Observability works (all metrics collected)
Cost Comparison
Let me show you the exact cost calculations:
Per-request costs (from actual test):
Request 1 (uncached): $0.00002038
Requests 2-11 (cached): $0.00000414 average

Total: $0.00010031 for 11 requests
Average: $0.0000091 per request
Extrapolated monthly costs (10,000 requests/day):
Configuration
Daily Cost
Monthly Cost
Savings
Without caching
$0.91
$27.30
Baseline
With caching (91% hit rate)
$0.18
$5.46
80%
With quantization (AWQ)
$0.09
$2.73
90%
All optimizations
$0.09
$2.73
90%
Add in infrastructure costs:
GCP L4 GPU: $0.45/hour = $328/month

Total monthly cost:
- Infrastructure: $328
- API costs: $2.73
- Total: $330.73/month for 10,000 requests/day
Compare to OpenAI:
OpenAI GPT-4:
- Input: $0.03 per 1K tokens
- Output: $0.06 per 1K tokens
- Average request: 100 tokens in + 100 tokens out = $0.009
- 10,000 requests/day = $90/day = $2,700/month

Savings: $2,369/month (88% cheaper!)
After building and testing this platform, I understand why enterprise AI differs from giving developers ChatGPT access and why 95% of initiatives fail. Here is why these layers matter:
Cost tracking isn’t about being cheap—it’s about accountability. Finance won’t approve next year’s AI budget without ROI proof.
Intelligent routing prevents the death spiral: early excitement ? everyone uses the expensive model ? costs spiral ? finance pulls the plug ? initiative dies.
Observability builds trust. When executives ask “Is AI working?”, you need data: success rates, cost per department, quality trends. Without metrics, you get politics and cancellation.
Error handling and budgets are professional table stakes. Enterprises can’t have systems that randomly fail or spend unpredictably.
Here are things missing from the prototype:
Security: No SSO, PII detection, audit logs for compliance, encryption at rest, security review
High Availability: Single instance, no load balancer, no failover, no disaster recovery
Operations: No CI/CD, secrets management, log aggregation, incident playbooks
Scale: No auto-scaling, multi-region, or load testing beyond 100 concurrent
Governance: No approval workflows, per-user limits, content filtering, A/B testing
I have learned that vLLM works, open models are competitive, the tooling is mature. This POC proves that the patterns work and the savings are real. The 5% that succeed treat AI as infrastructure requiring proper tooling. The 95% that fail treat it as magic requiring only faith.
Try it yourself: All code at github.com/bhatti/vllm-tutorial. Clone it, test it, prove it works in your environment. Then build the business case for production investment.
Over the last year, I have been applying Agentic AI to various problems at work and to improve personal productivity. For example, every morning, I faced the same challenge: information overload.
My typical morning looked like this:
? Check emails and sort out what’s important
? Check my calendar and figure out which ones are critical
? Skim HackerNews, TechCrunch, newsletters for any important insight
? Check Slack for any critical updates
?? Look up weather ? Should I bring an umbrella or jacket?
? Already lost 45 minutes just gathering information!
I needed an AI assistant that could digest all this information while I shower, then present me with a personalized 3-minute brief highlighting what actually matters. Also, following were key constraints for this assistant:
? Complete privacy – My emails and calendar shouldn’t leave my laptop and I didn’t want to run any MCP servers in cloud that could expose my private credentials
? Zero ongoing costs – Running complex Agentic workflow on the hosted environments could easily cost me hundreds of dollars a month
? Fast iteration – Test changes instantly during development
? Flexible deployment – Start local, deploy to cloud when ready
I will walk through my journey of building Daily Minutes with Claude Code – a fully functional agentic AI system that runs on my laptop using local LLMs, saves me 30 minutes every morning.
Agentic Building Blocks
I applied following building blocks to create this system:
MCP (Model Context Protocol) – connecting to data sources discoverable by AI
RAG (Retrieval-Augmented Generation) – give AI long-term memory
ReAct Pattern – teach AI to reason before acting
RLHF (Reinforcement Learning from Human Feedback) – teach AI from my preferences
Let me walk you through how I built each piece, the problems I encountered, and how I solved them.
High-level Architecture
After several iterations, I landed on a clean 3-layer architecture:
Why this architecture worked for me:
Layer 1 (Data Sources) – I used MCP to make connectors pluggable. When I later wanted to add RSS feeds, I just registered a new tool – no changes to the AI logic.
Layer 2 (Intelligence) – This is where the magic happens. The ReAct agent reasons about what data it needs, LangGraph orchestrates fetching from multiple sources in parallel, RAG provides historical context, and RLHF learns from my feedback.
Layer 3 (UI) – I kept the UI simple and fast. It reads from a database cache, so it loads instantly – no waiting for AI to process.
How the Database Cache Works
This is a key architectural decision that made the UI lightning-fast:
# src/services/startup_service.py
async def preload_daily_data():
    """Background job that generates brief and caches in database."""

    # 1. Fetch all data in parallel (LangGraph orchestration)
    data = await langgraph_orchestrator.fetch_all_sources()

    # 2. Generate AI brief (ReAct agent with RAG)
    brief = await brief_generator.generate(
        emails=data['emails'],
        calendar=data['calendar'],
        news=data['news'],
        weather=data['weather']
    )

    # 3. Cache everything in SQLite
    await db.set_cache('daily_brief_data', brief.to_dict(), ttl=3600)  # 1 hour TTL
    await db.set_cache('news_data', data['news'], ttl=3600)
    await db.set_cache('emails_data', data['emails'], ttl=3600)

    logger.info("? All data preloaded and cached")

# src/ui/components/daily_brief.py
def render_daily_brief_section():
    """UI just reads from cache - no AI processing!"""

    # Fast read from database (milliseconds, not seconds)
    if 'data' in st.session_state and st.session_state.data.get('daily_brief'):
        brief_data = st.session_state.data['daily_brief']
        _display_persisted_brief(brief_data)  # Instant!
    else:
        st.info("Run `make preload` to generate your first brief.")
Why this architecture rocks:
? UI loads in <500ms (reading from SQLite cache)
? Background refresh (run make preload or schedule with cron)
? Persistent (brief survives app restarts)
? Testable (can test UI without LLM calls)
Part 1: Setting Up My Local AI Stack
First, I needed to get Ollama running locally. This took me about 30 minutes.
Installing Ollama
# On macOS (what I use)
brew install ollama

# Start the service
ollama serve

# Pull the models I chose
ollama pull qwen2.5:7b         # Main LLM - fast on my M3 Mac
ollama pull nomic-embed-text   # For RAG embeddings
Why I chose Qwen 2.5 (7B):
? Runs fast on my M3 MacBook Pro (no GPU needed)
? Good reasoning capabilities for summarization
? Small enough to iterate quickly (responses in 2-3 seconds)
? Free and private – data never leaves my laptop
Later, I can swap to GPT-4 or Claude with just a config change when I deploy to production.
Testing My Setup
I wanted to make sure Ollama was working before going further:
# Quick test
PYTHONPATH=. python -c "
import asyncio
from src.services.ollama_service import get_ollama_service

async def test():
    ollama = get_ollama_service()
    result = await ollama.generate('Explain RAG in one sentence.')
    print(result)

asyncio.run(test())
"

# Output I got:
# RAG (Retrieval-Augmented Generation) enhances LLM responses by retrieving
# relevant information from a knowledge base before generating answers.
? First milestone: Local AI working!
Part 2: Building MCP Connectors
Instead of hard coding data fetching like this:
# ? My first attempt (brittle)
async def get_daily_data():
    news = await fetch_hackernews()
    weather = await fetch_weather()
    # Later I wanted to add RSS feeds... had to modify this function
    # Then I wanted Slack... modified again
    # This was getting messy fast!
I decided to use MCP (Model Context Protocol) to register data sources as “tools” so that the AI can discover and call by name:
Building News Connector
I started with HackerNews since I check it every morning:
# src/connectors/hackernews.py
class HackerNewsConnector:
    """Fetches top stories from HackerNews API."""

    async def execute_async(self, max_stories: int = 10):
        """The main method MCP will call."""
        # 1. Fetch top story IDs
        response = await self.client.get(
            "https://hacker-news.firebaseio.com/v0/topstories.json"
        )
        story_ids = response.json()[:max_stories]

        # 2. Fetch each story (I fetch these in parallel for speed)
        articles = []
        for story_id in story_ids:
            story = await self._fetch_story(story_id)
            articles.append(self._convert_to_article(story))

        return articles
Key learning: Keep connectors simple. They should do ONE thing: fetch data and return it in a standard format.
Registering with MCP Server
Then I registered this connector with my MCP server:
# src/services/mcp_server.py
class MCPServer:
    """The tool registry that AI agents query."""

    def _register_tools(self):
        # Register HackerNews
        self.tools["fetch_hackernews"] = MCPTool(
            name="fetch_hackernews",
            description="Fetch top tech stories from HackerNews with scores and comments",
            parameters={
                "max_stories": {
                    "type": "integer",
                    "description": "How many stories to fetch (1-30)",
                    "default": 10
                }
            },
            executor=HackerNewsConnector()
        )
This allows my AI to discover this tool and call it without me writing any special integration code!
Testing MCP Discovery
# I tested if the AI could discover my tools
PYTHONPATH=. python -c "
from src.services.mcp_server import get_mcp_server

mcp = get_mcp_server()
print('Available tools:')
for tool in mcp.list_tools():
    print(f'  ? {tool[\"name\"]}: {tool[\"description\"]}')
"

# Output I got:
# Available tools:
#   ? fetch_hackernews: Fetch top tech stories from HackerNews...
#   ? get_current_weather: Get current weather conditions...
#   ? fetch_rss_feeds: Fetch articles from configured RSS feeds...
Later, when I wanted to add RSS feeds, I just created a new connector and registered it. The AI automatically discovered it – no changes needed to my ReAct agent or LangGraph workflows!
Part 3: Building RAG Pipeline
As LLM have limited context window, RAG (Retrieval-Augmented Generation) can be used to create an AI semantic memory by:
Converting text to vectors (embeddings)
Storing vectors in a database (ChromaDB)
Searching by meaning, not just keywords
Building RAG Service
I then implemented RAG service as follows:
# src/services/rag_service.py
class RAGService:
    """Semantic memory using ChromaDB."""

    def __init__(self):
        # Initialize ChromaDB (stores on disk)
        self.client = chromadb.Client(Settings(
            persist_directory="./data/chroma_data"
        ))

        # Create collection for my articles
        self.collection = self.client.get_or_create_collection(
            name="daily_minutes"
        )

        # Ollama for creating embeddings
        self.ollama = get_ollama_service()

    async def add_document(self, content: str, metadata: dict):
        """Store a document with its vector embedding."""

        # 1. Convert text to vector (this is the magic!)
        embedding = await self.ollama.create_embeddings(content)

        # 2. Store in ChromaDB with metadata
        self.collection.add(
            documents=[content],
            embeddings=[embedding],
            metadatas=[metadata],
            ids=[hashlib.md5(content.encode()).hexdigest()]
        )

    async def search(self, query: str, max_results: int = 5):
        """Semantic search - find by meaning!"""

        # 1. Convert query to vector
        query_embedding = await self.ollama.create_embeddings(query)

        # 2. Find similar documents (cosine similarity)
        results = self.collection.query(
            query_embeddings=[query_embedding],
            n_results=max_results
        )

        return results
I then tested it:
# I stored an article about EU AI regulations
await rag.add_document(
    content="European Union announces comprehensive AI safety regulations "
            "focusing on transparency, accountability, and privacy protection.",
    metadata={"type": "article", "topic": "ai_safety"}
)

# Later, I searched using different words
results = await rag.search("privacy rules for artificial intelligence")
This shows that RAG isn’t just storing text – it understands meaning through vector mathematics.
What I Store in RAG
Over time, I started storing other data like emails, todos, events, etc:
# 1. News articles (for historical context)
await rag.add_article(article)

# 2. Action items from emails
await rag.add_todo(
    "Complete security training by Nov 15",
    source="email",
    priority="high"
)

# 3. Meeting context
await rag.add_document(
    "Q4 Planning Meeting - need to prepare budget estimates",
    metadata={"type": "meeting", "date": "2025-02-01"}
)

# 4. User preferences (this feeds into RLHF later!)
await rag.add_document(
    "User marked 'AI safety' topics as important",
    metadata={"type": "preference", "category": "ai_safety"}
)
With this AI memory, it can answer questions like:
“What do I need to prepare for tomorrow’s meeting?”
“What AI safety articles did I read this week?”
“What are my pending action items?”
Part 4: Building the ReAct Agent
In my early prototyping, the implementation just executed blindly:
This wasted time fetching data I didn’t need. I wanted my AI to reason first, then act so I applied ReAct (Reasoning + Acting), which works in a loop:
THOUGHT: AI reasons about what to do next
ACTION: AI executes a tool/function
OBSERVATION: AI observes the result
Repeat until goal achieved
Implementing My ReAct Agent
Here is how it ReAct agent was built:
# src/agents/react_agent.py
class ReActAgent:
    """Agent that thinks before acting."""

    async def run(self, goal: str):
        """Execute goal using ReAct loop."""
        steps = []
        observations = []

        for step_num in range(1, self.max_steps + 1):
            # 1. THOUGHT: Ask AI what to do next
            thought = await self._generate_thought(goal, steps, observations)

            # Check if we're done
            if "FINAL ANSWER" in thought:
                return self._extract_answer(thought)

            # 2. ACTION: Parse what action to take
            action = self._parse_action(thought)
            # Example: {"action": "call_tool", "tool": "fetch_hackernews"}

            # 3. EXECUTE: Run the action via MCP
            observation = await self._execute_action(action)
            observations.append(observation)

            # Record this step for debugging
            steps.append({
                "thought": thought,
                "action": action,
                "observation": observation
            })

        return {"steps": steps, "answer": "Max steps reached"}
The hardest part was writing the prompts that made the AI reason properly:
async def _generate_thought(self, goal, steps, observations):
    """Generate next reasoning step."""

    prompt = f"""Goal: {goal}

Previous steps:
{self._format_steps(steps)}

Available actions:
- query_rag(query): Search my semantic memory
- call_tool(name, params): Execute an MCP tool
- FINAL ANSWER: When you have everything needed

Think step-by-step. What should I do next?

Format your response as:
THOUGHT: <your reasoning>
ACTION: <action to take>
"""

    return await self.ollama.generate(prompt, temperature=0.7)
I added debug logging to see the AI’s reasoning:
? Goal: Generate my daily brief

Step 1:
  ? THOUGHT: I need to gather news, check weather, and see user preferences
  ? ACTION: call_tool("fetch_hackernews", max_stories=10)
  ?? OBSERVATION: Fetched 10 articles about AI, privacy, and tech

Step 2:
  ? THOUGHT: Got news. User preferences would help prioritize.
  ? ACTION: query_rag("user interests and preferences")
  ?? OBSERVATION: User cares about AI safety, security, privacy

Step 3:
  ? THOUGHT: Should filter articles to user's interests
  ? ACTION: call_tool("get_current_weather", location="Seattle")
  ?? OBSERVATION: 70°F, Partly cloudy

Step 4:
  ? THOUGHT: I have news (filtered by user interests), weather. Ready to generate.
  ? ACTION: FINAL ANSWER
  ? Generated personalized brief highlighting AI safety articles
# src/models/email.py
class ImportanceScoringMixin:
    """Learn from user feedback."""

    importance_score: float = 0.5  # AI's base score
    boost_labels: Set[str] = set()  # Words user marked important
    filter_labels: Set[str] = set()  # Words user wants to skip

    def apply_rlhf_boost(self, content_text: str) -> float:
        """Adjust score based on learned preferences."""
        adjusted = self.importance_score
        content_lower = content_text.lower()

        # Boost if content matches important keywords
        for label in self.boost_labels:
            if label.lower() in content_lower:
                adjusted += 0.1  # Bump up priority!

        # Penalize if content matches skip keywords
        for label in self.filter_labels:
            if label.lower() in content_lower:
                adjusted -= 0.2  # Push down priority!

        # Keep in valid range [0, 1]
        return max(0.0, min(1.0, adjusted))
Note: Code examples are simplified for clarity. See GitHub for the full production implementation.
Adding Feedback UI
In my Streamlit dashboard, I added ?/? buttons:
# User sees an email
for email in emails:
    col1, col2, col3 = st.columns([8, 1, 1])

    with col1:
        st.write(f"**{email.subject}**")
        st.info(email.snippet)

    with col2:
        if st.button("?", key=f"important_{email.id}"):
            # Extract what made this important
            keywords = await extract_keywords(email.subject + email.body)
            # Add to boost labels
            user_profile.boost_labels.update(keywords)
            st.success(f"? Learned: You care about {', '.join(keywords)}")

    with col3:
        if st.button("?", key=f"skip_{email.id}"):
            # Learn to deprioritize these
            keywords = await extract_keywords(email.subject)
            user_profile.filter_labels.update(keywords)
            st.success(f"? Will deprioritize: {', '.join(keywords)}")
Part 6: Orchestrating with LangGraph
Instead of fetching contents from all data sources sequential for the daily minutes:
Note: WorkflowState is a shared dictionary that nodes pass data through – like a clipboard for the workflow. The analyze node parses the user’s request and decides which data sources are needed.
Implementing Node Functions
Each node is just an async function:
async def _fetch_news(self, state: WorkflowState):
    """Fetch news in parallel."""
    try:
        articles = await self.mcp.execute_tool(
            "fetch_hackernews",
            {"max_stories": 10}
        )
        state["news_articles"] = articles
    except Exception as e:
        state["errors"].append(f"News fetch failed: {e}")
        state["news_articles"] = []

    return state

async def _search_context(self, state: WorkflowState):
    """Search RAG for relevant context."""
    query = state["user_request"]
    results = await self.rag.search(query, max_results=5)

    # Build context string
    context = "\n".join([r['content'] for r in results])
    state["context"] = context

    return state
Running the Workflow
# Execute the complete workflow
result = await orchestrator.run("Generate my daily brief")

# I get back:
{
    "news_articles": [...],      # 10 articles
    "emails": [...],              # 5 unread
    "calendar_events": [...],     # 3 events today
    "context": "...",             # RAG context
    "summary": "...",             # Generated brief
    "processing_time": 5.2        # Seconds (not 11!)
}
The LLM Factory Pattern – How I Made It Cloud-Ready
Following code snippet shows how does the system seamlessly switch between local Ollama and cloud providers:
# src/services/llm_factory.py
def get_llm_service():
    """Factory pattern - works with any LLM provider."""
    provider = os.getenv("LLM_PROVIDER", "ollama")

    if provider == "ollama":
        return OllamaService(
            base_url=os.getenv("OLLAMA_BASE_URL", "http://localhost:11434"),
            model=os.getenv("OLLAMA_MODEL", "qwen2.5:7b")
        )
    elif provider == "openai":
        return OpenAIService(
            api_key=os.getenv("OPENAI_API_KEY"),
            model=os.getenv("OPENAI_MODEL", "gpt-4-turbo")
        )
    elif provider == "google":
        # Like in my previous Vertex AI article!
        return VertexAIService(
            project_id=os.getenv("GCP_PROJECT_ID"),
            model="gemini-1.5-flash"
        )

    raise ValueError(f"Unknown provider: {provider}")

# All services implement the same interface:
class BaseLLMService:
    async def generate(self, prompt: str, **kwargs) -> str:
        """Generate text from prompt."""
        raise NotImplementedError

    async def create_embeddings(self, text: str) -> List[float]:
        """Create vector embeddings."""
        raise NotImplementedError
The ReAct agent, RAG service, and Brief Generator all use get_llm_service() – they don’t care which provider is running!
Part 7: The Challenges I Faced
Building this system wasn’t smooth. Here are the biggest challenges:
Challenge 1: LLM Generating Vague Summaries
Problem: My early briefs were terrible:
? "Today's news features a mix of technology updates and various topics."
This was useless! I needed specifics.
Solution: I rewrote my prompts with explicit rules:
# ? Better prompt with strict rules
prompt = f"""Generate a daily brief following these STRICT rules:

PRIORITY ORDER (most important first):
1. Urgent emails or action items
2. Today's calendar events
3. Market/business news
4. Tech news

TLDR FORMAT (exactly 3 bullets, be SPECIFIC):
* Bullet 1: Most urgent email/action (include WHO, WHAT, WHEN)
   Example: "Client escalation from Acme Corp affecting 50K users - response needed by 2pm"

* Bullet 2: Most important calendar event today (include TIME and WHAT TO PREPARE)
   Example: "2pm: Board meeting - prepare Q4 revenue slides"

* Bullet 3: Top market/business news (include NUMBERS/SPECIFICS)
   Example: "Federal Reserve raises rates 0.5% to 5.25% - affects tech hiring"

AVOID THESE PHRASES (they're too vague):
? "mix of updates"
? "various topics"
? "continues to make progress"
? "interesting developments"

USE SPECIFIC DETAILS:
? Names (people, companies)
? Numbers (percentages, dollar amounts, deadlines)
? Times (when something happened or needs to happen)

Content to summarize:
{content}

Generate: TLDR (3 bullets), Summary (5-6 detailed sentences), Key Insights (5 bullets)
"""
Result: Went from vague ? specific, actionable briefs!
Solution: Split and render each bullet separately:
# ? Doesn't work
st.info(tldr)

# ? Works!
tldr_lines = [line.strip() for line in tldr.split('\n') if line.strip()]
for bullet in tldr_lines:
    st.markdown(bullet)
Challenge 3: AI Prioritizing News Over Personal Tasks
Problem: My brief focused on tech news, ignored my urgent emails:
Solution: I restructured my prompt to explicitly label priority:
# src/services/brief_scheduler.py
async def _generate_daily_brief(emails, calendar, news, weather):
"""Generate prioritized daily brief with structured prompt."""
# Separate market vs tech news (market is higher priority)
market_news = [n for n in news if 'market' in n.tags]
tech_news = [n for n in news if 'market' not in n.tags]
# Sort emails by RLHF-boosted importance score
important_emails = sorted(
emails,
key=lambda e: e.apply_rlhf_boost(e.subject + e.snippet),
reverse=True
)[:5] # Top 5 only
# Build structured prompt with clear priority
prompt = f"""
**SECTION 1: IMPORTANT EMAILS (HIGHEST PRIORITY - use for TLDR bullet #1)**
{format_emails(important_emails)}
**SECTION 2: TODAY'S CALENDAR (SECOND PRIORITY - use for TLDR bullet #2)**
{format_calendar(calendar)}
**SECTION 3: MARKET NEWS (THIRD PRIORITY - use for TLDR bullet #3)**
{format_market_news(market_news)}
**SECTION 4: TECH NEWS (LOWEST PRIORITY - summarize briefly)**
{format_tech_news(tech_news)}
**SECTION 5: WEATHER**
{format_weather(weather)}
Generate a daily brief following this EXACT priority order:
1. Email action items FIRST
2. Calendar events SECOND
3. Market/business news THIRD
4. Tech news LAST (brief mention only)
TLDR must have EXACTLY 3 bullets using content from sections 1, 2, 3 (not section 4).
"""
return await llm.generate(prompt)
Result: My urgent email moved to bullet #1 where it belongs! The AI now respects the priority structure.
Challenge 4: RAG Returning Irrelevant Results
Problem: Semantic search sometimes returned weird matches:
Query: "AI safety regulations"
Result: Article about "safe AI models for healthcare" (wrong context!)
Solution: I added metadata filtering and better embeddings:
? Fast: No network latency, responses in 2-3 seconds
? Private: My emails never touch the internet
? Offline: Works on planes, cafes without WiFi
Trade-offs I accept:
?? Slower than GPT-4
?? Less capable reasoning (7B vs 175B+ parameters)
?? Manual updates (pull new Ollama models myself)
Production
# .env.production
LLM_PROVIDER=openai # Just change this line!
OPENAI_API_KEY=sk-...
OPENAI_MODEL=gpt-4-turbo
DATABASE_URL=postgresql://... # Scalable DB
REDIS_URL=redis://prod-cluster:6379 # Distributed cache
The magic: Same code, different LLM!
# src/services/llm_factory.py
def get_llm_service():
"""Factory pattern - works with any LLM."""
provider = os.getenv("LLM_PROVIDER", "ollama")
if provider == "ollama":
return OllamaService()
elif provider == "openai":
return OpenAIService()
elif provider == "anthropic":
return ClaudeService()
elif provider == "google":
return VertexAIService() # Like in my previous article!
raise ValueError(f"Unknown provider: {provider}")
Part 11: Testing Everything
I used TDD extensively to build each feature so that it’s easy to debug if something is not working:
Unit Tests
# Test MCP tool registration
pytest tests/unit/test_mcp_server.py -v
# Test RAG semantic search
pytest tests/unit/test_rag_service.py -v
# Test ReAct reasoning
pytest tests/unit/test_react_agent.py -v
# Test RLHF scoring
pytest tests/unit/test_rlhf_scoring.py -v
# Run all unit tests
pytest tests/unit/ -v
# 516 passed in 45.23s ?
Integration Tests
Also, in some cases unit tests couldn’t fully validate so I wrote integration tests to test persistence logic with sqlite database or generating real analysis from news:
# tests/integration/test_brief_quality.py
async def test_tldr_has_three_bullets():
"""TLDR must have exactly 3 bullets."""
brief = await db.get_cache('daily_brief_data')
tldr = brief.get('tldr', '')
bullets = [line for line in tldr.split('\n') if line.strip().startswith('•')]
assert len(bullets) == 3, f"Expected 3 bullets, got {len(bullets)}"
assert "email" in bullets[0].lower() or "urgent" in bullets[0].lower()
assert "calendar" in bullets[1].lower() or "meeting" in bullets[1].lower()
async def test_no_generic_phrases():
"""Brief should not contain vague phrases."""
brief = await db.get_cache('daily_brief_data')
summary = brief.get('summary', '')
bad_phrases = ["mix of updates", "various topics", "continues to"]
for phrase in bad_phrases:
assert phrase not in summary.lower(), f"Found generic phrase: {phrase}"
Manual Testing (My Daily Workflow)
# 1. Fetch data and generate brief
make preload
# Output I see:
# ? Fetching news from HackerNews... (10 articles)
# ? Fetching weather... (70°F, Sunny)
# ? Analyzing articles with AI... (15 articles)
# ? Generating daily brief... (Done in 18.3s)
# ? Brief saved to database
# 2. Launch UI
streamlit run src/ui/streamlit_app.py
# 3. Check brief quality
# - Is TLDR specific? (not vague)
# - Are priorities correct? (email > calendar > news)
# - Are action items extracted? (from emails)
# - Did RLHF work? (boosted my preferences)
Note: You can schedule preload via cron, e.g., I run it at 6am daily so that brief is ready when I wake up.
Conclusion
Building this Daily Minutes assistant changed how I start my day by giving me a personalized 3-minute brief highlighting what truly matters. Agentic AI excels at automating complex workflows that require judgment, not just execution. The ReAct agent reasons through prioritization. RAG provides contextual memory across weeks of interactions. RLHF learns from my feedback, getting smarter about what I care about. LangGraph orchestrates parallel execution across multiple data sources. These building blocks work together to handle decisions that traditionally needed human attention.
I’m sharing this as a proof of concept, not a finished product. The code works, saves me real time, and demonstrates these techniques effectively. But I’m still iterating. The OAuth integration and error handling needs improvements. The RLHF scoring could be more sophisticated. The ReAct agent sometimes overthinks simple tasks. I’m adding these improvements gradually, testing each change against my daily routine.
The real lesson? Start small, validate with real use, then scale with confidence. I used Claude Code to build this in spare time over a couple weeks. You can do the same—clone the repo, adapt it to your workflow, and see where agentic AI saves you time.
Try It Yourself
# Clone my repo
git clone https://github.com/bhatti/daily-minutes
cd daily-minutes
# Install dependencies
pip install -r requirements.txt
# Setup Ollama
ollama pull qwen2.5:7b
ollama pull nomic-embed-text
# Generate your first brief
make preload
# Launch dashboard
streamlit run src/ui/streamlit_app.py
I spent over a decade in FinTech building the systems traders rely on every day like high-performance APIs streaming real-time charts, technical indicator calculators processing millions of data points per second, and comprehensive analytical platforms ingesting SEC 10-Ks and 10-Qs into distributed databases. We used to parse XBRL filings, ran news/sentiment analysis on earnings calls using early NLP models to detect market anomalies.
Over the past couple of years, I’ve been building AI agents and creating automated workflows that tackle complex problems using agentic AI. I’m also revisiting challenges I hit while building trading tools for fintech companies. For example, the AI I’m working with now reasons about which analysis to run. It grasps context, retrieves information on demand, and orchestrates complex workflows autonomously. It applies Black-Scholes when needed, switches to technical analysis when appropriate, and synthesizes insights from multiple sources—no explicit rules required.
The best part is that I’m running this entire system on my laptop using Ollama and open-source models. Zero API costs during development. When I need production scale, I can switch to cloud APIs with a few lines of code. I will walk you through this journey of rebuilding financial analysis with agentic AI – from traditional algorithms to thinking machines and from rigid pipelines to adaptive workflows.
Why This Approach Changes Everything
Traditional financial systems process data. Agentic AI systems understand objectives and figure out how to achieve them. That’s the fundamental difference that took me a while to fully grasp. And unlike my old systems that required separate codebases for each type of analysis, this one uses the same underlying patterns for everything.
The Money-Saving Secret: Local Development with Ollama
Here’s something that would have saved my startup thousands: you can build and test sophisticated AI systems entirely locally using Ollama. No API keys, no usage limits, no surprise bills.
# This runs entirely on your machine - zero external API calls
from langchain_ollama import OllamaLLM as Ollama
# Local LLM for development and testing
dev_llm = Ollama(
model="llama3.2:latest", # 3.2GB model that runs on most laptops
temperature=0.7,
base_url="http://localhost:11434" # Your local Ollama instance
)
# When ready for production, switch to cloud providers
from langchain_openai import ChatOpenAI
prod_llm = ChatOpenAI(
model="gpt-4",
temperature=0.7
)
# The beautiful part? Same interface, same code
def analyze_stock(llm, ticker):
# This function works with both local and cloud LLMs
prompt = f"Analyze {ticker} stock fundamentals"
return llm.invoke(prompt)
During development, I run hundreds of experiments daily without spending a cent. Once the prompts and workflows are refined, switching to cloud APIs is literally changing one line of code.
Understanding ReAct: How AI Learns to Think Step-by-Step
ReAct (Reasoning and Acting) was the first pattern that made me realize we weren’t just building chatbots anymore. Let me show you exactly how it works with real code from my system.
The Human Thought Process We’re Mimicking
When I manually analyzed stocks, my mental process looked something like this:
“I need to check if Apple is overvalued”
“Let me get the current P/E ratio”
“Hmm, 28.5 seems high, but what’s the industry average?”
“Tech sector average is 25, so Apple is slightly premium”
“But wait, what’s their growth rate?”
“15% annual growth… that PEG ratio of 1.9 suggests fair value”
“Let me check recent news for any red flags…”
ReAct agents follow this exact pattern. Here’s the actual implementation:
class ReActAgent:
"""ReAct Agent that demonstrates reasoning traces"""
# This is the actual prompt from the project
REACT_PROMPT = """You are a financial analysis agent that uses the ReAct framework to solve problems.
You have access to the following tools:
{tools_description}
Use the following format EXACTLY:
Question: the input question you must answer
Thought: you should always think about what to do
Action: the action to take, must be one of [{tool_names}]
Action Input: the input to the action
Observation: the result of the action
... (this Thought/Action/Action Input/Observation can repeat N times)
Thought: I now know the final answer
Final Answer: the final answer to the original input question
Begin! Remember to ALWAYS follow the format exactly.
Question: {question}
Thought: {scratchpad}"""
def _parse_response(self, response: str) -> Tuple[str, str, str, bool]:
"""Parse LLM response to extract thought, action, and input"""
response = response.strip()
# Check for final answer
if "Final Answer:" in response:
parts = response.split("Final Answer:")
thought = parts[0].strip()
final_answer = parts[1].strip()
return thought, "final_answer", final_answer, True
# Parse using regex from actual implementation
thought_match = re.search(r"Thought:\s*(.+?)(?=Action:|$)", response, re.DOTALL)
action_match = re.search(r"Action:\s*(.+?)(?=Action Input:|$)", response, re.DOTALL)
input_match = re.search(r"Action Input:\s*(.+?)(?=Observation:|$)", response, re.DOTALL)
thought = thought_match.group(1).strip() if thought_match else "Thinking..."
action = action_match.group(1).strip() if action_match else "unknown"
action_input = input_match.group(1).strip() if input_match else ""
return thought, action, action_input, False
I can easily trace through reasoning to debug how AI reached its conclusion.
RAG: Solving the Hallucination Problem Once and For All
Early in my experiments, I had to deal with a bit of hallucinations when querying financial data with AI so I applied RAG (Retrieval-Augmented Generation) to give AI access to a searchable library of documents.
How RAG Actually Works
You can think of RAG like having a research assistant who, instead of relying on memory, always checks the source documents before answering:
class RAGEngine:
"""
This engine solved my hallucination problems by grounding
all responses in actual documents. It's like giving the AI
access to your company's document database.
"""
def __init__(self):
# Initialize embeddings - this converts text to searchable vectors
# Using Ollama's local embedding model (free!)
self.embeddings = OllamaEmbeddings(
model="nomic-embed-text:latest" # 274MB model, runs fast
)
# Text splitter - crucial for handling large documents
self.text_splitter = RecursiveCharacterTextSplitter(
chunk_size=512, # Small enough for context window
chunk_overlap=50, # Overlap prevents losing context at boundaries
separators=["\n\n", "\n", ". ", " "] # Smart splitting
)
# Vector store - where we keep our searchable documents
self.vector_store = FAISS.from_texts(["init"], self.embeddings)
def load_financial_documents(self, ticker: str):
"""
In production, this would load real 10-Ks, 10-Qs, earnings calls.
For now, I'm using sample documents to demonstrate the concept.
"""
# Imagine these are real SEC filings
documents = [
{
"content": f"""
{ticker} Q3 2024 Earnings Report
Revenue: $94.9 billion, up 6% year over year
iPhone revenue: $46.2 billion
Services revenue: $23.3 billion (all-time record)
Gross margin: 45.2%
Operating cash flow: $28.7 billion
CEO Tim Cook: "We're incredibly pleased with our record
September quarter results and strong momentum heading into
the holiday season."
""",
"metadata": {
"source": "10-Q Filing",
"date": "2024-10-31",
"document_type": "earnings_report",
"ticker": ticker
}
},
# ... more documents
]
# Process each document
for doc in documents:
# Split into chunks
chunks = self.text_splitter.split_text(doc["content"])
# Create document objects with metadata
for i, chunk in enumerate(chunks):
metadata = doc["metadata"].copy()
metadata["chunk_id"] = i
metadata["total_chunks"] = len(chunks)
# Add to vector store
self.vector_store.add_texts(
texts=[chunk],
metadatas=[metadata]
)
print(f"? Loaded {len(documents)} documents for {ticker}")
def answer_with_sources(self, question: str) -> Dict[str, Any]:
"""
This is where RAG shines - every answer comes with sources
"""
# Find relevant document chunks
relevant_docs = self.vector_store.similarity_search_with_score(
question,
k=5 # Top 5 most relevant chunks
)
# Build context from retrieved documents
context_parts = []
sources = []
for doc, score in relevant_docs:
# Only use highly relevant documents (score < 0.5)
if score < 0.5:
context_parts.append(doc.page_content)
sources.append({
"content": doc.page_content[:100] + "...",
"source": doc.metadata.get("source"),
"date": doc.metadata.get("date"),
"relevance_score": float(score)
})
context = "\n\n---\n\n".join(context_parts)
# Generate answer grounded in retrieved context
prompt = f"""Based on the following verified documents, answer the question.
If the answer is not in the documents, say "I don't have that information."
Documents:
{context}
Question: {question}
Answer (cite sources):"""
response = self.llm.invoke(prompt)
return {
"answer": response,
"sources": sources,
"confidence": len(sources) / 5 # Simple confidence metric
}
MCP-Style Tools: Extending AI Capabilities Beyond Text
Model Context Protocol (MCP) helped me to build a flexible tool system. Instead of hardcoding every capability, we give the AI tools it can discover and use:
class BaseTool(ABC):
"""
Every tool self-describes its capabilities.
This is like giving the AI an instruction manual for each tool.
"""
@abstractmethod
def get_schema(self) -> ToolSchema:
"""Define what this tool does and how to use it"""
pass
@abstractmethod
def execute(self, **kwargs) -> Any:
"""Actually run the tool"""
pass
class StockDataTool(BaseTool):
"""
Real example: This tool replaced my entire market data microservice
"""
def get_schema(self) -> ToolSchema:
return ToolSchema(
name="stock_data",
description="Fetch real-time stock market data including price, volume, and fundamentals",
category=ToolCategory.DATA_RETRIEVAL,
parameters=[
ToolParameter(
name="ticker",
type="string",
description="Stock symbol like AAPL or GOOGL",
required=True
),
ToolParameter(
name="metrics",
type="array",
description="Specific metrics to retrieve",
required=False,
default=["price", "volume", "pe_ratio"],
enum=["price", "volume", "pe_ratio", "market_cap",
"dividend_yield", "beta", "rsi", "moving_avg_50"]
)
],
returns="Dictionary containing requested stock metrics",
examples=[
{"ticker": "AAPL", "metrics": ["price", "pe_ratio"]},
{"ticker": "TSLA", "metrics": ["price", "volume", "rsi"]}
]
)
def execute(self, **kwargs) -> Dict[str, Any]:
"""
This connects to real market data APIs.
In my old system, this was a 500-line service.
"""
ticker = kwargs["ticker"].upper()
metrics = kwargs.get("metrics", ["price", "volume"])
# Using yfinance for real market data
import yfinance as yf
stock = yf.Ticker(ticker)
info = stock.info
result = {"ticker": ticker, "timestamp": datetime.now().isoformat()}
# Fetch requested metrics
metric_mapping = {
"price": lambda: info.get("currentPrice", stock.history(period="1d")['Close'].iloc[-1]),
"volume": lambda: info.get("volume", 0),
"pe_ratio": lambda: info.get("trailingPE", 0),
"market_cap": lambda: info.get("marketCap", 0),
"dividend_yield": lambda: info.get("dividendYield", 0) * 100,
"beta": lambda: info.get("beta", 1.0),
"rsi": lambda: self._calculate_rsi(stock),
"moving_avg_50": lambda: stock.history(period="50d")['Close'].mean()
}
for metric in metrics:
if metric in metric_mapping:
try:
result[metric] = metric_mapping[metric]()
except Exception as e:
result[metric] = f"Error: {str(e)}"
return result
class ToolParameter(BaseModel):
"""Actual parameter definition from project"""
name: str
type: str # "string", "number", "boolean", "object", "array"
description: str
required: bool = True
default: Any = None
enum: Optional[List[Any]] = None
class CalculatorTool(BaseTool):
"""Actual calculator implementation from project"""
def execute(self, **kwargs) -> float:
"""Safely evaluate mathematical expression"""
self.validate_input(**kwargs)
expression = kwargs["expression"]
precision = kwargs.get("precision", 2)
try:
# Security: Remove dangerous operations
safe_expr = expression.replace("__", "").replace("import", "")
# Define allowed functions (from actual code)
safe_dict = {
"abs": abs, "round": round, "min": min, "max": max,
"sum": sum, "pow": pow, "len": len
}
# Add math functions
import math
for name in ["sqrt", "log", "log10", "sin", "cos", "tan", "pi", "e"]:
if hasattr(math, name):
safe_dict[name] = getattr(math, name)
result = eval(safe_expr, {"__builtins__": {}}, safe_dict)
return round(result, precision)
except Exception as e:
raise ValueError(f"Calculation error: {e}")
Orchestrating Everything with LangGraph
This is where all the pieces come together. LangGraph allows coordinating multiple agents and tools in sophisticated workflows:
class FinancialAnalysisWorkflow:
"""
This workflow replaces what used to be multiple microservices,
message queues, and orchestration layers. It's beautiful.
"""
def _build_graph(self) -> StateGraph:
"""
Define how different analysis components work together
"""
workflow = StateGraph(AgentState)
# Add all our analysis nodes
workflow.add_node("collect_data", self.collect_market_data)
workflow.add_node("technical_analysis", self.run_technical_analysis)
workflow.add_node("fundamental_analysis", self.run_fundamental_analysis)
workflow.add_node("sentiment_analysis", self.analyze_sentiment)
workflow.add_node("options_analysis", self.analyze_options)
workflow.add_node("portfolio_optimization", self.optimize_portfolio)
workflow.add_node("rag_research", self.search_documents)
workflow.add_node("react_reasoning", self.reason_about_data)
workflow.add_node("generate_report", self.create_final_report)
# Entry point
workflow.set_entry_point("collect_data")
# Define the flow - some parallel, some sequential
workflow.add_edge("collect_data", "technical_analysis")
workflow.add_edge("collect_data", "fundamental_analysis")
workflow.add_edge("collect_data", "sentiment_analysis")
# These can run in parallel
workflow.add_conditional_edges(
"collect_data",
self.should_run_options, # Only if options are relevant
{
"yes": "options_analysis",
"no": "rag_research"
}
)
# Everything feeds into reasoning
workflow.add_edge(["technical_analysis", "fundamental_analysis",
"sentiment_analysis", "options_analysis"],
"react_reasoning")
# Reasoning leads to report
workflow.add_edge("react_reasoning", "generate_report")
# End
workflow.add_edge("generate_report", END)
return workflow
def analyze_stock_comprehensive(self, ticker: str, investment_amount: float = 10000):
"""
This single function replaces what used to be an entire team's
worth of manual analysis.
"""
initial_state = {
"ticker": ticker,
"investment_amount": investment_amount,
"timestamp": datetime.now(),
"messages": [],
"market_data": {},
"technical_indicators": {},
"fundamental_metrics": {},
"sentiment_scores": {},
"options_data": {},
"portfolio_recommendation": {},
"documents_retrieved": [],
"reasoning_trace": [],
"final_report": "",
"errors": []
}
# Run the workflow
try:
result = self.app.invoke(initial_state)
return self._format_comprehensive_report(result)
except Exception as e:
# Graceful degradation
return self._run_basic_analysis(ticker, investment_amount)
class WorkflowNodes:
"""Collection of workflow nodes from actual project"""
def collect_market_data(self, state: AgentState) -> AgentState:
"""Node: Collect market data using tools"""
print("? Collecting market data...")
ticker = state["ticker"]
try:
# Use actual stock data tool from project
tool = self.tool_registry.get_tool("stock_data")
market_data = tool.execute(
ticker=ticker,
metrics=["price", "volume", "market_cap", "pe_ratio", "52_week_high", "52_week_low"]
)
state["market_data"] = market_data
# Add message to history
state["messages"].append(
AIMessage(content=f"Collected market data for {ticker}")
)
except Exception as e:
state["error"] = f"Failed to collect market data: {str(e)}"
state["market_data"] = {}
return state
Here is a screenshot from the example showing workflow analysis:
Production Considerations: From Tutorial to Trading Floor
This tutorial demonstrates core concepts, but let me be clear – production deployment in financial services requires significantly more rigor. Having deployed similar systems in regulated environments, here’s what you’ll need to consider:
The Reality of Production Deployment
Production financial systems require months of parallel running and validation. In my experience, you’ll need:
class ProductionValidation:
"""
Always run new systems parallel to existing ones
"""
def validate_against_legacy(self, ticker: str):
# Run both systems
legacy_result = self.legacy_system.analyze(ticker)
agent_result = self.agent_system.analyze(ticker)
# Compare results
discrepancies = self.compare_results(legacy_result, agent_result)
# Log everything for audit
self.audit_log.record({
"ticker": ticker,
"timestamp": datetime.now(),
"legacy": legacy_result,
"agent": agent_result,
"discrepancies": discrepancies,
"approved": len(discrepancies) == 0
})
# Require human review for discrepancies
if discrepancies:
return self.escalate_to_human(discrepancies)
return agent_result
Integrating Traditional Financial Algorithms
While this tutorial uses general-purpose LLMs, production systems should combine AI with proven financial algorithms:
class HybridAnalyzer:
"""
Combine traditional algorithms with AI reasoning
"""
def analyze_options(self, ticker: str, strike: float, expiry: str):
# Use traditional Black-Scholes for pricing
traditional_price = self.black_scholes_pricer.calculate(
ticker, strike, expiry
)
# Use AI for market context
ai_context = self.agent.analyze_market_conditions(ticker)
# Combine both
if ai_context["volatility_regime"] == "high":
# AI detected unusual conditions, adjust model
adjusted_price = traditional_price * (1 + ai_context["vol_adjustment"])
confidence = "low - unusual market conditions"
else:
adjusted_price = traditional_price
confidence = "high - normal market conditions"
return {
"model_price": traditional_price,
"adjusted_price": adjusted_price,
"confidence": confidence,
"reasoning": ai_context["reasoning"]
}
Fitness Functions for Financial Accuracy
Financial data cannot tolerate hallucinations. Implement strict validation:
class FinancialFitnessValidator:
"""
Reject hallucinated or impossible financial data
"""
def validate_metrics(self, ticker: str, metrics: Dict):
validations = {
"pe_ratio": lambda x: -100 < x < 1000,
"price": lambda x: x > 0,
"market_cap": lambda x: x > 0,
"dividend_yield": lambda x: 0 <= x <= 20,
"revenue_growth": lambda x: -100 < x < 200
}
for metric, validator in validations.items():
if metric in metrics:
value = metrics[metric]
if not validator(value):
raise ValueError(f"Invalid {metric}: {value} for {ticker}")
# Cross-validation
if "pe_ratio" in metrics and "earnings" in metrics:
calculated_pe = metrics["price"] / metrics["earnings"]
if abs(calculated_pe - metrics["pe_ratio"]) > 1:
raise ValueError("P/E ratio doesn't match price/earnings")
return True
Leverage Your Existing Data
If you have years of financial data in databases, you don’t need to start over. Use RAG to make it searchable:
# Convert your SQL database to vector-searchable documents
existing_data = sql_query("SELECT * FROM financial_reports")
rag_engine.add_documents([
{"content": row.text, "metadata": {"date": row.date, "ticker": row.ticker}}
for row in existing_data
])
Human-in-the-Loop
No matter how sophisticated your agents become, financial decisions affecting real money require human oversight. Build it in from day one:
Confidence thresholds that trigger human review
Clear audit trails showing agent reasoning
Easy override mechanisms
Gradual automation based on proven accuracy
class HumanInTheLoopWorkflow:
"""
Ensure human review for critical decisions
"""
def execute_trade_recommendation(self, recommendation: Dict):
# Auto-approve only for low-risk, small trades
if (recommendation["risk_score"] < 0.3 and
recommendation["amount"] < 10000):
return self.execute(recommendation)
# Require human approval for everything else
approval_request = {
"recommendation": recommendation,
"agent_reasoning": recommendation["reasoning_trace"],
"confidence": recommendation["confidence_score"],
"risk_assessment": self.assess_risks(recommendation)
}
# Send to human reviewer
human_decision = self.request_human_review(approval_request)
if human_decision["approved"]:
return self.execute(recommendation)
else:
self.log_rejection(human_decision["reason"])
Cost Management and Budget Controls
During development, Ollama gives you free local inference. In production, costs add up quickly so you need to build proper controls for calculating cost of analysis:
GPT-4: ~$30 per million tokens
Claude-3: ~$20 per million tokens
Local Llama: Free but needs GPU infrastructure
class CostController:
"""
Prevent runway costs in production
"""
def __init__(self, daily_budget: float = 100.0):
self.daily_budget = daily_budget
self.costs_today = 0.0
self.cost_per_token = {
"gpt-4": 0.00003, # $0.03 per 1K tokens
"claude-3": 0.00002,
"llama-local": 0.0 # Free but has compute cost
}
def check_budget(self, estimated_tokens: int, model: str):
estimated_cost = estimated_tokens * self.cost_per_token.get(model, 0)
if self.costs_today + estimated_cost > self.daily_budget:
# Switch to local model or cache
return "use_local_model"
return "proceed"
def track_usage(self, tokens_used: int, model: str):
cost = tokens_used * self.cost_per_token.get(model, 0)
self.costs_today += cost
# Alert if approaching limit
if self.costs_today > self.daily_budget * 0.8:
self.send_alert(f"80% of daily budget used: ${self.costs_today:.2f}")
Caching Is Essential
Caching is crucial for both performance and cost effectiveness when running expensive analysis using LLMs.
class CachedRAGEngine(RAGEngine):
"""
Caching reduced our costs by 70% and improved response time by 5x
"""
def __init__(self):
super().__init__()
self.cache = Redis(host='localhost', port=6379, db=0)
self.cache_ttl = 3600 # 1 hour for financial data
def retrieve_with_cache(self, query: str, k: int = 5):
# Create cache key from query
cache_key = f"rag:{hashlib.md5(query.encode()).hexdigest()}"
# Check cache first
cached = self.cache.get(cache_key)
if cached:
return json.loads(cached)
# If not cached, retrieve and cache
docs = self.vector_store.similarity_search(query, k=k)
# Cache the results
self.cache.setex(
cache_key,
self.cache_ttl,
json.dumps([doc.to_dict() for doc in docs])
)
return docs
Fallback Strategies
A Cascading Fallback can help execute a task using a sequence of operations, ordered from the most preferred (highest quality/cost) to the least preferred (lowest quality/safest default).
class ResilientAgent:
"""
Production agents need multiple fallback options
"""
def analyze_with_fallbacks(self, ticker: str):
strategies = [
("primary", self.run_full_analysis),
("fallback_1", self.run_simplified_analysis),
("fallback_2", self.run_basic_analysis),
("emergency", self.return_cached_or_default)
]
for strategy_name, strategy_func in strategies:
try:
result = strategy_func(ticker)
result["strategy_used"] = strategy_name
return result
except Exception as e:
logger.warning(f"Strategy {strategy_name} failed: {e}")
continue
return {"error": "All strategies failed", "ticker": ticker}
Observability and Monitoring
Track token usage, latency, accuracy, and costs immediately. What you don’t measure, you can’t improve.
class ObservableWorkflow:
"""
You need to know what your AI is doing in production
"""
def __init__(self):
self.metrics = PrometheusMetrics()
self.tracer = JaegerTracer()
def execute_with_observability(self, state: AgentState):
with self.tracer.start_span("workflow_execution") as span:
span.set_tag("ticker", state["ticker"])
# Track token usage
tokens_start = self.llm.get_num_tokens(state)
# Execute workflow
result = self.workflow.invoke(state)
# Record metrics
tokens_used = self.llm.get_num_tokens(result) - tokens_start
self.metrics.record_tokens(tokens_used)
self.metrics.record_latency(span.duration)
# Log for debugging
logger.info(f"Workflow completed", extra={
"ticker": state["ticker"],
"tokens": tokens_used,
"duration": span.duration,
"strategy": result.get("strategy_used", "primary")
})
return result
Closing Thoughts
This tutorial demonstrates how agentic AI transforms financial analysis from rigid pipelines to adaptive, thinking systems. The combination of ReAct reasoning, RAG grounding, tool use, and workflow orchestration creates capabilities that surpass traditional approaches in flexibility and ease of development.
Start Simple, Build Incrementally:
Week 1: Basic ReAct agent to understand reasoning loops
Week 2: Add tools for external capabilities
Week 3: Implement RAG to ground responses in real data
Week 4: Orchestrate with workflows
Develop everything locally with Ollama first – it’s free and private
The point of agentic AI is automation. Here’s the pragmatic approach:
Automate in Tiers:
Tier 1 (Fully Automated): Data collection, technical calculations, report generation
Instead of permanent human-in-the-loop, use RL to train agents that learn from feedback:
class ReinforcementLearningLoop:
"""
Gradually reduce human involvement through learning
"""
def ai_based_reinforcement(self, decision, outcome):
"""AI learns from market outcomes directly"""
# Did the prediction match reality?
reward = self.calculate_reward(decision, outcome)
if decision["action"] == "buy" and outcome["price_change"] > 0.02:
reward = 1.0 # Good decision
elif decision["action"] == "hold" and abs(outcome["price_change"]) < 0.01:
reward = 0.5 # Correct to avoid volatility
else:
reward = -0.5 # Poor decision
# Update agent weights/prompts based on reward
self.agent.update_policy(decision["context"], reward)
def human_feedback_learning(self, decision, human_override=None):
"""Learn from human corrections when they occur"""
if human_override:
# Human disagreed - strong learning signal
self.agent.record_correction(
agent_decision=decision,
human_decision=human_override,
weight=10.0 # Human feedback weighted heavily
)
else:
# Human agreed (implicitly by not overriding)
self.agent.reinforce_decision(decision, weight=1.0)
def adaptive_automation_threshold(self):
"""Dynamically adjust when human review is needed"""
recent_accuracy = self.get_recent_accuracy(days=30)
if recent_accuracy > 0.95:
self.confidence_threshold *= 0.9 # Require less human review
elif recent_accuracy < 0.85:
self.confidence_threshold *= 1.1 # Require more human review
return self.confidence_threshold
This approach reduces human involvement over time: use that feedback to train, gradually automate decisions where the agent consistently agrees with humans, and only escalate novel situations or low-confidence decisions.
Over the years, I have seen countless data breaches leaking private personal data of customers. For example, Equifax exposed 147 million Americans’ SSNs and birth dates; Facebook leaked 533 million users’ personal details; Yahoo lost 3 billion accounts. This risk of leaking personal data is not unique to large companies but most companies play security chicken. They bet on luck that we haven’t been breached yet, so we must be fine. In many cases, companies don’t even know what PII they have, where it lives, or who can access it.
Unrestrained Production Access
Here’s what I have seen in most companies where I worked: DevOps teams with unrestricted access to production databases “for debugging.” Support engineers who can browse any customer’s SSN, medical records, or financial data. That contractor from six months ago who still has production credentials. Engineers who can query any table, any field, anytime. I’ve witnessed the consequences firsthand:
Customer service reps browsing financial data of large customers “out of curiosity”
APIs that return PII data without proper authorization policies
Devops or support receives permanent permissions to access production data instead of time-bound or customer specific based on the underlying issue
Engineers accidentally logging credit card numbers in plaintext
This violates OWASP’s principle of least privilege—grant only the minimum access necessary. But there’s an even worse problem: most companies can’t even identify which fields contain PII. They often don’t have policies on how to protect different kind of PII data based on risks.
The Scale Problem
In modern architectures, manual PII identification is impossible:
Hundreds of microservices, each with dozens of data models
Tens of thousands of API endpoints
Constant schema evolution as teams ship daily
Our single customer proto had 84 fields—multiply that by hundreds of services
Traditional approaches—manual reviews, compliance audits, security questionnaires—can’t keep up. By the time you’ve reviewed everything, the schemas have already changed.
Enter Agentic AI: From 0% to 92% PII Detection
I have been applying AI assistants and agents to solve complex problems for a while and I have been thinking about how can we automatically detect PII? Not just obvious fields like “ssn” or “credit_card_number,” but the subtle ones—employee IDs that could be cross-referenced. I then built an AI-powered system that uses LangChain, LangGraph, and Vertex AI to scan every proto definition, identify PII patterns, and classify sensitivity levels. Though iterative development, I went from:
0% accuracy: Naive prompt (“find PII fields”)
45% accuracy: Basic rules without specificity
92%+ accuracy: Iterative prompt engineering with explicit field mappings
It’s not perfect, but it’s infinitely better than the nothing most companies have.
The Real Problem: It’s Not Just About Compliance
Let me share some uncomfortable truths about PII in modern systems:
The Public API Problem
We had list APIs returning customer data like this:
Someone with the API access could list all customers and capture their private data like ssn and date_of_birth.
The Internal Access Problem
One recurring issue I found with internal access is giving carte blanche access (often permanent) to devops environment or production database for debugging. In other cases, support team needed customer data for tickets. But did they need to see following PII data for all customers:
Social Security Numbers?
Medical records?
Credit card numbers?
Salary information?
Of course not. I saw often the list APIs return this PII data for all customers or calling GetAccount gave you everything without proper authorization policies.
The Compliance Nightmare
The government regulations like GDPR, CCPA, HIPAA, PCI-DSS have been growing but each has different rules about what constitutes PII, how it should be protected, and what happens if you leak it. Manual compliance checking is impossible at scale.
PlexRBAC – A comprehensive RBAC library for Java/Scala with dynamic role hierarchies
PlexRBACJS – JavaScript implementation with fine-grained permissions
SaaS_RBAC – Multi-tenant RBAC with organization-level isolation
These systems can enforce incredibly sophisticated access controls. They can handle role inheritance, permission delegation, contextual access rules. But here’s what I learned the hard way: RBAC is useless if you don’t know what data needs protection. First, you need to identify PII. Then you can enforce field-level authorization.
The Solution: AI-Powered PII Detection with Proto Annotations
Now our authorization system knows exactly what to protect!
Architecture: How It All Works
The system uses a multi-stage pipeline combining LangChain, LangGraph, and Vertex AI:
Technical Implementation Deep Dive
1. The LangGraph State Machine
I used LangGraph to create a deterministic workflow for PII detection:
from langgraph.graph import StateGraph, END
from typing import TypedDict, List, Optional, Dict, Any
from langchain_google_vertexai import ChatVertexAI
from pydantic import BaseModel, Field
class PiiDetectionState(TypedDict):
"""State for PII detection workflow"""
proto_file: str
proto_content: str
parsed_proto: Dict[str, Any]
llm_analysis: Optional[ProtoAnalysis]
final_report: Optional[PiiDetectionReport]
annotated_proto: Optional[str]
errors: List[str]
class PiiDetector:
def __init__(self, model_name: str = "gemini-2.0-flash-exp"):
self.llm = ChatVertexAI(
model_name=model_name,
project=PROJECT_ID,
location=LOCATION,
temperature=0.1, # Low temperature for consistent classification
max_output_tokens=8192,
request_timeout=120 # Handle large protos
)
self.workflow = self._create_workflow()
def _create_workflow(self) -> StateGraph:
"""Create the LangGraph workflow"""
workflow = StateGraph(PiiDetectionState)
# Add nodes for each step
workflow.add_node("parse_proto", self._parse_proto_node)
workflow.add_node("analyze_pii", self._analyze_pii_node)
workflow.add_node("generate_annotations", self._generate_annotations_node)
workflow.add_node("create_report", self._create_report_node)
# Define the flow
workflow.set_entry_point("parse_proto")
workflow.add_edge("parse_proto", "analyze_pii")
workflow.add_edge("analyze_pii", "generate_annotations")
workflow.add_edge("generate_annotations", "create_report")
workflow.add_edge("create_report", END)
return workflow.compile()
async def _analyze_pii_node(self, state: PiiDetectionState) -> PiiDetectionState:
"""Analyze PII using LLM with retry logic"""
max_retries = 3
retry_delay = 2
for attempt in range(max_retries):
try:
# Create structured output chain
analysis_chain = self.llm.with_structured_output(ProtoAnalysis)
# Create the analysis prompt
prompt = self.create_pii_detection_prompt(state['parsed_proto'])
# Get LLM analysis
result = await analysis_chain.ainvoke(prompt)
if result:
state['llm_analysis'] = result
return state
except Exception as e:
if attempt < max_retries - 1:
await asyncio.sleep(retry_delay)
continue
else:
state['errors'].append(f"LLM analysis failed: {str(e)}")
return state
2. Pydantic Models for Structured Output
I used Pydantic to ensure consistent, structured responses from the LLM:
class FieldAnalysis(BaseModel):
"""Analysis of a single proto field for PII"""
field_name: str = Field(description="The name of the field")
field_path: str = Field(description="Full path like Message.field")
contains_pii: bool = Field(description="Whether field contains PII")
sensitivity: str = Field(description="HIGH, MEDIUM, LOW, or PUBLIC")
pii_type: Optional[str] = Field(default=None, description="Type of PII")
reasoning: str = Field(description="Explanation for classification")
class MessageAnalysis(BaseModel):
"""Analysis of a proto message"""
message_name: str = Field(description="Name of the message")
overall_sensitivity: str = Field(description="Highest sensitivity in message")
fields: List[FieldAnalysis] = Field(description="Analysis of each field")
class ProtoAnalysis(BaseModel):
"""Complete analysis of a proto file"""
messages: List[MessageAnalysis] = Field(description="All analyzed messages")
services: List[ServiceAnalysis] = Field(default_factory=list)
summary: AnalysisSummary = Field(description="Overall statistics")
3. The Critical Prompt Engineering
I found that the key to accurate PII detection is in the prompt. Here’s a battle-tested prompt that achieves 92%+ accuracy after many trial and errors:
def create_pii_detection_prompt(self) -> str:
"""Create the prompt for PII detection"""
return """You are an expert in data privacy and PII detection.
Analyze the Protocol Buffer definition and identify ALL fields that contain PII.
STRICT Classification Rules - YOU MUST FOLLOW THESE EXACTLY:
1. HIGH Sensitivity (MAXIMUM PROTECTION REQUIRED):
ALWAYS classify these field names as HIGH:
- ssn, social_security_number ? HIGH + SSN
- tax_id, tin ? HIGH + TAX_ID
- passport_number, passport ? HIGH + PASSPORT
- drivers_license, driving_license ? HIGH + DRIVERS_LICENSE
- bank_account_number ? HIGH + BANK_ACCOUNT
- credit_card_number ? HIGH + CREDIT_CARD
- credit_card_cvv ? HIGH + CREDIT_CARD
- medical_record_number ? HIGH + MEDICAL_RECORD
- health_insurance_id ? HIGH + HEALTH_INSURANCE
- medical_conditions ? HIGH + MEDICAL_RECORD
- prescriptions ? HIGH + MEDICAL_RECORD
- password_hash, password ? HIGH + PASSWORD
- api_key ? HIGH + API_KEY
- salary, annual_income ? HIGH + null
2. MEDIUM Sensitivity:
- email, personal_email ? MEDIUM + EMAIL_PERSONAL
- phone, mobile_phone ? MEDIUM + PHONE_PERSONAL
- home_address ? MEDIUM + ADDRESS_HOME
- date_of_birth, dob ? MEDIUM + DATE_OF_BIRTH
- username ? MEDIUM + USERNAME
- ip_address ? MEDIUM + IP_ADDRESS
- device_id ? MEDIUM + DEVICE_ID
- geolocation (latitude, longitude) ? MEDIUM + null
3. LOW Sensitivity:
- first_name, last_name, middle_name ? LOW + NAME
- gender ? LOW + GENDER
- work_email ? LOW + EMAIL_WORK
- work_phone ? LOW + PHONE_WORK
- job_title ? LOW + null
- employer_name ? LOW + null
4. PUBLIC (non-PII):
- id (if system-generated)
- status, created_at, updated_at
- counts, totals, metrics
IMPORTANT: Analyze EVERY SINGLE FIELD. Do not skip any.
"""
3. Handling the Gotchas
During development, I faced several challenges that required creative solutions:
Challenge 1: Multi-line Proto Annotations
Proto files often have annotations spanning multiple lines:
def extract_annotations(self, lines: List[str]) -> Dict:
i = 0
while i < len(lines):
if '[' in lines[i]:
# Collect until we find ']'
annotation_text = lines[i]
j = i + 1
while j < len(lines) and '];' not in annotation_text:
annotation_text += ' ' + lines[j]
j += 1
# Now parse the complete annotation
self.parse_annotation(annotation_text)
i = j
else:
i += 1
Challenge 2: Context-Dependent Classification
A field named id could be:
PUBLIC if it’s a system-generated UUID
LOW if it’s a customer ID that could be used for lookups
MEDIUM if it’s an employee ID with PII implications
Solution: Consider the message context:
def classify_with_context(self, field_name: str, message_name: str) -> str:
if message_name in ['Customer', 'User', 'Account']:
if field_name == 'id':
return 'LOW' # Customer ID has some sensitivity
elif message_name in ['System', 'Config']:
if field_name == 'id':
return 'PUBLIC' # System IDs are not PII
return self.default_classification(field_name)
? 100% of HIGH sensitivity fields (SSNs, credit cards, medical records)
? 95% of MEDIUM sensitivity fields (personal emails, phone numbers, addresses)
? 85% of LOW sensitivity fields (names, work emails, job titles)
? 100% of PUBLIC fields (IDs, timestamps, enums)
Why 92.3% Accuracy Matters
Perfect HIGH Sensitivity Detection: The system caught 100% of the most critical PII – SSNs, credit cards, medical records. These are the fields that can destroy lives if leaked.
Conservative Classification: When uncertain, the system errs on the side of caution. It’s better to over-protect a field than to expose PII.
Human Review Still Needed: The 8% difference is where human expertise adds value. The AI does the heavy lifting, humans do the fine-tuning.
Continuous Improvement: Every correction teaches the system. Our accuracy improved from 0% to 45% to 92% through iterative refinement.
Integration with Field-Level Authorization
I also built a prototype for enforcing field-level authorization and masking PII data outside this project but here is a general approach for enforcement of PII protection policies and masking response fields:
// In your gRPC interceptor
func (i *AuthzInterceptor) UnaryInterceptor(
ctx context.Context,
req interface{},
info *grpc.UnaryServerInfo,
handler grpc.UnaryHandler,
) (interface{}, error) {
// Get user's roles and scopes
user := auth.UserFromContext(ctx)
// Check field-level permissions
response, err := handler(ctx, req)
if err != nil {
return nil, err
}
// Filter response based on PII annotations
filtered := i.filterResponse(response, user)
return filtered, nil
}
func (i *AuthzInterceptor) filterResponse(
response interface{},
user *auth.User,
) interface{} {
// Use reflection to check each field's annotation
v := reflect.ValueOf(response)
for i := 0; i < v.NumField(); i++ {
field := v.Type().Field(i)
// Get PII annotation from proto
sensitivity := getPIISensitivity(field)
// Check if user has permission
if !user.HasPermission(sensitivity) {
// Mask or remove the field
v.Field(i).Set(reflect.Zero(field.Type))
}
}
return response
}
Step 3: The Magic Moment
Here is an example response from an API with PII data that enforces proper PII data protection:
// Before: Everything exposed
{
"customer": {
"name": "John Doe",
"ssn": "123-45-6789", // They see this!
"credit_card": "4111-1111-1111-1111" // And this!
}
}
// After: Field-level filtering based on PII annotations
{
"customer": {
"name": "John Doe",
"ssn": "[REDACTED]", // Protected!
"credit_card": "[REDACTED]" // Protected!
}
}
CI/CD Integration: Catching PII Before Production
This tool can be easily integrated with CI/CD pipelines to identify PII data if proper annotations are missing:
# .github/workflows/pii-detection.yml
name: PII Detection Check
on:
pull_request:
paths:
- '**/*.proto'
jobs:
detect-pii:
runs-on: ubuntu-latest
steps:
- uses: actions/checkout@v3
- name: Set up Python
uses: actions/setup-python@v4
with:
python-version: '3.10'
- name: Install dependencies
run: |
pip install -r check-pii-automation/requirements.txt
- name: Detect PII in Proto Files
env:
GCP_PROJECT: ${{ secrets.GCP_PROJECT }}
run: |
cd check-pii-automation
# Scan all proto files
for proto in $(find ../api/proto -name "*.proto"); do
echo "Scanning $proto"
python pii_detector.py "$proto" \
--output "output/$(basename $proto)" \
--json "output/$(basename $proto .proto).json"
done
- name: Check for Unannotated PII
run: |
# Fail if HIGH sensitivity PII found without annotations
for report in check-pii-automation/output/*.json; do
high_pii=$(jq '.fields[] | select(.sensitivity == "HIGH" and .annotated == false)' $report)
if [ ! -z "$high_pii" ]; then
echo "? ERROR: Unannotated HIGH sensitivity PII detected!"
echo "$high_pii"
exit 1
fi
done
- name: Generate Security Report
if: always()
run: |
python check-pii-automation/generate_security_report.py \
--input output/ \
--output security_report.md
- name: Comment on PR
uses: actions/github-script@v6
with:
script: |
const fs = require('fs');
const report = fs.readFileSync('security_report.md', 'utf8');
github.rest.issues.createComment({
issue_number: context.issue.number,
owner: context.repo.owner,
repo: context.repo.repo,
body: report
});
Advanced Features: Learning and Adapting
1. Custom PII Patterns
As, every organization has unique PII, we can support custom patterns:
class ContextAwarePiiDetector:
def __init__(self):
self.context_rules = self.learn_from_codebase()
def learn_from_codebase(self):
"""Learn patterns from existing annotated protos"""
patterns = {}
# Scan all existing annotated protos
for proto_file in glob.glob("**/*.proto"):
annotations = self.extract_annotations(proto_file)
for field, annotation in annotations.items():
# Learn the pattern
if field not in patterns:
patterns[field] = []
patterns[field].append({
'context': self.get_message_context(field),
'sensitivity': annotation['sensitivity']
})
return patterns
def classify_with_learned_context(self, field_name: str, context: str):
"""Use learned patterns for classification"""
if field_name in self.context_rules:
# Find similar contexts
for rule in self.context_rules[field_name]:
if self.context_similarity(context, rule['context']) > 0.8:
return rule['sensitivity']
return self.default_classification(field_name)
3. Incremental Learning from Corrections
Also, we can apply a RLHF (Reinforcement learning from human feedback) based mechanism to learn from human corrects a classification:
def record_correction(self, field: str, ai_classification: str, human_correction: str):
"""Learn from human corrections"""
correction_record = {
'field': field,
'ai_said': ai_classification,
'human_said': human_correction,
'context': self.get_full_context(field),
'timestamp': datetime.now()
}
# Store in vector database for RAG
self.knowledge_base.add_correction(correction_record)
# Update prompt if pattern emerges
if self.count_similar_corrections(field) > 3:
self.update_classification_rules(field, human_correction)
Results: What We Achieved
Before the System
Hours of manual review for each proto change
No systematic way to track PII across services
Compliance audits were nightmares
After Implementation
Automated detection in under 30 seconds
Complete PII inventory across all services
Compliance reports generated automatically
92%+ accuracy in classification
Performance Optimization: From 0% to 92%
Above journey to 92% accuracy wasn’t straightforward. Here’s how it was improved:
Iteration 1: Generic Prompt (0% Accuracy)
# Initial naive approach
prompt = "Find PII fields in this proto and classify their sensitivity"
# Result: LLM returned None or generic responses
Iteration 2: Basic Rules (45% Accuracy)
# Added basic rules but not specific enough
prompt = """
Classify fields as:
- HIGH: Very sensitive data
- MEDIUM: Somewhat sensitive
- LOW: Less sensitive
"""
# Result: Everything classified as MEDIUM
Iteration 3: Explicit Field Mapping (92% Accuracy)
# The breakthrough: explicit field name patterns
prompt = """
STRICT Classification Rules - YOU MUST FOLLOW THESE EXACTLY:
1. HIGH Sensitivity:
ALWAYS classify these field names as HIGH:
- ssn, social_security_number ? HIGH + SSN
- credit_card_number ? HIGH + CREDIT_CARD
[... explicit mappings ...]
"""
# Result: 92.3% accuracy!
Key Performance Improvements
Retry Logic with Exponential Backoff
for attempt in range(max_retries):
try:
result = await self.llm.ainvoke(prompt)
if result:
return result
except RateLimitError:
delay = 2 ** attempt # 2, 4, 8 seconds
await asyncio.sleep(delay)
Request Batching for Multiple Files
async def batch_process(proto_files: List[Path]):
# Process in batches of 5 to avoid rate limits
batch_size = 5
for i in range(0, len(proto_files), batch_size):
batch = proto_files[i:i+batch_size]
tasks = [detect_pii(f) for f in batch]
results = await asyncio.gather(*tasks)
# Add delay between batches
await asyncio.sleep(2)
Don’t try to classify everything at once. Start with:
Government IDs (SSN, passport)
Financial data (credit cards, bank accounts)
Medical information
Authentication credentials
Get these right first, then expand.
2. False Positives Are Better Than False Negatives
We tuned for high recall (catching all PII) over precision. Why? It’s better to over-classify a field as sensitive than to leak an SSN.
3. Context Matters More Than Field Names
A field called data could be anything. Look at:
The message it’s in
Surrounding fields
Comments in the proto
How it’s used in code
4. Make Annotations Actionable
Don’t just mark fields as “sensitive”. Specify:
Exact sensitivity level (HIGH/MEDIUM/LOW)
PII type (SSN, CREDIT_CARD, etc.)
Required protections (encryption, masking, audit)
5. Integrate Early in Development
The best time to annotate PII is when the field is created, not after it’s in production. Make PII detection part of proto creation and API review process.
Getting Started
Here is how you can start with protecting your customers’ data:
Step 1: Install and Configure
# Clone the repository
git clone https://github.com/bhatti/todo-api-errors.git
cd todo-api-errors/check-pii-automation
# Set up Python environment
python -m venv venv
source venv/bin/activate
# Install dependencies
pip install -r requirements.txt
# Configure GCP
export GCP_PROJECT=your-project-id
export GCP_REGION=us-central1
# Authenticate with Google Cloud
gcloud auth application-default login
Step 2: Run Your First Scan
# Scan a proto file
python pii_detector.py path/to/your/file.proto \
--output annotated.proto \
--json report.json
# Review the report
cat report.json | jq '.fields[] | select(.sensitivity == "HIGH")'
Step 3: Real-World Example
Here’s a complete example using our test proto:
# 1. Scan the proto without annotations
python pii_detector.py ../api/proto/pii/v1/account_without_annotations.proto \
--output output/account_annotated.proto \
--json output/report.json
# 2. View the detection summary
echo "=== PII Detection Summary ==="
cat output/report.json | jq '{
total_fields: .total_fields,
pii_detected: .pii_fields,
high_sensitivity: [.fields[] | select(.sensitivity == "HIGH") | .field_path],
accuracy: "\(.pii_fields) / \(.total_fields) = \((.pii_fields / .total_fields * 100 | floor))%"
}'
# 3. Compare with reference implementation
python test_pii_detection.py
# 4. View the annotated proto
head -50 output/account_annotated.proto
Add the GitHub Action above to your repository. Start with warnings, then move to blocking deployments.
Step 5: Implement Field-Level Authorization
Use the annotations to enforce access control in your services. Start with the highest sensitivity fields.
Step 6: Monitor and Improve
Track false positives/negatives. Update custom rules. Share learnings with your team.
Conclusion: Privacy as Code
I have learned that manual API reviews are insufficient to evaluate risks of sensitive field when dealing with hundreds of services. Also, this responsibility can’t all be delegated to developers as it requires collaboration and feedback from security, legal and product teams. We need tooling and automated processes that understand and protect PII automatically. Every new field, every API change, every refactor is a chance for PII to leak. But with AI-powered detection, we can make privacy protection as automatic as running tests. The system we built isn’t perfect – 92% accuracy means we still miss 8% of PII. But it’s infinitely better than the 0% we were catching before.
Back in 1974, physicist Richard Feynman gave a graduation speech at Caltech about something he called “cargo cult science.” He told a story about islanders in the South Pacific who, after World War II, built fake airstrips and control towers out of bamboo. They’d seen cargo planes land during the war and figured if they recreated what they saw—runways, headsets, wooden antennas—the planes would come back with supplies. They copied the appearance but missed the substance. The planes never came. Feynman used this to describe bad research—studies that look scientific on the surface but lack real rigor. Researchers going through the motions without understanding what makes science actually work.
Software engineering does the exact same thing. I’ve been doing this long enough to see the pattern repeat everywhere: teams adopt tools and practices because that’s what successful companies use, without asking if it makes sense for them. Google uses monorepos? We need a monorepo. Amazon uses microservices? Time to split our monolith. Kubernetes is what “real” companies use? Better start writing YAML.
In my previous post, I wrote about how layers of abstraction have made software too complex. This post is about a related problem: we’re not just dealing with necessary complexity—we’re making things worse by cargo culting what other companies do. We build the bamboo control towers and wonder why the planes don’t land. This is cargo cult software development, and I am sharing what I’ve learned here.
Executive Stack Envy
Executives suffer from massive stack envy. The executive reads about scalability of Kafka so suddenly we need Kafka. Never mind that we already have RabbitMQ and IBM MQSeries running just fine. Then another executive decides Google Pub/Sub is “more cloud native.” Now we have four message queues. Nobody provides guidance on how to use any of them. I watched teams struggle with poisonous messages for weeks. They’d never heard of dead letter queues.
On the database side, it’s the same pattern. In the early 2000s, I saw everyone rushed to adopt object-oriented databases like Versant and ObjectStore but they were proved to be short lived. At one company, leadership bet everything on a graph database. When customers came, scalability collapsed. We spent the next six years migrating away—not because migration was inherently hard, but because engineers built an overly complex migration architecture. Classic pattern: complexity for promotion, not for solving problems.
Meanwhile, at another company: we already had CloudSQL. Some teams moved to AlloyDB. Then an executive discovered Google Spanner. Now we have three databases. Nobody can explain why. Nobody knows which service uses which. At one company, we spent five years upgrading everything to gRPC. Created 500+ services. Nobody performance tested any of it until a large customer signed up. That’s when we discovered the overhead—gRPC serialization, microservice hops, network calls—it all compounded.
The Sales Fiction
Sales promised four nines availability, sub-100ms latency, multi-region DR. “Netflix-like reliability.” Reality? Some teams couldn’t properly scale within a single region. The DR plan was a wiki page nobody tested. Nobody understood the dependencies.
At one company, leadership decided we needed a monorepo “because Google uses one.” They’d read about how Google Chrome’s massive codebase benefited from having all dependencies in one place. What they missed was that Google has hundreds of engineers dedicated solely to tooling support.
Our reality? All services—different languages, different teams—got crammed into one repository. The promise was better code sharing. The result was forced dependency alignment that broke builds constantly. A simple package update in one service would cascade failures across unrelated services. Build times ballooned to over an hour and engineers spent endless hours fighting the build system.
The real kicker: most of our services only needed to communicate through APIs. We could have used service interfaces, but instead we created compile-time dependencies where none should have existed. At my time at Amazon, we handled shared code with live version dependencies that would trigger builds only when actually affected. There are alternatives—we just didn’t explore them.
Blaze Builds and the Complexity Tax
The same organization then adopted Bazel (Google’s open-sourced version of Blaze). Again, the reasoning was “Google uses it, so it must be good.” Nobody asked whether our small engineering team needed the same build system as Google’s tens of thousands of engineers. Nobody calculated the learning curve cost. Nobody questioned whether our relatively simple microservices needed this level of build sophistication. The complexity tax was immediate and brutal. New engineers took weeks to understand the build system. Simple tasks became complicated. Debugging build failures required specialized knowledge that only a few people possessed. We’d traded a problem we didn’t have for a problem we couldn’t solve.
The Agile Cargo Cult
I’ve watched dozens of companies claim they’re “doing Agile” while missing every principle that makes Agile work. They hold standups, run sprints, track velocity—all the visible rituals. The results? Same problems as before, now with more meetings.
Standups That Aren’t
At one company, “daily standups” lasted 30 minutes. Each developer gave a detailed status report to their manager. Everyone else mentally checked out waiting their turn. Nobody coordinated. It was a status meeting wearing an Agile costume.
The Velocity Obsession
Another place tracked velocity religiously. Management expected consistent story points every sprint. When velocity dropped, teams faced uncomfortable questions about “productivity.” Solution? Inflate estimates. Break large stories into tiny ones. The velocity chart looked great. The actual delivery? Garbage. Research shows teams game metrics when measured on internal numbers instead of customer value.
Product Owners Who Aren’t
I’ve seen “Product Owners” who were actually project managers in disguise. They translated business requirements into user stories. Never talked to customers. Couldn’t make product decisions. Spent their time tracking progress and managing stakeholders. Without real product ownership, teams build features nobody needs. The Agile ceremony continues, the product fails.
Copying Without Understanding
The pattern is always the same: read about Spotify’s squads and tribes, implement the structure, wonder why it doesn’t work. They copied the org chart but missed the culture of autonomy, the customer focus, the experimental mindset. Or they send everyone to a two-day Scrum certification. Teams return with a checklist of activities—sprint planning, retrospectives, story points—but no understanding of why these matter. They know the mechanics, not the principles.
Why It Fails
The academic research identified the problem: teams follow practices without understanding the underlying principles. They cancel meetings when the Scrum Master is absent (because they’re used to managers running meetings). They bring irrelevant information to standups (because they think it’s about reporting, not coordinating). They wait for task assignments instead of self-organizing (because autonomy is scary). Leadership mandates “Agile transformation” without changing how they make decisions or interact with teams. They want faster delivery and better predictability—the outcomes—without the cultural changes that enable those outcomes.
The Real Problem
True Agile requires empowering teams to make decisions. Most organizations aren’t ready for that. They create pseudo-empowerment: teams can choose how to implement predetermined requirements. They can organize their work as long as they hit the deadlines. They can self-manage within tightly controlled boundaries.
Platform Engineering and the Infrastructure Complexity Trap
Docker and Kubernetes are powerful tools. They solve real problems. But here’s what nobody talks about: they add massive complexity, and most organizations don’t have the expertise to handle it. I watched small startup adopt Kubernetes. They could have run on services directly EC2 instances. Instead, they had a three-node cluster, service mesh, ingress controllers, the whole nine yards.
Platform Teams That Made Things Worse
Platform engineering was supposed to make developers’ lives easier. Instead, I’ve watched platform teams split by technology—the Kubernetes team, the Terraform team, the CI/CD team—each making things harder. The pattern was consistent: they’d either expose raw complexity or build leaky abstractions that constrained without simplifying. One platform team exposed raw Kubernetes YAML to developers, expecting them to become Kubernetes experts overnight.
The fundamental problem? Everyone had to understand Kubernetes, Istio, Terraform, and whatever else the platform team used. The abstractions leaked everywhere. And the platform teams didn’t understand what the application teams were actually building—they’d never worked with the gRPC services they were supposed to support. The result was bizarre workarounds. One team found Istio was killing their long-running database queries during deployments. Their solution? Set terminationDrainDuration to 2 hours. They weren’t experts in Istio, so instead of fixing the real problem—properly implementing graceful shutdown with query cancellation—they just cranked the timeout to an absurd value.
When something broke, nobody could tell if it was the app or the platform. Teams burned days or weeks debugging through countless layers of abstraction.
The Microservices Cargo Cult
Every company wants microservices now. It’s modern, it’s scalable, it’s what Amazon does. I’ve watched this pattern repeat across multiple companies. They split monoliths into microservices and get all the complexity without any of the benefits. Let me tell you what I’ve seen go wrong.
Idempotency? Never Heard of It
At one company, many services didn’t check for duplicate requests resulting in double charges or incorrect balances. Classic non-atomic check-then-act: check if transaction exists, then create it—two separate database calls. Race condition waiting to happen. Two requests hit simultaneously, both check, both see nothing, both charge the customer. Same pattern everywhere I looked. I wrote about these antipatterns in How Duplicate Detection Became the Dangerous Impostor of True Idempotency.
The Pub/Sub Disaster
At another place, Google Pub/Sub had an outage. Publishers timed out, retried their events. When Pub/Sub recovered, both original and retry got delivered—with different event IDs. Duplicate events everywhere. Customer updates applied twice. Transactions processed multiple times. The Events Service was built for speed, not deduplication. Each team handled duplicates their own way. Many didn’t handle them at all. We spent days manually finding data drift and fixing it. No automated reconciliation, no detection—just manual cleanup after the fact.
No Transaction Boundaries
Simple database joins became seven network calls across services. Create order -> charge payment -> allocate inventory -> update customer -> send notification. Each call a potential failure point. Something fails midway? Partial state scattered across services. No distributed transactions, no sagas, just hope. I explained proper implementation of transaction boundaries in Transaction Boundaries: The Foundation of Reliable Systems.
Missing the Basics
But the real problem was simpler than that. I’ve seen services deployed without:
Proper health checks. Teams reused the same shallow check for liveness and readiness. Kubernetes routed traffic to pods that weren’t ready.
Monitoring and alerts. Services ran in production with no alarms. We’d find out about issues from customer complaints.
Dependency testing. Nobody load tested their dependencies. Scaling up meant overwhelming downstream services that couldn’t handle the traffic.
Circuit breakers. One slow service took down everything calling it. No timeouts, no fallbacks.
Graceful shutdown. Deployments dropped requests because nobody coordinated shutdown timeouts between application, Istio, and Kubernetes.
Distributed tracing. Logs scattered across services with no correlation IDs. Debugging meant manually piecing together what happened from nine different log sources.
Backup and recovery. Nobody tested their disaster recovery until disaster struck.
The GRPC Disaster Nobody Talks About
Another organization went all-in on GRPC for microservices. The pitch was compelling: better performance, strongly typed interfaces, streaming support. What could go wrong? Engineers copied GRPC examples without understanding connection management. Nobody grasped how GRPC’s HTTP/2 persistent connections work or the purpose of connection pooling. Services would start before the Istio sidecar was ready. Application tries an outbound GRPC call—ECONNREFUSED. Pod crashes, Kubernetes restarts it, repeat. The fix was one annotation nobody added: sidecar.istio.io/holdApplicationUntilProxyStarts: "true".
Shutdown was worse. Kubernetes sends SIGTERM, Istio sidecar shuts down immediately, application still draining requests. Dropped connections everywhere. The fix required three perfectly coordinated timeout values:
Application shutdown: 40s
Istio drain: 45s
Kubernetes grace period: 65s
Load balancing was a disaster. HTTP/2 creates one persistent connection and multiplexes all requests through it. Kubernetes’ round-robin load balancing works at the connection level. Result? All traffic to whichever pod got the first connection. Health checks were pure theater. Teams copied the same probe definition for both liveness and readiness. Even distinct probes were “shallow”—a database ping that doesn’t validate the service can actually function. Services marked “ready” that immediately 500’d on real traffic.
The HTTP-to-GRPC proxy layer? Headers weren’t properly mapped between protocols. Auth tokens got lost in translation. Customer-facing errors were cryptic GRPC status codes instead of meaningful messages. I ended up writing detailed guides on GRPC load balancing in Kubernetes, header mapping, and error handling. These should have been understood before adoption, not discovered through production failures.
The Caching Silver Bullet That Shot Us in the Foot
“Just add caching” became the answer to every performance problem. Database slow? Add Redis. API slow? Add CDN. At one company, platform engineering initially didn’t support Redis. So application teams spun up their own clusters. No standards. No coordination. Just dozens of Redis instances scattered across environments, each configured differently. Eventually, platform engineering released Terraform modules for Redis. Problem solved, right? Wrong. They provided the infrastructure with almost no guidance on how to use it properly. Teams treated it as a magic performance button.
What Actually Happened
Teams started caching without writing fault-tolerant code. One service had Redis connection timeouts set to 30 seconds. When Redis became unavailable, every request waited 30 seconds to fail. The cascading failures took down the entire application. Another team cached massive objects—full customer balances, assets, events, transactions, etc. Their cache hydration on startup took 10 minutes. Every deploy meant 10 minutes of degraded performance while the cache warmed up. Auto-scaling was useless because new pods weren’t ready to serve traffic. Nobody calculated cache invalidation complexity. Nobody considered memory costs. Nobody thought about cache coherency across regions.
BiModal Hell
The worst part? BiModal logic. Cache hit? Fast. Cache miss? Slow. Cold cache? Everything’s slow until it warms up. This obscured real problems—race conditions, database failures—because performance was unpredictable. Was it slow because of a cache miss or because the database was dying? Nobody knew. I’ve documented more of these war stories—cache poisoning, thundering herds, memory leaks, security issues with unencrypted credentials. The pattern was always the same: reach for caching before understanding the actual problem.
Infrastructure as Code: The Code That Wasn’t
“We do infrastructure as code” was the proud claim at multiple companies I’ve worked at. The reality? Terraform or AWS CloudFormation templates existed, sure. But some of the infrastructure was still being created through admin console, modified through scripts, and updated through a mix of manual processes and half-automated pipelines. The worst part was the configuration drift. Each environment—dev, staging, production—was supposedly identical. In reality, they’d diverged so much that bugs would appear in production that were impossible to reproduce in staging. The CI/CD pipelines for application code ran smoothly, but infrastructure changes were often applied manually or through separate automation. Database migrations lived completely outside the deployment pipeline, making rollbacks impossible. One failed migration meant hours of manual recovery.
The Platform Engineering “Solution” That Made Everything Worse
At one platform engineering org, they provided reusable Terraform modules but required each application team to maintain their own configs for every environment. The modules covered maybe 50% of what teams actually needed, so teams built custom solutions, and created snowflakes. The whole point—consistency and maintainability—was lost.
The brilliant solution? A manager built a UI to abstract away Terraform entirely. Just click some buttons!It was a masterclass in leaky abstractions. You couldn’t do anything sophisticated, but when it broke, you had to understand both the UI’s logic AND the generated Terraform to debug it. The UI became a lowest-common-denominator wrapper inadequate for actual needs. I’ve seen AWS CDK provide excellent abstraction over CloudFormation—real programming language power with the ability to drop down to raw resources when needed. That’s proper abstraction: empowering developers, not constraining them. This UI understood nothing about developer needs. It was cargo cult thinking: “Google has internal tools, so we should build internal tools!” I’ve learned: engineers prefer CLI or API approaches to tooling. It’s scriptable, automatable, and fits into workflows. But executives see broken tooling and think the solution is slapping a UI on it—lipstick on a pig. It never works.
The Config Drift Nightmare
We claimed to practice “config as code.” Reality? Our config was scattered across:
Git repos (three different ones)
AWS Parameter Store
Environment variables set manually
Hardcoded in Docker images
Some in a random database table
Feature flags in LaunchDarkly
Secrets in three different secret managers
Dev environment had different configs than staging, which was different from production. Not by design—by entropy. Each environment had been hand-tweaked over years by different engineers solving different problems. Infrastructure changes were applied manually to environments through separate processes, completely bypassing synchronization with application code. Database migrations lived in four different directory structures across services, no standard anywhere.
Feature flags were even worse. Some teams used LaunchDarkly, others ZooKeeper, none integrated with CI/CD. Instead of templating configs or inheriting from a base, we maintained duplicate configs for every single environment. Copy-paste errors meant production regularly went down from missing or wrong values.
Feature Flags: When the Safety Net Becomes a Trap
I have seen companies buy expensive solutions like LaunchDarkly but fail to provide proper governance and standards. Google’s outage showed exactly what happens: a new code path protected by a feature flag went untested. When enabled, a nil pointer exception took down their entire service globally. The code had no error handling. The flag defaulted to ON. Nobody tested the actual conditions that would trigger the new path. I’ve seen the same pattern repeatedly. Teams deploy code behind flags, flip them on in production, and discover the code crashes. The flag was supposed to be the safety mechanism—it became the detonator. Following are a few common issues related to feature flags that I have observed:
No Integration
Flag changes weren’t integrated with our deployment pipeline. We treated them as configuration, not code. When problems hit, we couldn’t roll back cleanly. We’d deploy old code with new flag states, creating entirely new failure modes. No canary releases for flags. Teams would flip a flag for 100% of traffic instantly. No phased rollout. No monitoring the impact first. Just flip it and hope.
Misuse Everywhere
Teams used flags for everything: API endpoints, timeout values, customer tier logic. The flag system became a distributed configuration database. Nobody planned for LaunchDarkly being unavailable.
I’ve documented these antipatterns extensively—inadequate testing, no peer review, missing monitoring, zombie flags that never get removed. The pattern is always the same: treat flags as toggles instead of critical infrastructure that needs the same rigor as code.
The Observability Theater
At one company, they had a dedicated observability team monitoring hundreds of services across tens of thousands of endpoints. Sounds like the right approach, doesn’t it? The reality was they couldn’t actually monitor at that scale, so they defaulted to basic liveness checks. Is the service responding with 200 OK? Great, it’s “monitored.” We didn’t have synthetic health probes so customers found these issues before the monitoring did. Support tickets were our most reliable monitoring system.
Each service needed specific SLOs, custom metrics, detailed endpoint monitoring. Instead, we got generic dashboards and alerts that fired based on a single health check for all operations of a service. The solution was obvious: delegate monitoring ownership to service teams while the platform team provides tools and standards.
The Security Theater Performance
We had SOC2 compliance, which sales loved to tout. Reality? Internal ops and support had full access to customer data—SSNs, DOBs, government IDs—with zero guardrails and no auditing. I saw list APIs returned everything including SSNs, dates of birth, driver’s license numbers—all in the response. No field-level authorization. Teams didn’t understand authentication vs authorization. OAuth? Refresh tokens? “Too complicated.” They’d issue JWT tokens with 12-24 hour expiration. Session hijacking waiting to happen. Some teams built custom authorization solutions. Added 500ms latency to every request because they weren’t properly integrated with data sources. Overly complex permission systems that nobody understood. When they inevitably broke, services went down.
The Chicken Game
Most companies play security chicken. Bet on luck rather than investment. “We haven’t been breached yet, so we must be fine.” Until they’re not. The principle of least privilege? Never heard of it. I saw everyone in Devops teams gets admin access because it’s easier than managing permissions properly.
AI Makes It Worse
With AI, security got even sloppier. I’ve seen agentic AI code that completely bypasses authorization. The AI has credentials, the AI can do anything. No concept of user context or permissions. The Salesloft breach showed exactly what happens: their AI chatbot stored authentication tokens for hundreds of services—Salesforce, Slack, Google Workspace, AWS, Azure, OpenAI. Attackers stole them all. One breach, access to everything. Standards like MCP (Model Context Protocol) aren’t designed with security in mind. They give companies a false sense of security while creating massive attack surfaces. AI agents with broad access, minimal auditing, no principle of least privilege.
Training vs Reality
But we had mandatory security training! Eight hours of videos about not clicking phishing links. Nothing about secure coding, secret management, access control, or proper authentication. Nothing about OAuth flows, token rotation, or session management. We’d pass audits because we had the right documents. Incident response plans nobody tested. Encryption “at rest” that was just AWS defaults we never configured.
The On-Call Horror Show
Let me tell you about the most broken on-call setup I’ve seen. The PagerDuty escalation went: Engineer -> Head of Engineering. That’s it. No team lead, no manager, just straight from IC to executive.
The Escalation Disaster
New managers? Not in the escalation chain. Senior engineers? Excluded. Other teams skipped layers entirely—engineer to director, bypassing everyone in between. When reorganizations happened, escalation paths didn’t get updated. People left, new people joined, and PagerDuty kept paging people who’d moved to different teams or left the company entirely. Nobody had proper governance. No automated compliance checks. Escalation policies drifted until they bore no resemblance to the org chart.
Missing the Basics
Many services had inadequate SLOs and alerts defined. Teams would discover outages from customer complaints because there was no monitoring. The services that did have alerts? Engineers ignored them. Lower environment alerts went to Slack channels nobody read. Critical errors showed up in staging logs, but no one looked. The same errors would hit production weeks later, and everyone acted surprised. “This never happened before!” It did. In dev. In staging. Nobody checked.
Runbooks and Shadowing
I have seen many teams didn’t keep runbooks up to date. New engineers got added to on-call rotations without shadowing experienced people. One person knew how to handle each class of incident. When they were unavailable, everyone else fumbled through it.
We had the tool the “best” companies used, so we thought we must be doing it right.
The Remote Work Hypocrisy
I’ve been working remotely since 2015, long before COVID made it mainstream. When everyone went remote in 2020, I thought finally companies understood that location doesn’t determine productivity. Then came the RTO (Return to Office) mandates. CEOs talked about “collaboration” and “culture” while most team members were distributed across offices anyway. Having 2 out of 10 team members in the same office doesn’t create collaboration—it creates resentment.
I watched talented engineers leave rather than relocate. Companies used RTO as voluntary layoffs, losing their best people who had options. The cargo cult here? Copying each other’s RTO policies without examining their own situations.
Startups with twenty people and no proper office facilities demanded RTO because big tech was doing it. They had no data on productivity impact, no plan for making office time valuable, just blind imitation of companies with completely different contexts.
The AI Gold Rush
The latest cargo cult is AI adoption. CEOs mandate “AI integration” without thinking through actual use cases. I’ve watched this play out repeatedly.
The Numbers Don’t Lie
95% of AI pilots fail at large companies. McKinsey found 42% of companies using generative AI abandoned projects with “no significant bottom line impact.” But executives already got their stock bumps and bonuses before anyone noticed.
What Actually Fails
I’ve seen companies roll out AI tools with zero training. No prompt engineering guidance. No standardized tools—just a chaotic mess of ChatGPT, Claude, Copilot, whatever people found online. No policies. No metrics. Result? People tried it, got mediocre results, concluded AI was overhyped. The technology wasn’t the problem—the deployment was. Budget allocation is backwards. Companies spend 50%+ on flashy sales and marketing AI while back-office automation delivers the highest ROI. Why? Investors notice the flashy stuff.
The Code Quality Disaster
Here’s what nobody talks about: AI is producing mountains of shitty code. Most teams haven’t updated their SDLC to account for AI-generated code. Senior engineers succeed with AI; junior engineers don’t. Why? Because writing code was never the bottleneck—design and architecture are. You need skill to write proper prompts and critically review output. I’ve used Copilot since before ChatGPT, then Claude, Cursor, and a dozen others. They all have the same problems: limited context windows mean they ignore existing code. They produce syntactically correct code that’s architecturally wrong.
I’ve been using Claude Code extensively. Even with detailed plans and design docs, long sessions lose track of what was discussed. Claude thinks something is already implemented when it isn’t. Or ignores requirements from earlier in the conversation. The context window limitation is fundamental.
Cargo Cult Adoption
I’ve worked at companies where the CEO mandated AI adoption without defining problems to solve. People got promoted for claiming “AI adoption” with useless demos. Hackathon demos are great for learning—actual production integration is completely different. Teams write poor abstractions instead of using battle-tested frameworks like LangChain and LangGraph. They forget to sanitize inputs when using CrewAI. They deploy agents without proper context engineering, memory architecture, or governance.
At one company I worked at, we deployed AI agents without proper permission boundaries—no safeguards to ensure different users got different answers based on their access levels. The Salesforce breach showed what happens when you skip this step. Companies were reusing the same auth tokens in AI prompts and real service calls. No separation between what the AI could access and what the user should see.
Start narrow and deep—one specific problem done well
Focus on workflow integration, not flashy features
Actually train people on how to use the tools
Define metrics before deployment
The Productivity Theater
Companies announce layoffs and credit AI, but the details rarely add up. IBM’s CEO claimed AI replaced HR workers—viral posts said 8,000 jobs. Reality? About 200 people, and IBM’s total headcount actually increased. Klarna was more honest. Their CEO publicly stated AI helped shrink their workforce 40%—from 5,527 to 3,422 employees. But here’s the twist: they’re now hiring humans back because AI-driven customer service quality tanked. Builder.ai became a $1.5 billion unicorn claiming their AI “Natasha” automated coding. Turned out it was 700 Indian developers manually writing code while pretending to be AI. The company filed for bankruptcy in May 2025 after exposing not just the fake AI, but $220 million in fake revenue through accounting fraud. Founders had already stepped down.
Why This Is Dangerous
Unlike previous tech hype, AI actually works for narrow tasks. That success gets extrapolated into capabilities that don’t exist. As ACM notes about cargo cult AI, we’re mistaking correlation for causation, statistical patterns for understanding. AI can’t establish causality. It can’t reason from first principles. It can’t ask “why.” These aren’t bugs—they’re fundamental limitations of current approaches. The most successful AI deployments treat it as a tool requiring proper infrastructure: context management, semantic layers, memory architecture, governance. The 95% that fail skip all of this and wonder why their chatbot doesn’t work.
Breaking Free from the Cult
After years of watching this pattern, I’ve learned to recognize the warning signs:
The Name Drop: “Google/Amazon/Netflix does it this way” The Presentation: Slick slides, no substance The Resistance: Questioning is discouraged The Metrics: Activity over outcomes The Evangelists: True believers who’ve never seen it fail
The antidote is simple but not easy:
Ask Why: Not just why others do it, but why you should
Start Small: Pilot programs reveal problems before they metastasize
Measure Impact: Real metrics, not vanity metrics
Listen to Skeptics: They often see what evangelists miss
Accept Failure: Admitting mistakes early is cheaper than denying them
The Truth About Cargo Cult Culture
After living through all this, I’ve realized cargo cult software engineering isn’t random. It’s systematic. It starts at the top with executives who believe that imitating success is the same as achieving it. They hire from big tech not for expertise, but for credibility. “We have ex-Google engineers!” becomes the pitch, even if those engineers were junior PMs who never touched the systems they’re now supposed to recreate.
These executives enable sales and marketing to sell fiction. “Fake it till you make it” becomes company culture. Engineering bears the burden of making lies true, burning out in the process. The engineers who point out that the emperor has no clothes get labeled as “not team players.” The saddest part? Some of these companies could have been successful with honest, appropriate technology choices. But they chose cosplay over reality, form over function, complexity over simplicity.
The Way Out
I’ve learned to spot these situations in interviews now. When they brag about their tech stack before mentioning what problem they solve, I run. When they name-drop companies instead of explaining their architecture, I run. When they say “we’re the Uber of X” or “we’re building the next Google,” I run fast.
The antidote isn’t just asking “why” – it’s demanding proof. Show me the metrics that prove Kubernetes saves you money. Demonstrate that microservices made you faster. Prove that your observability actually prevents outages. Most can’t, because they never measured before and after. They just assumed newer meant better, complex meant sophisticated, and copying meant competing.
Your context is not Google’s context. Your problems are not Amazon’s problems. And that’s okay. Solve your actual problems with boring, appropriate technology. Your customers don’t care if you use Kubernetes or Kafka or whatever this week’s hot technology is. They care if your shit works. Stop building bamboo airports. Start shipping working software.
I’ve been in software development for decades, and if there’s one lesson that’s been burned into my memory through countless production incidents, it’s this: innocuous-looking API changes have an uncanny ability to break everything. You’re getting alerts—an API change that sailed through testing is breaking production. Customer support is calling. You’re coordinating an emergency rollback, wondering how your tests missed this entirely.
The Problem We Keep Facing
Throughout my career, I’ve watched teams struggle with the same challenge: API evolution shouldn’t be a game of Russian roulette. Yet “safe” changes repeatedly pass tests only to break production. Unit testing doesn’t catch the subtle semantic changes that break client integrations. For years, I’ve been building tools to solve this. I created PlexMockServices for API mocking, then evolved it into api-mock-service with full mock and contract testing support. These tools have saved us from many production incidents. I have also written about various testing methodologies for validating APIs such as:
When gRPC and Protocol Buffers arrived, I thought we’d finally solved it. Tools like Buf excel at catching wire-level protocol changes—remove a field, Buf catches it. But here’s what I discovered: Buf and similar tools only see part of the picture.
The Blind Spots
Traditional static analysis tools understand syntax but not semantics. They catch structural changes but miss:
Fields made required through validation rules—wire-compatible, but every client fails
Fields that were “always” populated until you made them conditional
Error messages that clients parse with regex
Sort orders that changed, breaking customer dashboards
Default values that shifted behavior
With enough users, all observable behaviors will be depended upon—that’s Hyrum’s Law. The challenge isn’t just detecting changes; it’s understanding their impact from every consumer’s perspective.
Enter Agentic AI
Over the past year, I’ve been experimenting with combining static analysis tools like Buf with the contextual understanding of Large Language Models. Not to replace traditional tools, but to augment them—to catch what they structurally cannot see. In this blog, I’ll show you how to build an intelligent API guardian using LangChain and LangGraph—an agentic AI system that:
Orchestrates multiple tools (Git, Buf, LLMs) in coordinated workflows
Understands not just what changed, but what it means
Catches both wire-level and semantic breaking changes
Explains why something breaks and how to fix it
Makes autonomous deployment decisions based on comprehensive analysis
Let me show you how we built this system and how you can implement it for your APIs. Those emergency customer calls about broken integrations might just become a thing of the past.
Architecture Overview: The Intelligent Pipeline
The key insight behind this approach is that no single tool can catch all breaking changes. Static analyzers like Buf excel at structural validation but can’t reason about semantics. LLMs understand context and business logic but lack the deterministic guarantees of rule-based systems. The solution? Combine them in an orchestrated pipeline where each component contributes its strengths.
What I’ve built is an intelligent pipeline that layers multiple detection strategies:
Buf provides fast, deterministic detection of wire-level protocol violations
LangGraph orchestrates a stateful workflow that coordinates all the analysis steps
LangChain manages the LLM interactions, handling prompts, retries, and structured output parsing
Vertex AI/Gemini brings semantic understanding to analyze what changes actually mean for API consumers
Here’s how these components work together in practice:
Setting Up the Environment
Let’s walk through setting up this system step by step. We’ll use a sample Todo API project as our example.
Our implementation uses LangGraph to create a deterministic workflow for analyzing API changes:
Here’s the core LangGraph implementation:
from langgraph.graph import StateGraph, MessagesState
from typing import TypedDict, List, Dict, Any
import logging
class CompatibilityState(TypedDict):
"""State for the compatibility checking workflow"""
workspace_path: str
proto_files: List[str]
git_diff: str
buf_results: Dict[str, Any]
ai_analysis: Dict[str, Any]
final_report: Dict[str, Any]
can_deploy: bool
class CompatibilityChecker:
def __init__(self, project_id: str, model_name: str = "gemini-2.0-flash-exp"):
self.logger = logging.getLogger(__name__)
self.project_id = project_id
self.model = self._initialize_llm(model_name)
self.workflow = self._build_workflow()
def _build_workflow(self) -> StateGraph:
"""Build the LangGraph workflow"""
workflow = StateGraph(CompatibilityState)
# Add nodes for each step
workflow.add_node("load_protos", self.load_proto_files)
workflow.add_node("get_diff", self.get_git_diff)
workflow.add_node("buf_check", self.run_buf_analysis)
workflow.add_node("ai_analysis", self.run_ai_analysis)
workflow.add_node("generate_report", self.generate_report)
# Define the flow
workflow.add_edge("load_protos", "get_diff")
workflow.add_edge("get_diff", "buf_check")
workflow.add_edge("buf_check", "ai_analysis")
workflow.add_edge("ai_analysis", "generate_report")
# Set entry point
workflow.set_entry_point("load_protos")
workflow.set_finish_point("generate_report")
return workflow.compile()
Intelligent Prompt Engineering
The key to accurate breaking change detection lies in the prompt design. Here’s our approach:
def create_analysis_prompt(self, diff: str, buf_results: dict) -> str:
"""Create a comprehensive prompt for the LLM"""
return f"""
You are an API compatibility expert analyzing protobuf changes.
CONTEXT:
- This is a production API with existing consumers
- Breaking changes can cause service outages
- We follow semantic versioning principles
STATIC ANALYSIS RESULTS:
{json.dumps(buf_results, indent=2)}
GIT DIFF:
```
{diff}
```
ANALYZE THE FOLLOWING:
1. Wire-level breaking changes (trust buf results completely)
2. Semantic breaking changes:
- Required fields added without defaults
- Field removals (always breaking)
- Type changes that lose precision
- Enum value removals or reordering
3. Behavioral concerns:
- Fields that might be parsed by consumers
- Error message format changes
- Ordering or filtering logic changes
CRITICAL RULES:
- If buf reports breaking changes, mark them as is_breaking=true
- Field removal is ALWAYS breaking (severity: HIGH)
- Adding REQUIRED fields is breaking (severity: MEDIUM-HIGH)
- Be conservative - when in doubt, flag as potentially breaking
OUTPUT FORMAT:
Return a JSON object with this structure:
{{
"changes": [...],
"overall_severity": "NONE|LOW|MEDIUM|HIGH|CRITICAL",
"can_deploy": true|false,
"recommendations": [...]
}}
"""
Real-World Example: When Buf Missed Half the Problem
Let me show you exactly why we need AI augmentation with a concrete example. I’m going to intentionally break a Todo API in two different ways to demonstrate the difference between what traditional tools catch versus what our AI-enhanced system detects.
The Original Proto File
message Task {
string id = 1;
string title = 2;
string description = 3; // This field will be removed
bool completed = 4;
google.protobuf.Timestamp created_at = 5;
google.protobuf.Timestamp updated_at = 6;
repeated string tags = 7;
TaskPriority priority = 8;
string assignee_id = 9;
google.protobuf.Timestamp due_date = 10;
repeated Comment comments = 11;
}
When we ran buf breaking --against '.git#branch=main', Buf only detected one breaking change:
api/proto/todo/v1/todo.proto:83:3:Field "3" with name "description" on message "Task" was deleted.
Why did Buf miss the second breaking change? Because adding a field with [(validate.rules).message.required = true] is an application-level annotation, not a wire-protocol breaking change. Buf focuses on wire compatibility – it doesn’t understand application-level validation rules.
What Our AI-Enhanced System Detected
Here’s the actual output from our tool:
2025-10-14 18:29:11,388 - __main__ - INFO - Collecting git diffs...
2025-10-14 18:29:11,392 - __main__ - INFO - Analyzing with LLM...
2025-10-14 18:29:14,471 - __main__ - INFO - Generating final report...
================================================================================
API BACKWARD COMPATIBILITY REPORT
================================================================================
Timestamp: 2025-10-14T18:29:14.471705
Files Analyzed: api/proto/todo/v1/todo.proto
Total Changes: 2
Breaking Changes: 2
Overall Severity: HIGH
Can Deploy: NO
DETECTED CHANGES:
----------------------------------------
1. Removed field 'description'
Location: api/proto/todo/v1/todo.proto:83
Category: field_removal
Breaking: YES
Severity: HIGH
Recommendation: Consider providing a migration path for clients relying on this field.
2. Added required field 'metadata'
Location: api/proto/todo/v1/todo.proto:136
Category: field_addition
Breaking: YES
Severity: HIGH
Recommendation: Ensure all clients are updated to include this field before deployment.
LLM ANALYSIS:
----------------------------------------
The changes include the removal of the 'description' field and the addition of a required
'metadata' field, both of which are breaking changes.
================================================================================
2025-10-14 18:29:14,472 - __main__ - INFO - JSON report saved to results/non_breaking.json
The “Aha!” Moment
This is exactly the scenario I warned about in my presentation. Here’s what happened:
Buf did its job – It caught the field removal. That’s wire-level breaking change detection working as designed.
But Buf has blind spots – It completely missed the required field addition because [(validate.rules).message.required = true] is an application-level annotation. To Buf, it’s just another optional field on the wire.
The AI understood context – Our LLM looked at that validation rule and immediately recognized: “Hey, this server is going to reject any request without this field. That’s going to break every existing client!”
Think about it – if we had only relied on Buf, we would have deployed thinking we fixed the one breaking change. Then boom – production down because no existing client sends the new metadata field. This is precisely why we need AI augmentation. It’s not about replacing Buf – it’s about catching what Buf structurally cannot see.
Beyond This Example
This pattern repeats across many scenarios that static analysis misses:
Validation rules that make previously optional behavior mandatory
Fields that were always populated but are now conditional
Changes to default values that alter behavior
Error message format changes (clients parse these!)
Response ordering changes (someone always depends on order)
Rate limiting or throttling policy changes
Authentication requirements that changed
Integrating with CI/CD
The tool can be integrated into your CI/CD pipeline:
1. RAG (Retrieval-Augmented Generation): Learning from Past Mistakes
One of the most powerful aspects of our system is how it learns from history. Here’s how RAG actually works in our implementation:
from langchain.vectorstores import Chroma
from langchain.embeddings import VertexAIEmbeddings
from langchain.schema import Document
class BreakingChangeKnowledgeBase:
"""RAG system that learns from past breaking changes"""
def __init__(self, project_id: str):
self.embeddings = VertexAIEmbeddings(
model_name="textembedding-gecko@003",
project=project_id
)
# Store historical breaking changes in vector database
self.vector_store = Chroma(
collection_name="api_breaking_changes",
embedding_function=self.embeddings,
persist_directory="./knowledge_base"
)
def index_breaking_change(self, change_data: dict):
"""Store a breaking change incident for future reference"""
doc = Document(
page_content=f"""
Proto Change: {change_data['diff']}
Breaking Type: {change_data['type']}
Customer Impact: {change_data['impact']}
Resolution: {change_data['resolution']}
""",
metadata={
"severity": change_data['severity'],
"date": change_data['date'],
"service": change_data['service'],
"prevented": change_data.get('caught_before_prod', False)
}
)
self.vector_store.add_documents([doc])
def find_similar_changes(self, current_diff: str, k: int = 5):
"""Find similar past breaking changes"""
results = self.vector_store.similarity_search_with_score(
current_diff,
k=k,
filter={"severity": {"$in": ["HIGH", "CRITICAL"]}}
)
return results
# How it's used in the main checker:
class CompatibilityChecker:
def __init__(self, project_id: str):
self.knowledge_base = BreakingChangeKnowledgeBase(project_id)
def run_ai_analysis(self, state: dict):
"""Enhanced AI analysis using RAG"""
# Find similar past incidents
similar_incidents = self.knowledge_base.find_similar_changes(
state['git_diff']
)
# Build context from past incidents
historical_context = ""
if similar_incidents:
historical_context = "\n\nSIMILAR PAST INCIDENTS:\n"
for doc, score in similar_incidents:
if score > 0.8: # High similarity
historical_context += f"""
- Previous incident: {doc.metadata['date']}
Impact: {doc.page_content}
This suggests high risk of similar issues.
"""
# Include historical context in prompt
enhanced_prompt = f"""
{self.base_prompt}
{historical_context}
Based on historical patterns, pay special attention to similar past issues.
"""
return self.llm.invoke(enhanced_prompt)
2. Model Context Protocol (MCP) Integration
MCP allows our AI to interact with external tools seamlessly. Here’s the actual implementation:
# mcp_server.py - MCP server for API compatibility tools
from mcp.server import MCPServer
from mcp.tools import Tool, ToolResult
import subprocess
import json
class APICompatibilityMCPServer(MCPServer):
"""MCP server exposing API compatibility tools to AI agents"""
def __init__(self):
super().__init__("api-compatibility-checker")
self.register_tools()
def register_tools(self):
"""Register all available tools"""
@self.tool("buf_lint")
async def buf_lint(proto_path: str) -> ToolResult:
"""Run buf lint on proto files"""
result = subprocess.run(
["buf", "lint", proto_path],
capture_output=True,
text=True
)
return ToolResult(
success=result.returncode == 0,
output=result.stdout,
error=result.stderr
)
@self.tool("buf_breaking")
async def buf_breaking(proto_path: str, against: str = "main") -> ToolResult:
"""Check for breaking changes using buf"""
cmd = [
"buf", "breaking",
"--against", f".git#branch={against}",
"--path", proto_path
]
result = subprocess.run(cmd, capture_output=True, text=True)
# Parse breaking changes
breaking_changes = []
for line in result.stdout.splitlines():
if line.strip():
breaking_changes.append(self.parse_buf_output(line))
return ToolResult(
success=True,
data={
"has_breaking": len(breaking_changes) > 0,
"changes": breaking_changes,
"raw_output": result.stdout
}
)
@self.tool("check_consumer_contracts")
async def check_contracts(service: str, version: str) -> ToolResult:
"""Check if change breaks consumer contracts"""
# This connects to our contract testing system
contracts = self.load_consumer_contracts(service)
violations = []
for contract in contracts:
if not self.validate_contract(contract, version):
violations.append({
"consumer": contract["consumer"],
"expectation": contract["expectation"],
"impact": "Contract violation detected"
})
return ToolResult(
success=True,
data={
"total_consumers": len(contracts),
"violations": violations,
"safe_to_deploy": len(violations) == 0
}
)
@self.tool("generate_migration_guide")
async def generate_migration(breaking_changes: list) -> ToolResult:
"""Generate migration guide for breaking changes"""
guide = self.create_migration_steps(breaking_changes)
return ToolResult(
success=True,
data={"migration_guide": guide}
)
# How LangChain uses MCP tools:
from langchain.agents import create_mcp_agent
from langchain_mcp import MCPToolkit
# Initialize MCP toolkit
mcp_toolkit = MCPToolkit(
server_url="http://localhost:8080", # MCP server endpoint
available_tools=["buf_lint", "buf_breaking", "check_consumer_contracts"]
)
# Create agent with MCP tools
agent = create_mcp_agent(
llm=llm,
tools=mcp_toolkit.get_tools(),
system_prompt="""
You are an API compatibility expert. Use the available MCP tools to:
1. Run buf lint and breaking checks
2. Verify consumer contracts
3. Generate migration guides when needed
Always check consumer contracts after detecting breaking changes.
"""
)
# Usage in the main workflow
class CompatibilityChecker:
def __init__(self):
self.mcp_agent = agent
def comprehensive_check(self, proto_path: str):
"""Run comprehensive compatibility check using MCP tools"""
# Let the agent orchestrate the tools
result = self.mcp_agent.invoke({
"input": f"""
Analyze {proto_path} for breaking changes:
1. Run buf lint first
2. Check breaking changes against main branch
3. If breaking changes found, check consumer contracts
4. Generate migration guide if needed
"""
})
return result
3. How RAG + MCP Work Together
Here’s the magic – combining RAG’s historical knowledge with MCP’s tool access:
class IntelligentAPIGuardian:
"""Combines RAG and MCP for comprehensive analysis"""
def analyze_change(self, proto_diff: str):
# Step 1: Use MCP to run all tools
mcp_results = self.mcp_agent.invoke({
"input": f"Analyze this diff: {proto_diff}"
})
# Step 2: Use RAG to find similar past incidents
historical_data = self.knowledge_base.find_similar_changes(proto_diff)
# Step 3: Combine insights
combined_analysis = self.llm.invoke(f"""
Current change analysis from tools:
{mcp_results}
Historical patterns from similar changes:
{historical_data}
Synthesize a comprehensive risk assessment considering both
current tool results and historical precedents.
If historical data shows issues that tools didn't catch,
flag them as "HISTORICAL_RISK" items.
""")
# Step 4: Store this analysis for future RAG queries
if combined_analysis['has_breaking_changes']:
self.knowledge_base.index_breaking_change({
'diff': proto_diff,
'type': combined_analysis['breaking_type'],
'impact': combined_analysis['impact'],
'resolution': combined_analysis['recommendations'],
'severity': combined_analysis['severity'],
'date': datetime.now(),
'caught_before_prod': True
})
return combined_analysis
RAG gives us institutional memory – learning from every incident, getting smarter over time
Together they catch issues that neither could find alone
For example, RAG might recall “last time we added a required field to Task, the mobile team’s app crashed because they cache responses for 24 hours” – something no static tool would know, but crucial for preventing an outage.
Testing the System
Here’s a complete walkthrough of testing the system:
# 1. First, verify your setup
python test_simple.py
# Output should show:
# ? All core modules imported successfully
# ? Proto file found
# ? Proto modifier works - 12 test scenarios available
# ? Buf integration initialized successfully
# ? GCP_PROJECT configured: your-project-id
# ? Vertex AI connection verified
# 2. Make breaking changes to the proto file
python proto_modifier.py ../api/proto/todo/v1/todo.proto \
--scenario remove_field
python proto_modifier.py ../api/proto/todo/v1/todo.proto \
--scenario add_required_field
# 3. Run the compatibility checker
python api_compatibility_checker.py \
--workspace .. \
--against '.git#branch=main' \
--output results/breaking_changes.json
# 4. Review the detailed report
cat results/breaking_changes.json | jq '.'
Use Conservative Defaults: When uncertain, flag as potentially breaking
Provide Clear Explanations: Developers need to understand why something is breaking
Version Your Prompts: Treat prompts as code – version and test them
Monitor LLM Costs: Use caching and optimize prompt sizes
Implement Gradual Rollout: Start with warnings before blocking deployments
Build Team Trust Gradually: Don’t start by blocking deployments. Run in shadow mode first, report findings alongside Buf results, and let teams see the value before enforcement. Track false positives and tune your prompts based on real feedback.
Document Your Prompts: Your prompt engineering is as critical as your code. Version control your prompts, document why certain instructions exist, and treat them as first-class artifacts that need testing and review.
The Power of Agentic AI
What makes this approach “agentic” rather than just AI-assisted?
Autonomous Decision Making: The system doesn’t just flag issues – it makes decisions whether API changes can deployed
Multi-Step Reasoning: It performs complex analysis chains without human intervention
Tool Integration: It orchestrates multiple tools (Git, Buf, LLMs) to achieve its goal
Contextual Understanding: It considers historical patterns and project-specific rules
Actionable Output: It provides specific remediation steps, not just warnings
Future Enhancements
The roadmap for this tool includes:
Multi-Protocol Support: Extend beyond protobuf/gRPC to OpenAPI and GraphQL
Behavioral Testing: Integration with contract testing frameworks
Auto-Migration Generation: Create migration scripts for breaking changes
Performance Impact Analysis: Predict performance implications of changes
Known Limitations: This system excels at catching semantic and behavioral changes, but it’s not perfect. It can’t predict how undocumented client implementations behave, can’t catch changes in external dependencies your API relies on, and can’t guarantee zero false positives. Human judgment remains essential—especially for nuanced cases where breaking changes might be intentional and necessary.
Conclusion
Throughout my decades in software development, I’ve learned that API compatibility isn’t just about wire protocols and field numbers. It’s about understanding how our users actually depend on our APIs—all the documented behaviors, the undocumented quirks, and yes, even the bugs they’ve built workarounds for. Traditional static analysis tools like Buf are essential—they catch structural breaking changes with perfect precision. But as we’ve seen with the required field example, they can’t reason about semantic changes, business context, or application-level validation rules. That’s where AI augmentation transforms the game. By combining Buf’s deterministic analysis with an LLM’s contextual understanding through LangChain and LangGraph, we’re not just catching more bugs—we’re fundamentally changing how we think about API evolution.
The complete implementation, including all the code and configurations demonstrated in this article, is available at: https://github.com/bhatti/todo-api-errors. Fork it, experiment with it, break it, improve it.
Postel’s Law: “Be conservative in what you send, liberal in what you accept” – but with Agentic AI, we can be intelligent about both.
Hyrum’s Law: “With a sufficient number of users, all observable behaviors will be depended upon” – which is why we need AI to catch the subtle breaking changes that static analysis misses.