In past projects, I saw most engineering teams ran load tests before major launches and rarely at any other time. The assumption is that if a code change is small, performance is probably fine. In practice, that assumption fails regularly. A runtime upgrade can change memory allocation patterns, garbage collection behavior, and connection handling in ways that only appear under load. A third-party library upgrade can introduce synchronous blocking where there was none before. A new database index can shift query planner behavior and affect read latency at scale. None of these surface in functional tests. None of them are visible in code review. They show up under load, in production, usually at the worst possible time.
Performance testing isn’t a pre-launch ceremony. It’s part of how you understand and maintain your system’s behavior as your code evolves, your dependencies change, and your traffic grows. This guide covers the full scope: the test types and what each one tells you, how to design meaningful tests, what metrics to collect, which tools to use, how to handle dependencies in your tests, and how to make this a regular part of your development process rather than a one-time event.
Why Performance Testing Gets Skipped
Often teams skip performance testing due to setup time, cost or slow feedback loop. These constraints are legitimate, but they lead to a familiar outcome where performance problems get discovered in production. Another common pattern I have observed is that many teams don’t have a clear baseline picture of how their application actually behaves. They don’t know their normal memory footprint. They don’t know which code paths are hot. They don’t know at what concurrency level their database connection pool saturates or when their cache hit rate starts degrading. Without a baseline, you can’t detect regressions, you can’t capacity plan accurately, and you can’t tell a normal traffic spike from an actual problem. The goal of performance testing is to know your system well enough to predict how it behaves and catch it when behavior changes unexpectedly.
Performance Testing in the SDLC
The most effective teams don’t treat performance testing as a separate phase instead they integrate it into their regular development process at multiple levels.
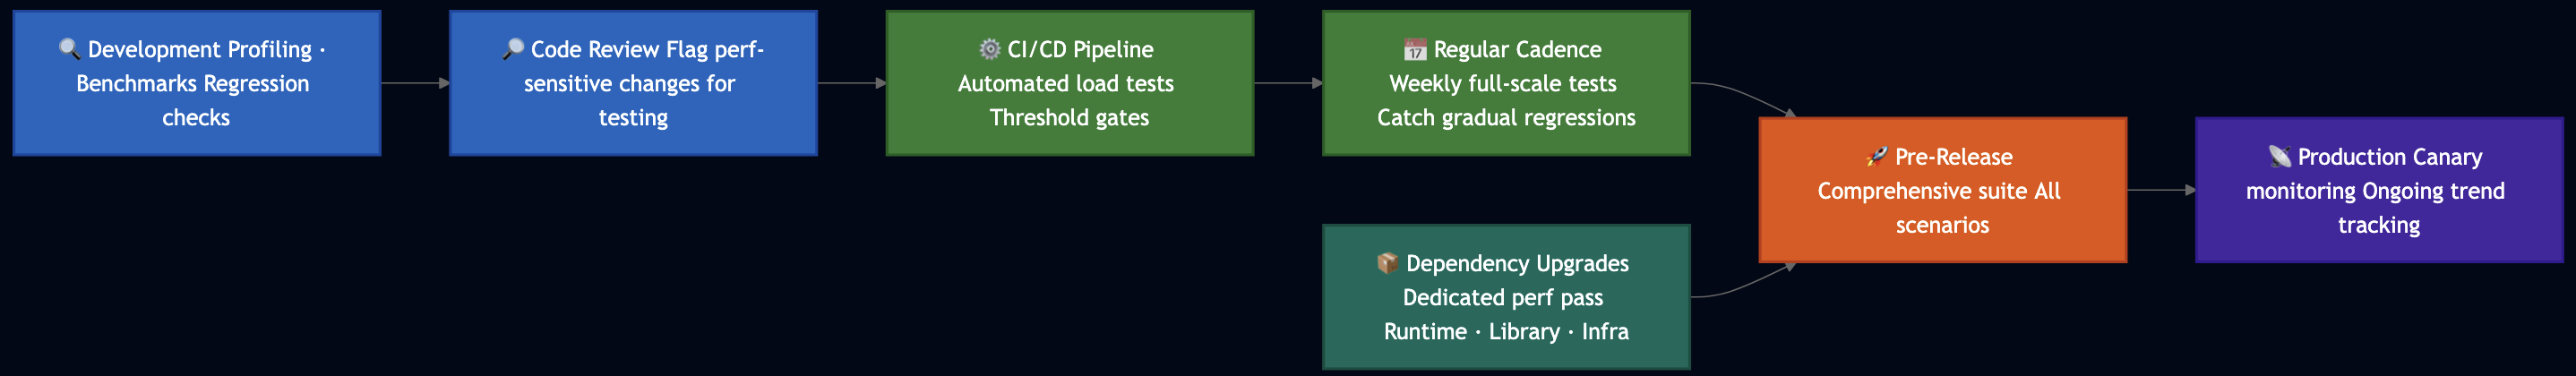
- During development: I have found profiling tools like JProbe/Yourkit for Java, pprof for GO, V8 profiler for Node.js, XCode instruments for Swift/Objective-C incredibly useful to find hot code path, memory leaks or concurrency issues.
- During code review: Another common pattern that I have found useful is flagging changes to caching, database queries, serialization, or hot code paths for load testing before merge.
- Nightly CI/CD pipelines: Though, load testing on each commit would be excessive but they can partially run as part of nightly build so that we can fix them before they reach production.
- On a regular schedule: Another option is to run full-scale load and soak tests run on a defined cadence like weekly.
- Before major releases: Comprehensive tests covering all scenarios like average load, peak load, stress, spikes, soak can run against a production-representative environment.
- After significant dependency upgrades: Runtime upgrades, major library version bumps, and infrastructure changes all deserve their own performance test pass.
The Testing Taxonomy
Following are different types of performance tests:

Profiling
Profiling instruments your application during execution and shows you exactly where time and memory are spent like which functions consume CPU, which allocate the most memory, where goroutines or threads block. You can run profiling locally before the code review so that you understand the bottlenecks already exist in your code. Load testing tells you how those bottlenecks behave when many users hit them simultaneously. Most runtimes include profiling support like Go’s pprof, Node.js’s built-in CPU and heap profiler, Python’s cProfile so you can also enable them in a test environment if needed.
Load Testing
Load testing applies a realistic, expected workload and verifies the system meets defined performance targets. The workload mirrors production traffic such as request distribution, concurrency level, and payload shapes. The goal isn’t to break anything. It’s to confirm the system handles its designed workload within acceptable response times and error rates. Any change that could affect throughput like a code change in a hot path, a dependency upgrade, a configuration change, a schema migration should warrant a load test.
Stress Testing
Stress testing pushes load well beyond expected levels to find where the system breaks and how it breaks. At what point does performance degrade? What component fails first? Does the system fail gracefully or catastrophically, or corrupting state? In past projects, I found a practical target in cloud environments is 10x your expected peak load. This accounts for real-world variability: viral traffic events, bot traffic, cascading retries from upstream services, and faster growth than planned. Stress tests also expose whether your failure modes are safe. When your system can’t keep up, what happens? Does it queue requests until it runs out of memory? Does it reject new connections cleanly with meaningful errors? Does retry behavior from clients amplify load turning a recoverable spike into a full outage?
Spike Testing
Spike testing applies an abrupt load increase not a gradual ramp but a sharp jump so that we can learn how the system absorbs and recovers from it. This simulates promotional emails going out, products appearing in news, scheduled batch jobs triggering thousands of concurrent operations, or a mobile app push notification causing a synchronized rush of API calls. The spike testing can identify problems like cold-start latency when new instances initialize, connection pool exhaustion when concurrency jumps faster than the pool replenishes, cache stampedes when many concurrent requests miss cache simultaneously, and auto-scaling lag when the metric-to-action delay is too long. After the spike, watch recovery. Latency should return to baseline. Resource utilization should drop. If it doesn’t, the system is carrying forward pressure that will degrade subsequent traffic.
Soak Testing
Soak testing runs a moderate, sustained load over an extended period from several hours to several days. The load level isn’t extreme; the duration is the point so that it can uncover problems that only occur after a long duration such as:
- Memory leaks: Usage climbs slowly and continuously. The system that runs fine for 30 minutes may run out of heap after 8 hours. This is especially important to test after runtime or library upgrades, which can change allocator behavior.
- Connection leaks: Database or HTTP connections that aren’t properly released accumulate until the pool is exhausted.
- Thread accumulation: Background threads that don’t terminate properly compound over time.
- Disk exhaustion: Log files that aren’t rotated, or temporary files that aren’t cleaned up, fill disk gradually.
- Cache degradation: Caches misconfigured for their access patterns may perform well initially and degrade as the working set evolves.
- GC pressure: Garbage collection that runs cleanly initially can become increasingly frequent and pause-heavy as heap fragmentation grows over time.
Scalability Testing
Scalability testing validates that your system scales up to absorb increasing load and scales back down when load subsides. Cloud infrastructure assumes elastic scaling so scalability testing verifies the assumption. This helps verify that: the metric driving scale-up (CPU, request rate, queue depth) actually reaches its threshold under realistic load. The scaling event actually reduces the pressure that triggered it. Scale-up happens fast enough that users don’t experience degradation during the lag. Scale-down doesn’t trigger an immediate scale-up cycle, creating instability. In practice, auto-scaling especially first scale event can take several minutes so you need to make sure that you have some extra capacity to handle increased load.
Volume Testing
Many performance characteristics change materially as data grows. Index scan times increase. Query planner behavior shifts. Cache hit rates drop as the working set outgrows cache size. Search latency that is acceptable at 50 million records may become unacceptable at 250 million. Test at your current production data volume, then at projected volumes for 1 and 3 years out. The time to address data growth challenges in architecture is before you’re already there.
Recovery Testing
Recovery testing applies an abnormal condition like a dependency failure, a network partition, a resource exhaustion event and measures how long the system takes to return to normal operation. The key questions: does the system recover at all? How long does recovery take? What’s the user-visible impact during the recovery window?
Handling Dependencies in Your Tests
One of the practical decisions in every load test is what to do about dependencies like external APIs, third-party services, internal microservices, payment processors, identity providers, email services, and so on. You have two approaches, and which one you choose depends on what your test is trying to answer.
Mock Dependencies When You’re Focused on Your Own Code
When your goal is to validate your application’s internal performance like memory footprint, CPU usage, throughput of your business logic, efficiency of your data access layer then mocking external dependencies is often the right call. However, you will need to build a well-designed mock that returns realistic response payloads with configurable latency. Mocking lets you:
- Isolate your application’s performance characteristics from the noise of external variability
- Simulate dependency failure modes (timeouts, errors, slow responses) in a controlled way
- Run tests without consuming third-party quotas or generating costs in external systems
- Reproduce specific latency profiles to understand how your code behaves under different dependency performance conditions
Include Real Dependencies When Integration Behavior Matters
When your goal is to validate end-to-end system behavior including the interaction effects between your system and its dependencies then you can use real dependencies or realistic stubs deployed under your control. The reason this matters: under load, dependencies behave differently than they do at idle. For example, higher latency in dependencies can propagate creating back-pressure in your system that a mock would never reveal. Dependencies that are slow, throttled, or unavailable under load can:
- Exhaust your connection pools (connections held open waiting for a slow response)
- Fill your request queues (new requests queueing behind slow in-flight requests)
- Trigger retry storms (your retry logic amplifying load on an already-struggling dependency)
- Surface timeout and circuit-breaker behavior that only activates under real latency conditions
If you include real third-party services in your load test, be explicit about two things: you may consume quota and generate costs, and their performance becomes part of your results. When a dependency is slow, it appears as latency in your own metrics — know what you’re measuring.
A practical middle ground: deploy internal stubs for your external dependencies. A stub is a service you control that returns realistic responses with configurable behavior. Unlike a mock in a test harness, a stub runs as a real service and participates in your actual network topology. It lets you test realistic integration behavior without the unpredictability or cost of real external services.
Watch for Automatic Retry Amplification
Another factor that can skew results from performance testing is automated retries at various layers when a request fails or times out. Under load, this multiplies traffic. If your application generates 400 write operations per second against a dependency, and that dependency starts returning errors, your client may retry each failed request two or three times and suddenly generating 800 to 1,200 operations per second against an already-struggling system. In your load tests, verify that your retry behavior is bounded and doesn’t turn a manageable degradation into a cascading failure. Exponential backoff with jitter, retry budgets, and circuit breakers all exist to prevent this.
Design Your Load Model
Before writing a test script, model the load you intend to generate. A poorly designed load model produces results that feel meaningful but don’t correspond to anything real.
Use Production Traffic Patterns as Your Starting Point
Study your actual production metrics. Identify:
- Average requests per second across a normal operating period
- Peak requests per second during your highest-traffic periods
- Request distribution across endpoints: what percentage of traffic hits each API? Most services have a small number of high-traffic endpoints and many low-traffic ones.
- Read/write ratio: most production services are read-heavy; your load model should reflect that
- Payload characteristics — average request and response sizes
- User session behavior: are users authenticated? Do requests carry session state? Do later requests in a workflow depend on earlier ones?
- Geographic distribution: does your traffic come from one region or many?
Use Stepped Load Progression
Ramp load gradually rather than jumping to peak immediately. A stepped approach produces distinct data points at each level, making it easier to identify where behavior changes.

Hold each step long enough for metrics to stabilize and for any auto-scaling events to complete. If your auto-scaling policy triggers after 5 minutes of sustained high CPU, your steps need to run for at least 7-10 minutes. Steps that are too short produce transient data that doesn’t represent steady-state behavior.
Model Think Time
Real users don’t send requests as fast as possible. They read pages, fill forms, wait for results, and make decisions. Think time like the pause between user actions should be randomized within a realistic range based on observed production behavior. Omitting think time concentrates load artificially, inflates concurrency counts, and produces results that don’t correspond to real user behavior.
Model Transaction Workflows, Not Just Endpoints
A user doesn’t hit /api/checkout. They authenticate, browse products, add items to a cart, enter payment details, and confirm an order. Each step depends on the previous step and carries state forward. Test complete workflows. Measure the whole transaction, not just individual request latency. This reveals which step in the workflow breaks first under load, which is your actual bottleneck. For transactional workflows, count the full transaction as your unit of measurement, not individual requests. A checkout that takes 12 requests and completes in 3 seconds is different from one that requires 12 requests and only completes 60% of the time under load.
The Test Environment
Your test environment is the single largest source of invalid load test results. Get this wrong and every metric, analysis, and conclusion downstream becomes unreliable.
Match Production Infrastructure
The test environment should match production in:
- Instance types, sizes, and counts
- Database configuration: connection pool size, cache allocation, index configuration, replica count
- Caching layers and their sizes (this is a common miss a cache sized to 10% of production will warm and evict very differently)
- Auto-scaling configuration and thresholds
- Load balancer and network configuration
- All service configurations that affect throughput or latency
Pay particular attention to cache sizes. Under-sized caches in test environments produce unrealistically high cache miss rates, which increases database load and makes your results look worse than production will be. Over-sized caches make things look better.
Use Representative Data Volumes
Test environments with small datasets produce misleading results. A database with 1 million rows behaves differently from one with 100 million rows in ways that are significant and non-linear. Index performance, query planner behavior, partition routing, and cache hit rates all change with data volume. Populate your test environment with data that reflects realistic production scale before running meaningful performance tests.
Isolate the Test Environment Completely
I have seen a load test takes down production environment because it shared a common infrastructure. A test environment that shares any infrastructure with production like databases, message queues, caching clusters, network paths, logging infrastructure creates two simultaneous problems: invalid test results (because production traffic contaminates your measurements) and potential production incidents (because your load test contaminates production systems). Shared test environments that connect to production Messaging bus, Kafka, or database clusters have caused outages. Enforce complete isolation.
Account for Test Data Accumulation
Load tests generate real data. After many test runs, your test database accumulates records, logs grow, and storage fills. Plan your test data lifecycle from the start, e.g., how you populate data before tests, whether you clean up between runs, and how you prevent accumulated test data from affecting your test environment’s performance over time.
Document Your Environment Specification
Version-control your environment definition alongside your test scripts. When you compare results across time, you need to know that what changed was the system under test, not the test environment. An environment specification that exists only in someone’s memory cannot be reproduced reliably.
Metrics: Collect the Right Things
Load testing generates a lot of data. The teams that extract the most value don’t collect more metrics, they collect the right metrics and actually analyze them.
Latency
Track percentiles, not averages. Averages hide tail behavior that determines user experience.
- P50 — what the median user experiences
- P90 — your common-case ceiling; nine in ten requests complete within this
- P99 — your near-worst case; one in a hundred users waits this long
- P99.9 — your extreme tail; relevant for high-volume services where 0.1% is still thousands of users
The gap between P50 and P99.9 tells you about consistency. A wide gap means some users experience good performance while others experience unacceptable degradation. Systems under load often hold P50 steady while P99 climbs.
Throughput
- Requests per second: raw system throughput
- Successful transactions per second: throughput filtered by correctness; throughput with a 20% error rate is not good throughput
- Throughput per resource unit: requests per CPU core, per GB of memory helps with capacity planning
Error Rates
- Fault rate — server-side failures (5xx responses)
- Error rate — client rejections, throttled requests, timeouts
- Error distribution — which specific errors, at what load levels
Don’t aggregate errors into a single rate. A 2% error rate composed entirely of timeouts tells you something different from a 2% error rate of connection refused responses. Decompose your error data and correlate specific error types with the load levels at which they appear.
Resource Utilization
Collect these for every component like application servers, databases, caches, message queues, load balancers, and load generators:
- CPU: overall and per-core; watch for single-threaded bottlenecks where overall CPU looks fine but one core is maxed
- Memory: heap usage, GC frequency and pause duration, swap usage; track memory over time in soak tests to detect leaks
- Disk I/O: read and write throughput, queue depth, utilization percentage; relevant for databases and any service that writes logs or temp files
- Network I/O: ingress and egress bytes per second, connection counts, dropped packets
- Thread and connection pool utilization: active threads, queued requests, pool exhaustion events
Application-Level Metrics
- Cache hit/miss/eviction rates: degrading hit rates under load reveal cache sizing or key distribution problems
- Queue depths: growing queues indicate consumers can’t keep pace with producers
- Database connection pool saturation: one of the most common failure modes under load
- GC pause duration and frequency: GC pressure under load causes latency spikes that don’t show up in CPU metrics directly
- Retry rates: high retry rates indicate a dependency is struggling, and may be amplifying load
- Circuit breaker state: how often circuit breakers open under load, and what triggers them
Dependency-Level Metrics
When you include real dependencies in your test, monitor them as carefully as your own service:
- Response latency from each dependency (P50, P99)
- Error rates from each dependency
- Dependency-side resource utilization (if you have access)
- Message bus ingress and egress (if applicable)
- Partition utilization for distributed storage systems
When a dependency is slow or erroring, that signal propagates through your system as elevated latency and errors in your own metrics. You need dependency-level metrics to trace the source.
Availability
Define availability targets before testing:
- Service availability: percentage of requests that succeed
- Per-endpoint availability: some endpoints degrade before others; measure them independently
- Dependency availability: availability of each system your service calls
Business-Level Metrics
The most important metrics are often furthest from the infrastructure:
- Orders completed per minute
- Successful authentication rate
- Payment processing completion rate
- Data write confirmation rate
Infrastructure metrics tell you what the system is doing. Business metrics tell you what users are experiencing. A system where P99 latency stays within SLA but checkout completion drops 15% under load has a problem that infrastructure metrics alone won’t reveal clearly.
Tools
Over the years, I have used various commercial and open source tools like LoadRunner, Grinder, Tsung, etc. that are no longer well maintained. Here are common tools that can be used for load testing:
For Simple Endpoint Testing
ab(Apache Bench) and Hey: Command-line tools that generate load against a single endpoint. No scripting required, fast to start.Vegeta: Generates load at a constant request rate, independent of server response time. This distinction matters: when your server responds slowly, most tools automatically reduce request rate. Vegeta maintains the configured rate as latency climbs, which means you observe back-pressure and degradation accurately.
echo "GET https://api.example.com/users/123" | vegeta attack -rate=500 -duration=60s | vegeta report
k6: Scripted in JavaScript, distributed as a single Go binary. k6 handles multi-step scenarios natively, supports parameterized test data, models think time, and exposes rich built-in metrics. It integrates with Prometheus, CloudWatch, and Grafana for analysis, and supports threshold-based pass/fail in CI pipelines.
import http from 'k6/http';
import { check, sleep } from 'k6';

export const options = {
  stages: [
    { duration: '2m', target: 100 },   // ramp to 100 users
    { duration: '5m', target: 100 },   // hold at average load
    { duration: '2m', target: 500 },   // ramp to peak
    { duration: '5m', target: 500 },   // hold at peak
    { duration: '1m', target: 1000 },  // spike
    { duration: '2m', target: 0 },     // ramp down
  ],
  thresholds: {
    http_req_duration: ['p(99)<500'],  // 99% of requests under 500ms
    http_req_failed: ['rate<0.01'],    // less than 1% error rate
  },
};

export default function () {
  // Step 1: authenticate
  const loginRes = http.post('https://api.example.com/auth/login', {
    username: `user_${__VU % 10000}@example.com`,
    password: 'password',
  });
  check(loginRes, { 'login succeeded': (r) => r.status === 200 });

  const token = loginRes.json('token');

  // Step 2: fetch catalog (read operation)
  const catalogRes = http.get('https://api.example.com/catalog?page=1', {
    headers: { Authorization: `Bearer ${token}` },
  });
  check(catalogRes, { 'catalog loaded': (r) => r.status === 200 });

  sleep(Math.random() * 3 + 1); // think time: 1-4 seconds

  // Step 3: place order (write operation)
  const orderRes = http.post(
    'https://api.example.com/orders',
    JSON.stringify({ item_id: Math.floor(Math.random() * 1000), quantity: 1 }),
    { headers: { Authorization: `Bearer ${token}`, 'Content-Type': 'application/json' } }
  );
  check(orderRes, { 'order placed': (r) => r.status === 201 });

  sleep(Math.random() * 2 + 1);
}
Apache JMeter: Meter supports complex scenarios through a GUI, handles correlation between requests, has a broad plugin ecosystem, and has extensive enterprise adoption.- Locust: Pure Python, code-defined test scenarios (not XML), a built-in web UI for real-time monitoring, distributed mode via a controller/worker model, and trivially scriptable.
For Distributed Load Generation
AWS Distributed Load Testing: When a single machine can’t generate the volume you need, this solution orchestrates load across multiple instances, accepts JMeter scripts as the test definition, and streams results to time-series storage for analysis. Use it when your bandwidth or TPS requirements exceed what a single load generator can produce.
For Observability During Tests
You can use following monitoring stack to gather performance metrics:
- Prometheus + Grafana: commonly used for infrastructure and application metrics; k6 exports directly to Prometheus
- CloudWatch: native AWS monitoring; integrates with most AWS services and many load testing tools
- Distributed tracing (Jaeger, Zipkin, AWS X-Ray): essential for understanding latency in distributed systems; propagate correlation IDs through every service boundary so you can trace a slow request to the specific component that caused it
Without distributed tracing, diagnosing latency in a multi-service system under load is largely guesswork.
Execution
- Warm Up Before Measuring: JIT compilation, connection pool initialization, cache population, and DNS resolution all affect early request latency. Build a ramp-up period into every test. Discard metrics from the warmup phase. Measure steady-state behavior only.
- Verify Your Load Generator Isn’t the Bottleneck: Before trusting any results, confirm: load generator CPU stays well below saturation (under 70%), network I/O doesn’t approach the bandwidth ceiling, and the tool achieves the TPS you configured not a lower number due to local resource constraints. If you configure 1,000 TPS but the generator only achieves 600, your results reflect the generator’s limits, not your system’s.
- Notify Dependent Teams Before Testing: If your test environment shares any infrastructure with other teams, notify them before running high-volume tests. Unexpected load from your tests against a shared component (a database, a message bus, a routing layer) can cause problems for teams who have no idea a load test is running.
- Run Each Scenario in Isolation First: Test each scenario independently before running combinations. An isolated test that reveals a problem gives you more diagnostic information than a combined test that reveals the same problem buried in noise from other scenarios.
- Don’t Overwrite Previous Results: Each test run should write to a new, timestamped output file. Overwriting results from a previous run is a common mistake when running iterative tests in a loop. You lose the ability to compare across runs.
- Pause Between Runs: Allow the system to fully drain between test iterations like connections close, queues clear, resource utilization returns to baseline. Residual load from one run contaminates the starting conditions of the next.
Common Pitfalls
- Testing a single endpoint and calling it done. A service’s behavior under load isn’t determined by any single endpoint. Test complete workflows, including the paths that matter most to users.
- Ignoring dependencies. When your dependencies are slow or unavailable, your service appears slow. When your service hammers a dependency with load, the dependency may degrade and create a feedback loop. Model dependency behavior explicitly and mock it when you want to isolate your own code, use real or realistic stubs when integration behavior matters.
- Mismatch between test environment and production. Different hardware, different cache sizes, different connection pool limits, different network latency profiles, any of these make test results non-transferable to production. Document your environment specification. Validate that it matches production before trusting results.
- Small data volumes. A test environment with 1% of production data volume produces optimistic results. Populate test data to realistic scale.
- Running load tests once. Performance characteristics change with every code change, every dependency upgrade, and every growth milestone. A load test you ran six months ago tells you about a system that no longer exists.
- Ignoring ramp-down. Verify that resource utilization returns to baseline after load subsides. A system that doesn’t recover cleanly carries forward pressure that degrades subsequent traffic.
- Not collecting metrics from all layers. Application-level metrics without infrastructure metrics leave you guessing about root cause. Infrastructure metrics without application or business-level metrics leave you unable to quantify user impact. Collect all three.
- Stopping tests when something goes wrong instead of analyzing the failure mode. When a stress test surfaces a failure, that’s the point. Note what failed, under what conditions, and how the system behaved. Stopping the test immediately loses the degradation data that tells you whether the failure mode is safe or catastrophic.
Analysis
- Establish a Baseline Before Comparing Anything: Every metric needs a reference point. P99 latency of 300ms is good or bad depending entirely on what P99 looks like at baseline load. Run a baseline test with minimal concurrent users before escalating. Capture that baseline explicitly. Compare every subsequent measurement against it.
- Separate Signal from Noise: A single high-latency data point is noise. A systematic increase in P99 as concurrency crosses 500 users is signal. Look for the pattern: where does behavior change? At what load level? After what duration? What resource metric correlates with the change?
- Trace Latency to Its Source: When you observe elevated latency, resist looking first at application CPU. Latency accumulates in many places: network round trips between services, database query execution, lock contention, GC pause accumulation, connection pool queuing, and downstream dependency latency. Distributed tracing lets you follow a slow request through every component it touched and attribute the latency precisely. Fix the actual source, not the nearest visible symptom.
- Investigate Unexpectedly Good Results: If your system performs better than expected under load, investigate before celebrating. Unexpected improvement often means your test isn’t exercising the paths you intended such as caches warming too aggressively, load not reaching the components you think it is, or test data creating unrealistic access patterns. Results you can’t explain aren’t results you can rely on.
- Generate Comparative Reports: A report listing numbers has limited value. A report comparing those numbers to your baseline, to your previous test run, and to your defined thresholds has significant value. For each metric, capture:
– Current result
– Baseline value
– SLA or target threshold
– Previous test result (regression or improvement?)
– Load level at which the metric was captured
Store test results in a queryable format over time.
Building a Continuous Performance Practice
The teams with the most reliable services don’t treat performance testing as a project. They treat it as a discipline with regular cadence.
- Define performance goals and revisit them annually. Goals should include throughput targets, latency percentiles, error rate limits, resource utilization ceilings, and headroom targets (how much capacity should remain available at peak). As your traffic patterns change, your service evolves, and your SLAs tighten, these goals need updating.
- Automate pass/fail thresholds in CI. Encode your performance targets as pipeline gates. A change that increases P99 latency by 40% under load should fail the build, the same way a change that breaks a unit test fails the build.
- Run performance canaries in production. Continuously exercise production endpoints at low volume from monitoring infrastructure. Track latency, error rates, and throughput over time. Detect gradual degradation before users do.
- Assign a performance owner on each service team. Performance improvements don’t happen without someone watching the metrics, reviewing throttling rules, identifying regressions, and driving improvements.
- Review results across time for patterns. Look at all your load test results over the past quarter. Which metrics trend in the wrong direction? Which components appear repeatedly in bottleneck analysis? Patterns across multiple tests reveal systemic issues that any individual test misses.
- Share what you learn. Performance problems and their solutions are valuable organizational knowledge. Document them. Share them across teams. The team dealing with connection pool exhaustion today is probably not the first team to hit that issue.
The Pre-Test Checklist
Before any load test:
- [ ] Test objectives and pass/fail thresholds defined in writing before execution
- [ ] Test environment completely isolated from production
- [ ] Test environment infrastructure matches production configuration (instance types, cache sizes, connection pools, scaling settings)
- [ ] Test data populated to realistic production scale
- [ ] Dependent services decided: mock, stub, or real — with rationale documented
- [ ] Monitoring dashboards active for all components, including load generators
- [ ] Dependent team on-call contacts notified
- [ ] Output file naming prevents overwrites between iterations
- [ ] Previous test results available for comparison
During execution:
- [ ] Baseline captured before escalating load
- [ ] Load generator resource utilization verified (not the bottleneck)
- [ ] Error rates monitored in real time — abnormal errors trigger a pause for investigation
- [ ] Each step held long enough for metrics to stabilize
- [ ] Auto-scaling events logged with timestamps
After execution:
- [ ] Results compared to defined thresholds and previous runs
- [ ] Anomalies investigated before conclusions are drawn
- [ ] Root cause documented for any threshold violations
- [ ] Action items assigned with owners and deadlines
- [ ] Test results stored in versioned, queryable storage
- [ ] Environment cleanup completed (test data, log files, temporary resources)
Putting It Together
Any code change can affect performance. A dependency upgrade, a new index, a configuration tweak, a framework version bump — all of these can change memory footprint, CPU usage, throughput, and latency in ways that don’t appear until you run real load. The only reliable way to catch these changes before they affect users is to make performance testing a routine part of how you build and ship software, not something you do once before a big launch.
Start with profiling to understand where time and memory go in your own code. Add load tests to your CI pipeline to catch regressions early. Run soak tests to find memory and connection leaks. Stress test to 10x your expected peak so you know what your ceiling looks like and how you fail when you hit it. Test with real dependency behavior when integration effects matter, and mock dependencies when you want to isolate your own code.
Collect metrics at every layer such as application, infrastructure, and business so you can connect a latency spike to its root cause and quantify its user impact. Store results over time so you can detect gradual regressions before they become incidents. The goal is to know your system well enough that production behavior matches what you measured in testing.