Over the past year I’ve built production agentic systems across several domains and shared what I learned along the way: production-grade AI agents with MCP and A2A, a daily minutes assistant with RAG, MCP, and ReAct, rebuilding fintech infrastructure with ReAct and local models, automated PII detection with LangChain and Vertex AI, and API compatibility guardians with LangGraph. I have learned a lot building those systems through trial and error. In this blog, I will share a set of generative and agentic AI patterns I have learned from reading Generative AI Design Patterns and Agentic Design Patterns. I have built hands on python examples from these patterns and built github.com/bhatti/agentic-patterns for running agentic apps locally via Ollama with open-source models (Qwen, DeepSeek, Llama, Mistral). Each pattern in the repo includes a README, working code, real-world use cases, and best practices.
Quick Start
git clone https://github.com/bhatti/agentic-patterns
cd agentic-patterns
pip install -r requirements.txt
ollama pull llama3
cd patterns/logits-masking && python example.py
See SETUP.md for full setup instructions.
Table of Contents
- Category 1: Content & Style Control (Patterns 1–5)
- Category 2: Adding Knowledge / RAG Stack (Patterns 6–12)
- Category 3: LLM Reasoning (Patterns 13–16)
- Category 4: Reliability & Evaluation (Patterns 17–20)
- Category 5: Tools, Agents & Efficiency (Patterns 21–32)
- Category 6: Agentic Behavior Patterns (Patterns 33–50)
- Pattern Comparison Matrix
- Choosing the Right Pattern
- What This Catalog Teaches
Category 1: Content & Style Control
The first five patterns control and optimize content generation, style, and format:
Pattern 1: Logits Masking
Category: Content & Style Control
Use When: You need to enforce constraints during generation (e.g., valid JSON, banned words)
Problem
When generating structured outputs (like JSON, code, or formatted text), language models can produce invalid sequences that don’t conform to required style rules, schemas, or constraints.
Solution
Logits Masking intercepts the model’s token generation process to enforce constraints during sampling. Three key steps:

- Intercept Sampling — Modify logits before token selection
- Zero Out Invalid Sequences — Mask invalid tokens (set logits to -inf)
- Backtracking — Revert to checkpoint if invalid sequence detected
Use Cases
- API response generation (ensure valid JSON)
- Code generation (enforce style guidelines)
- Content moderation (prevent banned words)
- Structured data extraction (match specific formats)
Constraints: Requires access to model logits (not available in all APIs). State tracking can be complex for nested structures. Performance overhead from logits processing.
Tradeoffs:
- ? Prevents invalid generation at source
- ? More efficient than post-processing
- ?? More complex than simple validation
- ?? May limit model creativity
Code Snippet
class JSONLogitsProcessor(LogitsProcessor):
    """Intercept logits and mask invalid JSON tokens."""

    def __call__(self, input_ids, scores):
        # STEP 1: Intercept sampling
        current_text = self.tokenizer.decode(input_ids[0])

        # STEP 2: Zero out invalid sequences
        for token_id in range(scores.shape[-1]):
            if not self._is_valid_json_token(token_id, current_text):
                scores[0, token_id] = float('-inf')  # Mask invalid

        return scores
Full Example: patterns/logits-masking/example.py
Pattern 2: Grammar Constrained Generation
Category: Content & Style Control
Use When: You need outputs that conform to formal grammar specifications
Problem
Language models often produce text that doesn’t conform to required formats, schemas, or grammars. Unlike simple masking, grammar-constrained generation ensures outputs follow formal grammar specifications.
Solution
Grammar Constrained Generation uses formal grammar specifications to guide token generation. Three implementation approaches:
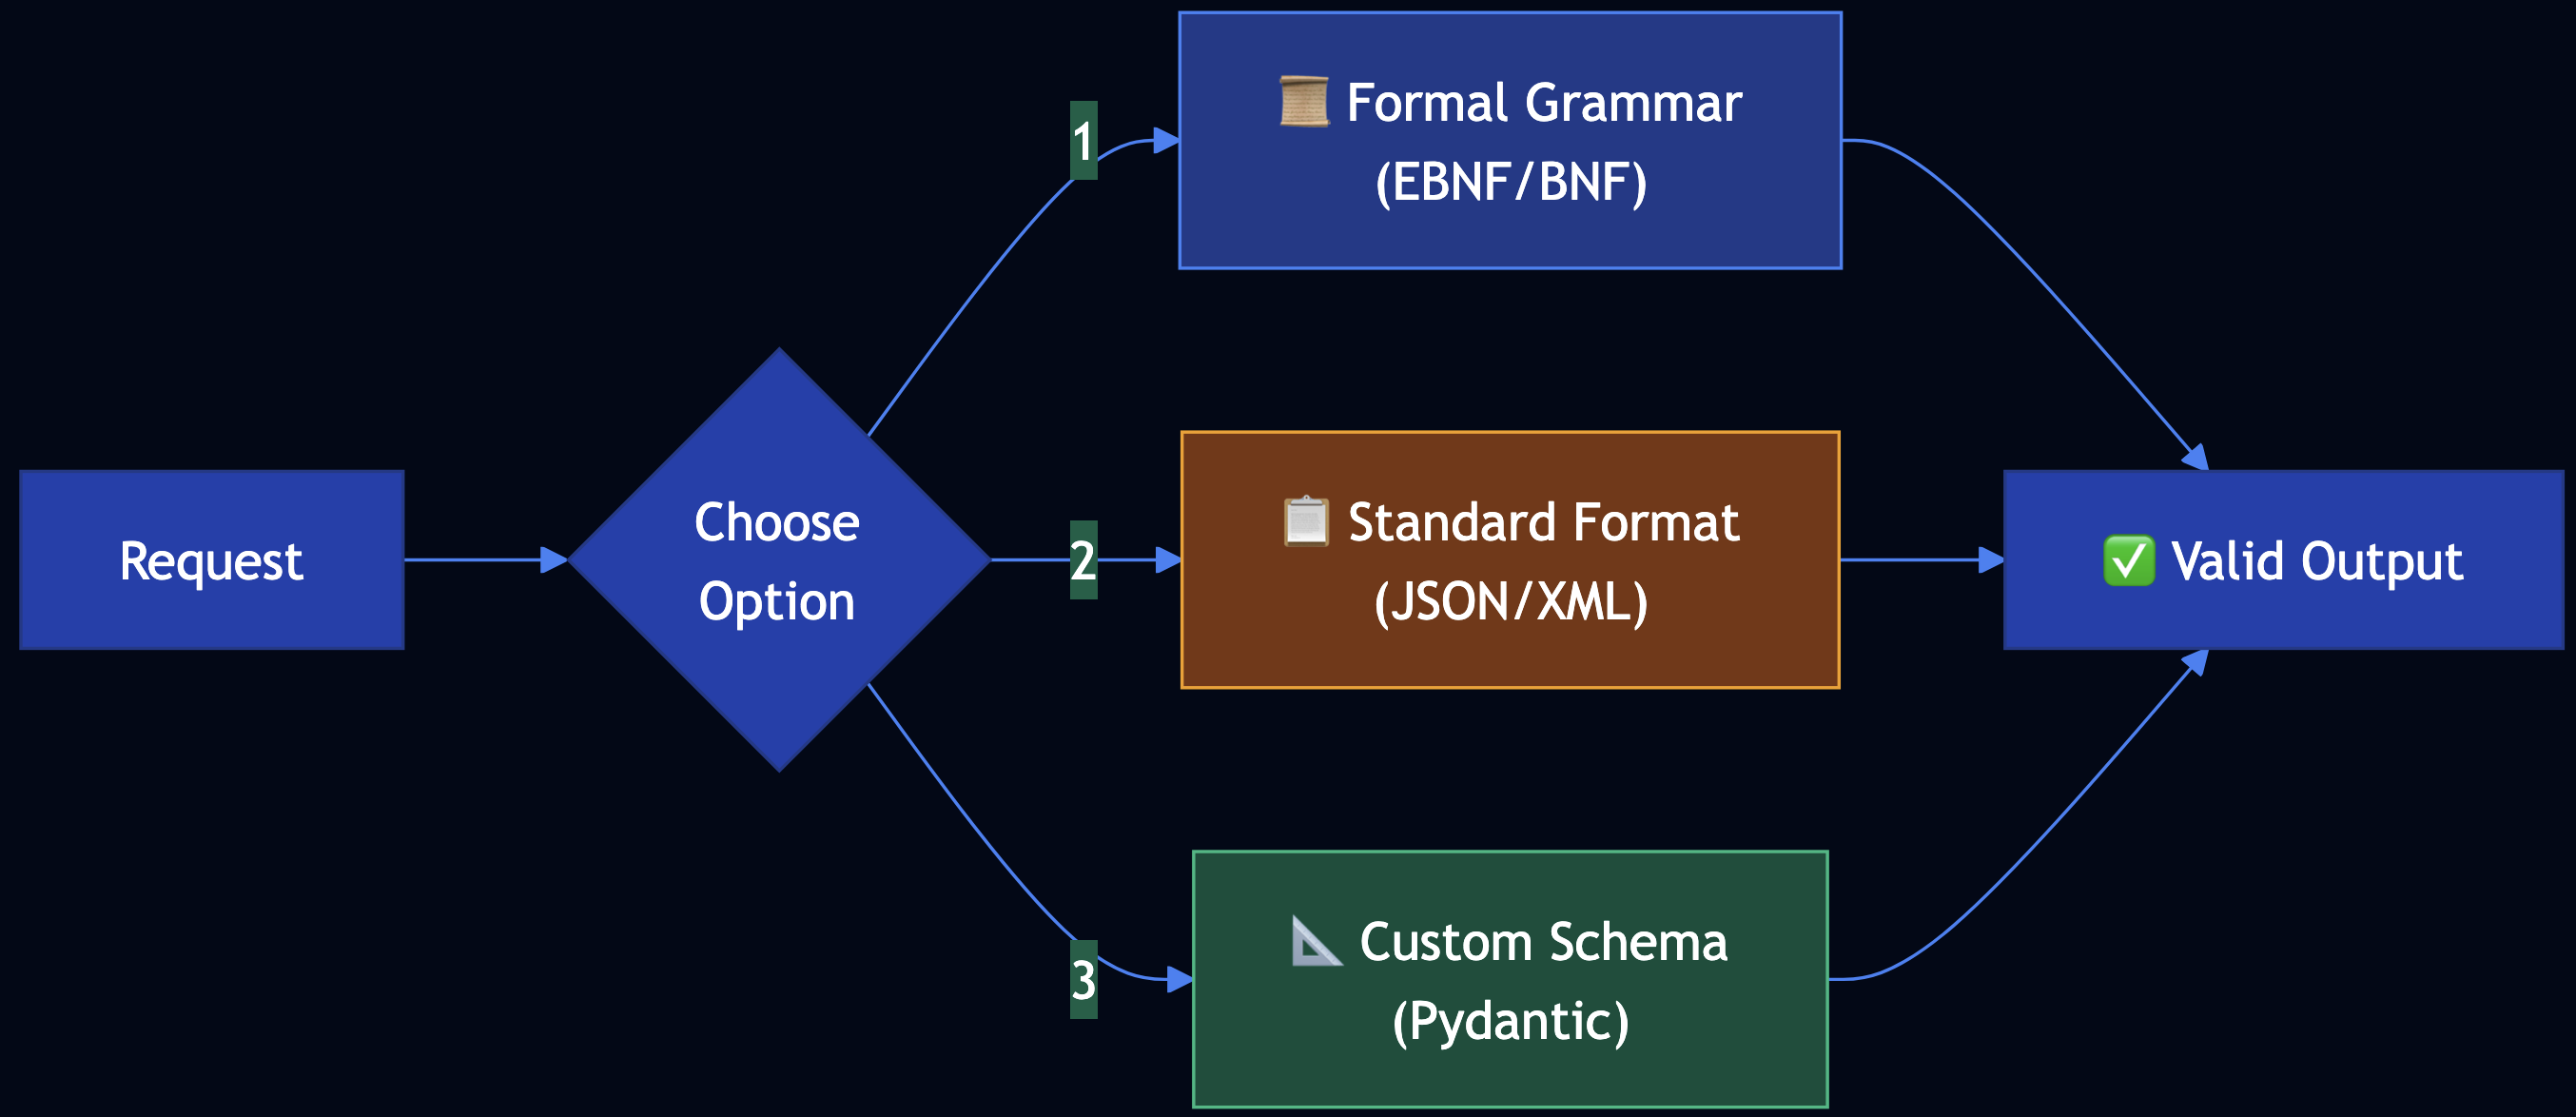
- Grammar-Constrained Logits Processor — Use EBNF grammar to create processor
- Standard Data Format — Leverage JSON/XML with existing validators
- User-Defined Schema — Use custom schemas (JSON Schema, Pydantic)
Use Cases
- API configuration generation (OpenAPI specs)
- Configuration files (YAML, TOML that must parse)
- Database queries (SQL with guaranteed syntax)
- Code generation (must compile/parse)
Constraints: Requires grammar definition or schema. Grammar parsing can be computationally expensive. Complex grammars may limit generation speed.
Tradeoffs:
- ? Guarantees grammatical correctness
- ? Works with existing schema languages
- ?? More complex than simple masking
- ?? May require grammar expertise
Code Snippet
# Option 1: Formal Grammar
grammar = """
root        ::= endpoint_config
endpoint_config ::= "{" ws endpoint_def ws "}"
endpoint_def    ::= '"endpoint"' ws ":" ws endpoint_obj
"""

# Option 2: JSON Schema
schema = {
    "type": "object",
    "required": ["endpoint"],
    "properties": {
        "endpoint": {
            "type": "object",
            "required": ["name", "method", "path"]
        }
    }
}

# Apply grammar constraints during generation
processor = GrammarConstrainedProcessor(grammar, tokenizer)
logits = processor(input_ids, logits)
Full Example: patterns/grammar/example.py
Pattern 3: Style Transfer
Category: Content & Style Control
Use When: You need to transform content from one style to another
Problem
Content often needs to be transformed from one style to another while preserving core information. Manual rewriting is time-consuming and inconsistent.
Solution
Style Transfer uses AI to transform content between styles. Two approaches:
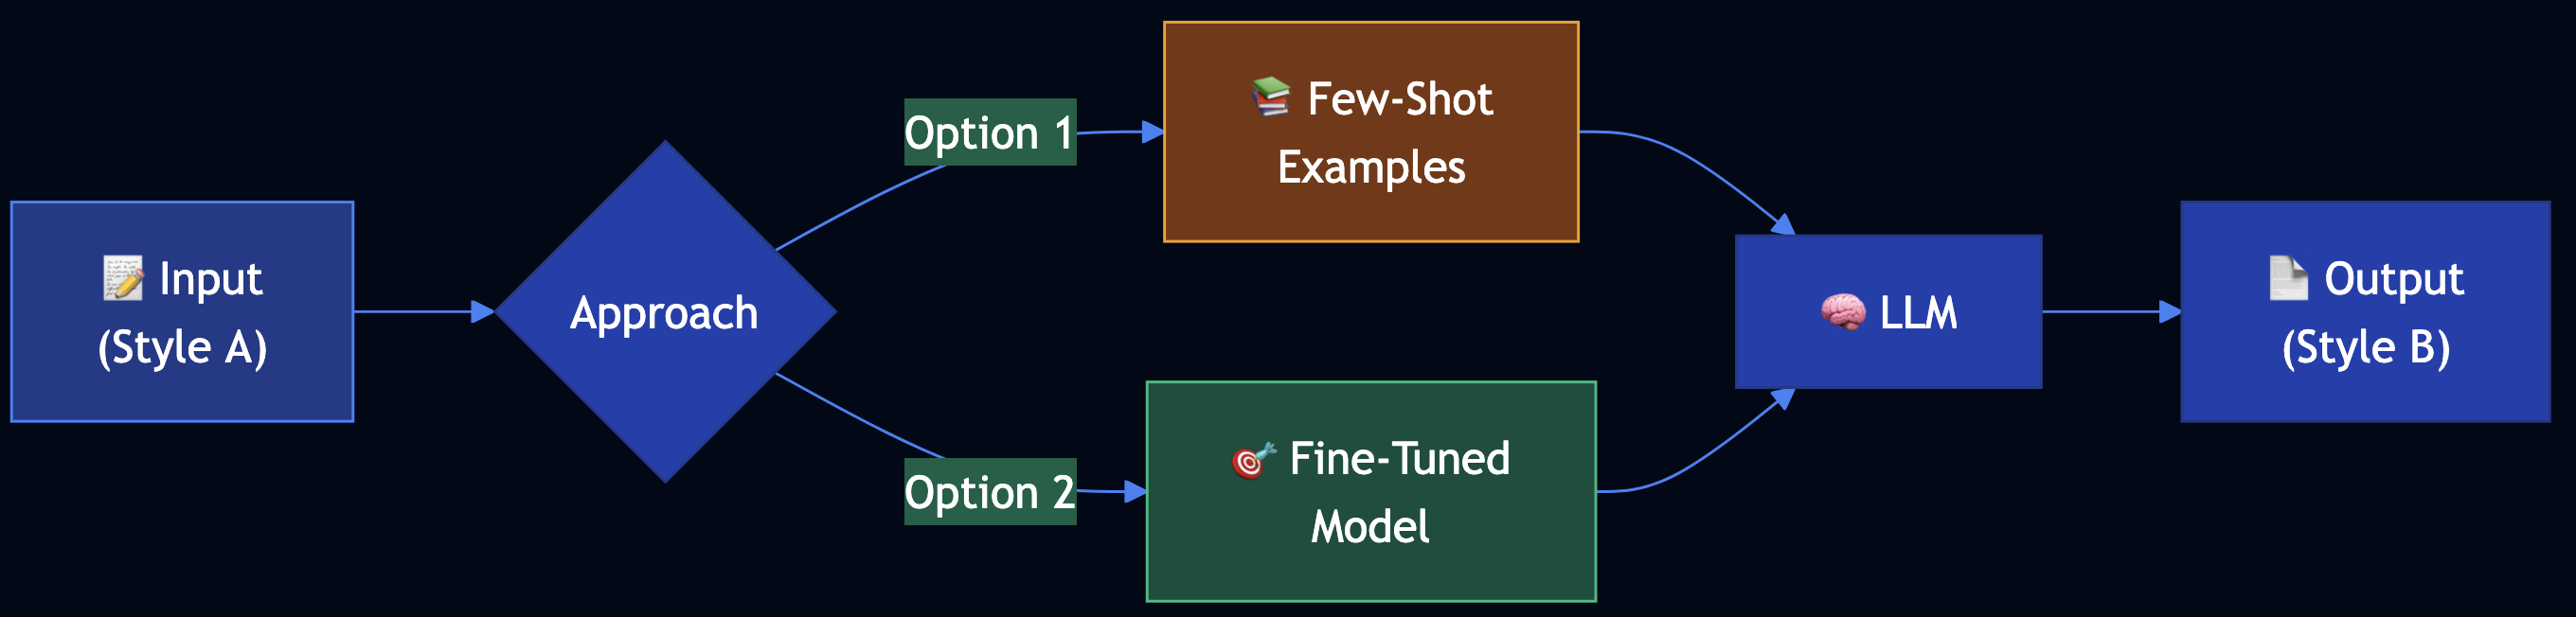
- Few-Shot Learning — Use example pairs in prompt (no training)
- Model Fine-Tuning — Fine-tune model on style pairs
Use Cases
- Professional communication (notes to emails)
- Content adaptation (academic to blog posts)
- Brand voice (maintain consistent tone)
- Platform adaptation (different social media styles)
Constraints: Few-shot limited by context window. Fine-tuning requires training data. Style consistency can vary.
Tradeoffs:
- ? Few-shot: Quick, no training needed
- ? Fine-tuning: Better consistency
- ?? Few-shot: May not capture nuances
- ?? Fine-tuning: Requires data collection
Code Snippet
# Option 1: Few-Shot Learning
examples = [
    StyleExample(
        input_text="urgent: need meeting minutes by friday",
        output_text="Subject: Urgent: Meeting Minutes Needed\n\nDear [Recipient],\n\n..."
    )
]

transfer = FewShotStyleTransfer(examples)
result = transfer.transfer_style("quick update: deadline moved")

# Option 2: Fine-Tuning
training_data = [
    {"prompt": "Convert notes to email", "completion": "Professional email..."}
]
fine_tuned_model = fine_tune_model(base_model, training_data)
Full Example: patterns/style-transfer/example.py
Pattern 4: Reverse Neutralization
Category: Content & Style Control
Use When: You need to generate content in a specific personal style that zero-shot can’t capture
Problem
When you need content in a specific, personalized style, zero-shot prompting fails because the model doesn’t know your unique writing style.
Solution
Reverse Neutralization uses a two-stage fine-tuning approach:
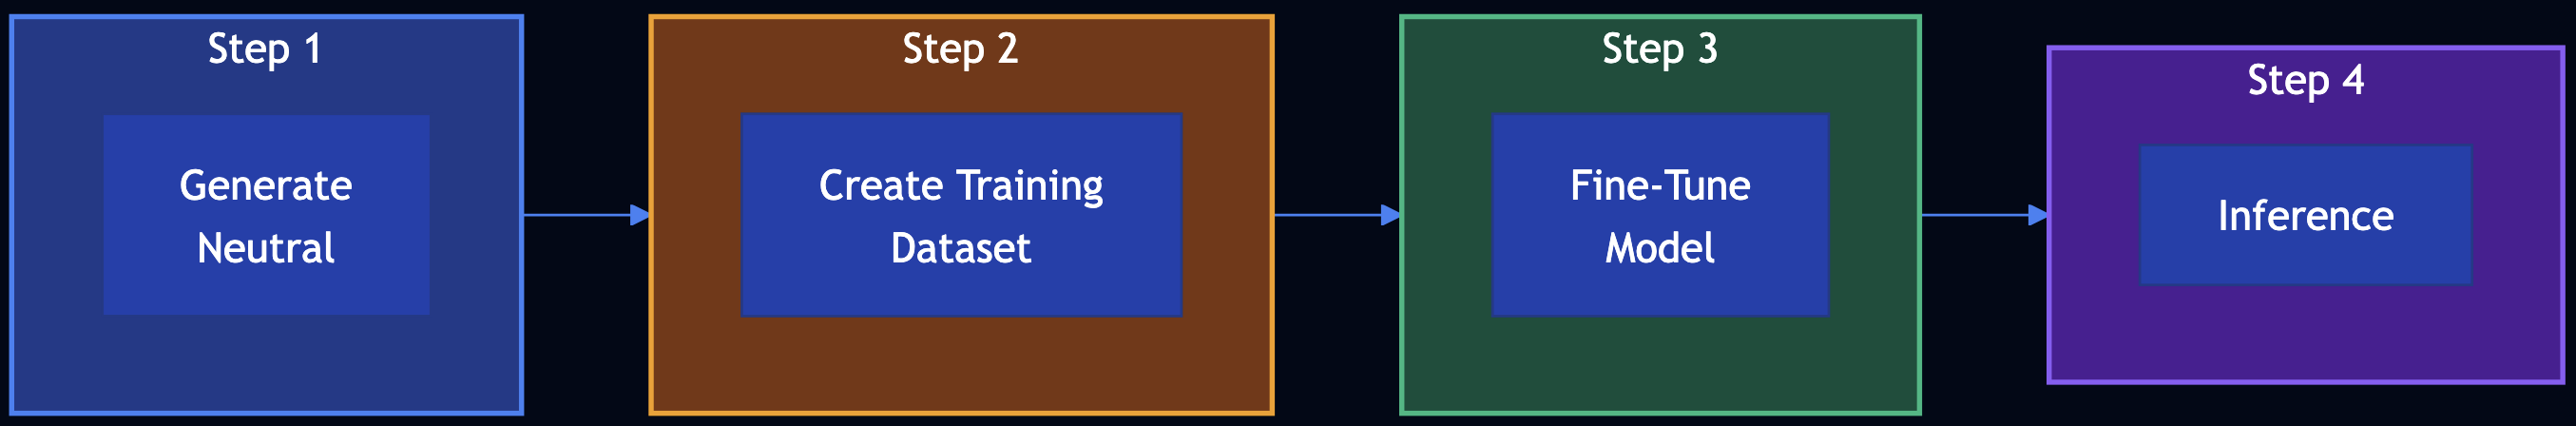
- Generate Neutral Form — Create content in neutral, standardized format
- Fine-Tune Style Converter — Train model to convert neutral ? your style
- Inference — Use fine-tuned model for style conversion
Use Cases
- Personal blog writing (technical content to your style)
- Brand voice (consistent voice across content)
- Documentation style (match organization’s style guide)
- Communication templates (your personal email style)
Constraints: Requires fine-tuning. Needs training data (neutral ? style pairs). Two-stage process.
Tradeoffs:
- ? Learns your specific style
- ? Consistent results
- ? Captures personal nuances
- ?? Requires data collection and training
- ?? Less flexible (need retraining to change style)
Code Snippet
# Step 1: Generate neutral form
neutral_generator = NeutralGenerator()
neutral = neutral_generator.generate_neutral("API Authentication")

# Step 2-3: Create training dataset and fine-tune
pairs = [
    StylePair(neutral="Technical doc...", styled="Your blog style...")
]
fine_tuned_model = fine_tune_on_preferences(pairs)

# Step 4: Use fine-tuned model
converter = StyleConverter(fine_tuned_model)
styled = converter.convert_to_style(neutral)
Full Example: patterns/reverse-neutralization/example.py
Pattern 5: Content Optimization
Category: Content & Style Control
Use When: You need to optimize content for specific performance goals (e.g., open rates, conversions)
Problem
When creating content for specific purposes, you need to optimize for outcomes. Traditional A/B testing is limited — it’s manual, time-consuming, and doesn’t learn patterns.
Solution
Content Optimization uses preference-based fine-tuning (DPO) to train a model to generate content that wins in comparisons:
- Generate Pair — Create two variations from same prompt
- Compare — Test and pick winner based on metrics
- Create Dataset — Collect preference pairs (prompt, chosen, rejected)
- Fine-Tune with DPO — Train model on preferences
- Use Optimized Model — Generate better-performing content
Use Cases
- Email marketing (optimize subject lines for open rates)
- E-commerce (optimize product descriptions for conversions)
- Social media (optimize posts for engagement)
- Landing pages (optimize copy for sign-ups)
Constraints: Requires preference data collection. DPO fine-tuning is computationally intensive. Need clear optimization metrics.
Tradeoffs:
- ? Learns from all comparisons
- ? Scales to many variations
- ? Model internalizes winning patterns
- ?? Requires training data (100+ pairs)
- ?? More complex than A/B testing
Code Snippet
# Step 1: Generate pair
generator = ContentGenerator()
var_a, var_b = generator.generate_pair("New product launch")

# Step 2: Compare and pick winner
comparator = ContentComparator(optimization_goal="open_rate")
pair = comparator.compare(ContentPair(prompt, var_a, var_b))

# Step 3-4: Create dataset and fine-tune
preferences = [PreferenceExample(prompt, chosen, rejected)]
dpo_trainer = PreferenceTuner()
optimized_model = dpo_trainer.fine_tune(preferences)

# Step 5: Use optimized model
optimized_generator = OptimizedContentGenerator(optimized_model)
result = optimized_generator.generate_optimized("Newsletter")
Full Example: patterns/content-optimization/example.py
Category 2: Adding Knowledge / RAG Stack
Patterns 6–12 augment LLMs with external knowledge sources for accessing up-to-date information, private data, and knowledge beyond the model’s training cutoff.
Pattern 6: Basic RAG (Retrieval-Augmented Generation)
Category: Adding Knowledge
Use When: You need to augment LLM responses with external knowledge sources
Problem
LLMs have three key knowledge limitations:
- Static Knowledge Cutoff — Trained on data up to a specific date
- Model Capacity Limits — Can’t store all knowledge in parameters
- Lack of Private Data Access — No access to internal documents or databases
Solution
Basic RAG uses trusted knowledge sources when generating LLM responses. Two pipelines:
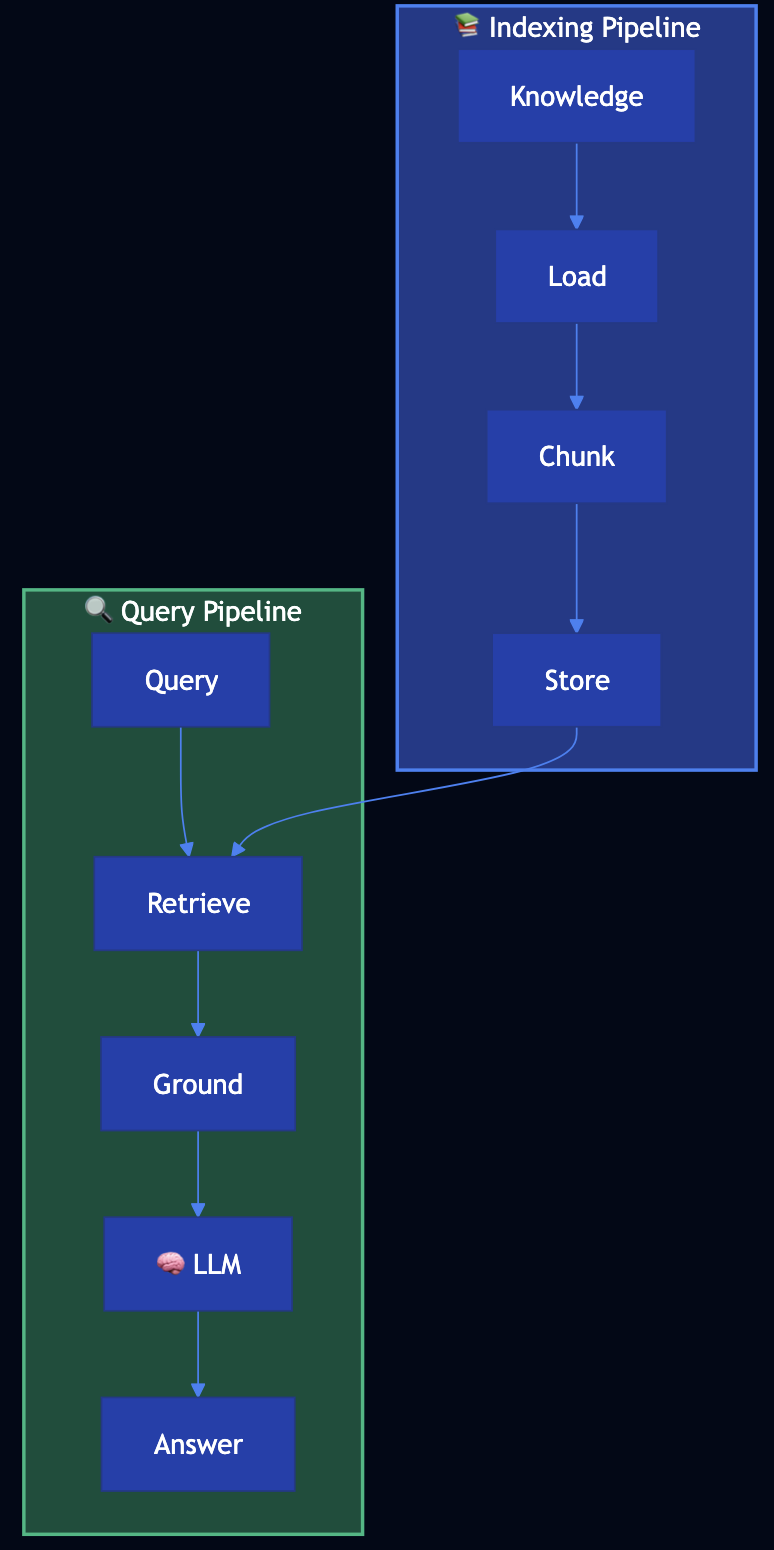
Indexing Pipeline (preparatory):
- Load documents ? Chunk into manageable pieces ? Store in searchable index
Retrieval-Generation Pipeline (runtime):
- Retrieve relevant chunks for query ? Ground prompt with retrieved context ? Generate response using LLM
Use Cases
- Product documentation (answer questions about features/APIs)
- Company knowledge base (query internal wikis/policies)
- Customer support (accurate answers from support docs)
- Research assistance (search through papers/documents)
- Legal/compliance (query regulations/guides)
Tradeoffs:
- ? Access to up-to-date and private knowledge
- ? Can handle large knowledge bases
- ? Transparent (can cite sources)
- ?? Requires indexing infrastructure
- ?? Retrieval quality affects response quality
Code Snippet
# INDEXING PIPELINE
loader = DocumentLoader()
documents = loader.load_documents("product_docs")

splitter = TextSplitter(chunk_size=500, chunk_overlap=50)
chunks = []
for doc in documents:
    chunks.extend(splitter.split_document(doc))

index = Index()
index.add_chunks(chunks)

# RETRIEVAL-GENERATION PIPELINE
retriever = Retriever(index, top_k=3)
generator = RAGGenerator(retriever)

result = generator.generate("How do I authenticate with the API?")
# Returns answer with source citations
Full Example: patterns/basic-rag/example.py
Pattern 7: Semantic Indexing
Category: Adding Knowledge
Use When: You need semantic understanding beyond keywords, or have complex content (images, tables, code)
Problem
Traditional keyword-based indexing has limitations:
- Semantic Understanding — Misses meaning (“car” and “automobile” are different keywords)
- Complex Content — Struggles with images, tables, code blocks, structured data
- Context Loss — Fixed-size chunking breaks up related content
- Multimedia — Can’t effectively index images, videos, or other media
Solution
Semantic Indexing uses embeddings (vector representations) to capture meaning:
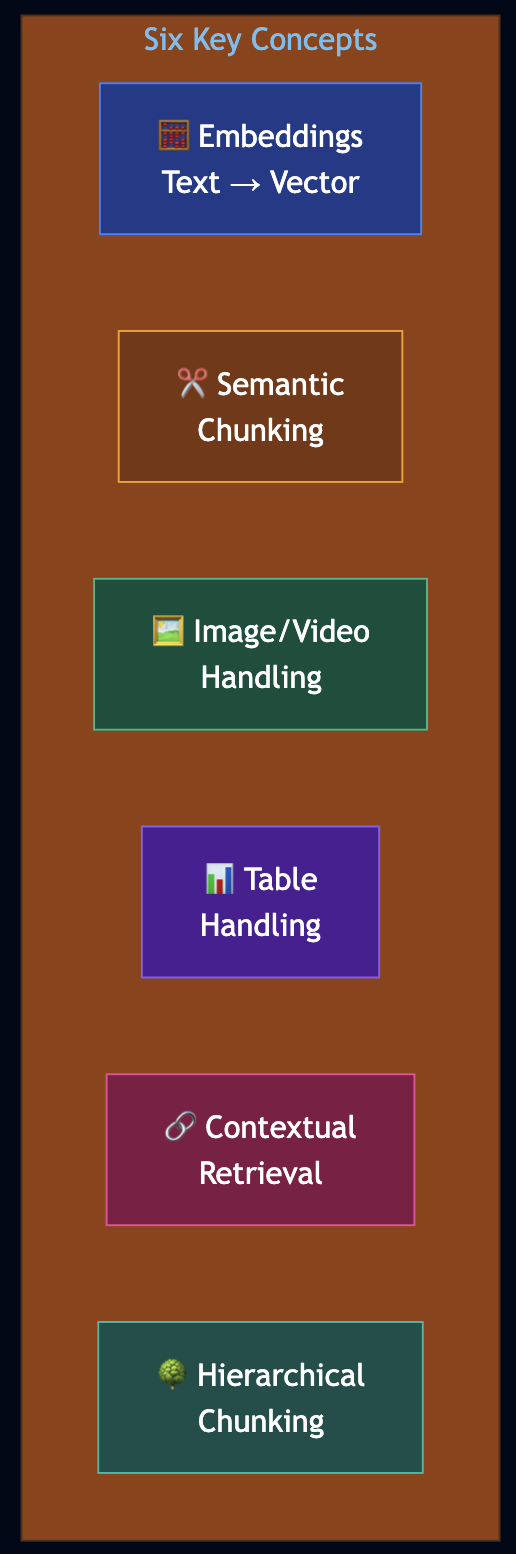
- Embeddings — Encode text/images into fixed vector representations for semantic meaning
- Semantic Chunking — Divide text into meaningful segments based on semantic content
- Image/Video Handling — Use OCR or vision models for embedding generation
- Table Handling — Organize and extract key information from structured data
- Contextual Retrieval — Preserve context with hierarchical chunking
- Hierarchical Chunking — Multi-level chunking (document ? section ? paragraph)
Use Cases
- Technical documentation (code examples, API docs, tutorials)
- Research papers (find by concept, not keywords)
- Product catalogs (search by features, not names)
- Multimedia content (images, videos with descriptions)
Code Snippet
# CONCEPT 1: EMBEDDINGS
from sentence_transformers import SentenceTransformer
import math

class EmbeddingGenerator:
    def __init__(self, model_name: str = "all-MiniLM-L6-v2"):
        self.model = SentenceTransformer(model_name)

    def generate_embedding(self, text: str) -> List[float]:
        return self.model.encode(text).tolist()

    def cosine_similarity(self, vec1: List[float], vec2: List[float]) -> float:
        dot_product = sum(a * b for a, b in zip(vec1, vec2))
        magnitude1 = math.sqrt(sum(a * a for a in vec1))
        magnitude2 = math.sqrt(sum(a * a for a in vec2))
        return dot_product / (magnitude1 * magnitude2) if magnitude1 * magnitude2 > 0 else 0.0

# CONCEPT 2: SEMANTIC CHUNKING
@dataclass
class SemanticChunk:
    id: str
    text: str
    embedding: Optional[List[float]] = None
    chunk_type: str = "text"  # text, code, table, image
    parent_id: Optional[str] = None
    children_ids: List[str] = None

class SemanticChunker:
    def chunk_by_structure(self, content: str) -> List[SemanticChunk]:
        """Chunk respecting document structure (headers, sections, paragraphs)."""
        chunks = []
        sections = re.split(r'\n(#{2,3}\s+.+?)\n', content)
        current_section = None
        chunk_index = 0
        for i, part in enumerate(sections):
            if part.strip().startswith('#'):
                if current_section:
                    chunks.append(SemanticChunk(id=f"chunk-{chunk_index}", text=current_section))
                    chunk_index += 1
                current_section = part + "\n"
            else:
                current_section = (current_section or "") + part
        if current_section:
            chunks.append(SemanticChunk(id=f"chunk-{chunk_index}", text=current_section))
        return chunks

# CONCEPTS 5 & 6: HIERARCHICAL CHUNKING & CONTEXTUAL RETRIEVAL
class ContextualRetriever:
    def retrieve_with_context(self, query: str, top_k: int = 3,
                              include_context: bool = True) -> List[SemanticChunk]:
        query_embedding = self.embedding_generator.generate_embedding(query)
        scored_chunks = []
        for chunk in self.chunks.values():
            if chunk.embedding:
                similarity = self.embedding_generator.cosine_similarity(
                    query_embedding, chunk.embedding
                )
                scored_chunks.append((similarity, chunk))
        scored_chunks.sort(key=lambda x: x[0], reverse=True)
        top_chunks = [chunk for _, chunk in scored_chunks[:top_k]]
        if include_context:
            contextual_chunks = []
            for chunk in top_chunks:
                contextual_chunks.append(chunk)
                # Add parent for context
                if chunk.parent_id and chunk.parent_id in self.chunks:
                    parent = self.chunks[chunk.parent_id]
                    if parent not in contextual_chunks:
                        contextual_chunks.append(parent)
                # Add children for detail
                for child_id in (chunk.children_ids or []):
                    if child_id in self.chunks:
                        child = self.chunks[child_id]
                        if child not in contextual_chunks:
                            contextual_chunks.append(child)
            return contextual_chunks
        return top_chunks
Full Example: patterns/semantic-indexing/example.py
Pattern 8: Indexing at Scale
Category: Adding Knowledge
Use When: Your RAG system needs to handle large-scale knowledge bases with evolving, time-sensitive information
Problem
RAG systems in production face critical challenges as knowledge bases grow:
- Data Freshness — Recent findings obsolete old guidelines
- Contradictory Content — Multiple versions of information cause confusion
- Outdated Content — Old information remains in index, leading to incorrect answers
Solution
Indexing at Scale uses metadata and temporal awareness:
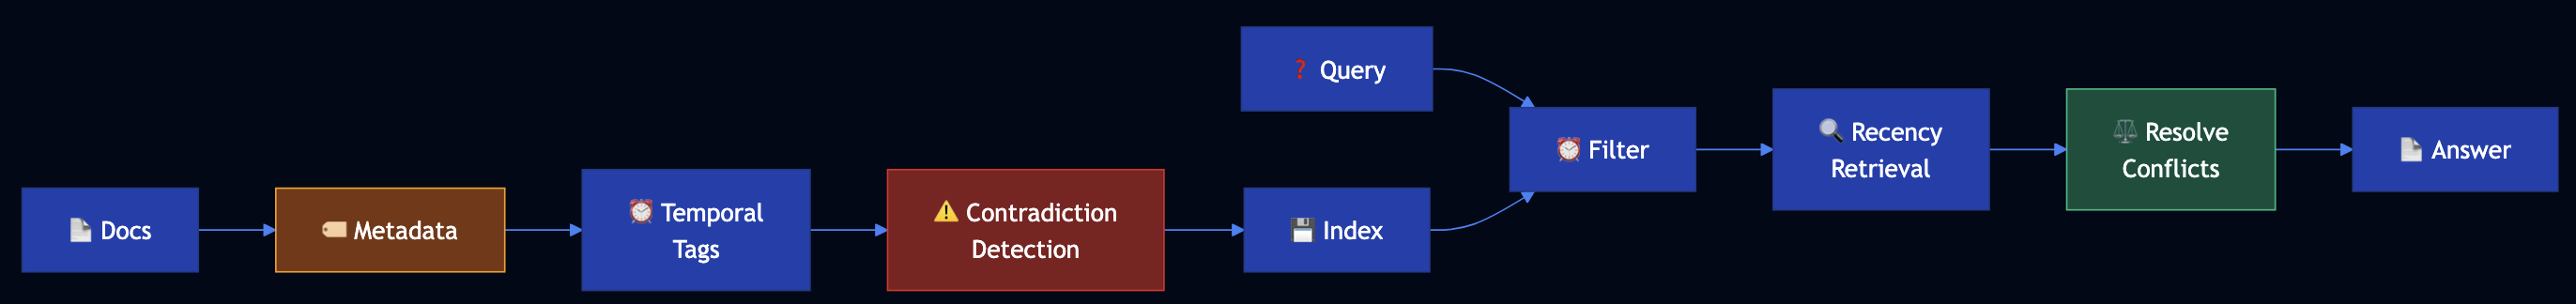
- Document Metadata — Use timestamps, version numbers, source information
- Temporal Tagging — Tag chunks with creation/update dates, expiration dates
- Contradiction Detection — Identify and prioritize newer over older contradictory content
- Outdated Content Management — Automatically deprecate or flag outdated information
Code Snippet
@dataclass
class TemporalMetadata:
    created_at: datetime
    updated_at: datetime
    expires_at: Optional[datetime] = None
    version: str = "1.0"
    source: str = ""
    authority: str = "medium"  # high, medium, low

class ContradictionDetector:
    def _resolve_contradiction(self, chunk_a, chunk_b):
        # Prefer newer date
        if chunk_a.metadata.updated_at > chunk_b.metadata.updated_at:
            return "chunk_a"
        # If same date, prefer higher authority
        if chunk_a.metadata.authority > chunk_b.metadata.authority:
            return "chunk_a"
        return "chunk_b"

# KNOWLEDGE BASE WITH TEMPORAL AWARENESS
kb = HealthcareGuidelinesKB()
kb.add_guideline(
    content="CDC recommends masks required in public",
    source="CDC",
    date=datetime(2021, 7, 15),
    authority="high"
)

result = kb.query("Should I wear a mask?", prefer_recent=True)
# Returns most recent guidelines, flags contradictions
Full Example: patterns/indexing-at-scale/example.py
Pattern 9: Index-Aware Retrieval
Category: Adding Knowledge
Use When: Basic RAG fails due to vocabulary mismatches, fine details, or holistic answers requiring multiple concepts
Problem
Users ask questions in natural language (“How do I log in?”), but your API documentation uses technical terminology (“OAuth 2.0 authentication”, “access token”). Basic RAG fails because “log in” ? “authentication” ? “OAuth 2.0”.
Solution
Index-Aware Retrieval uses four advanced retrieval techniques:
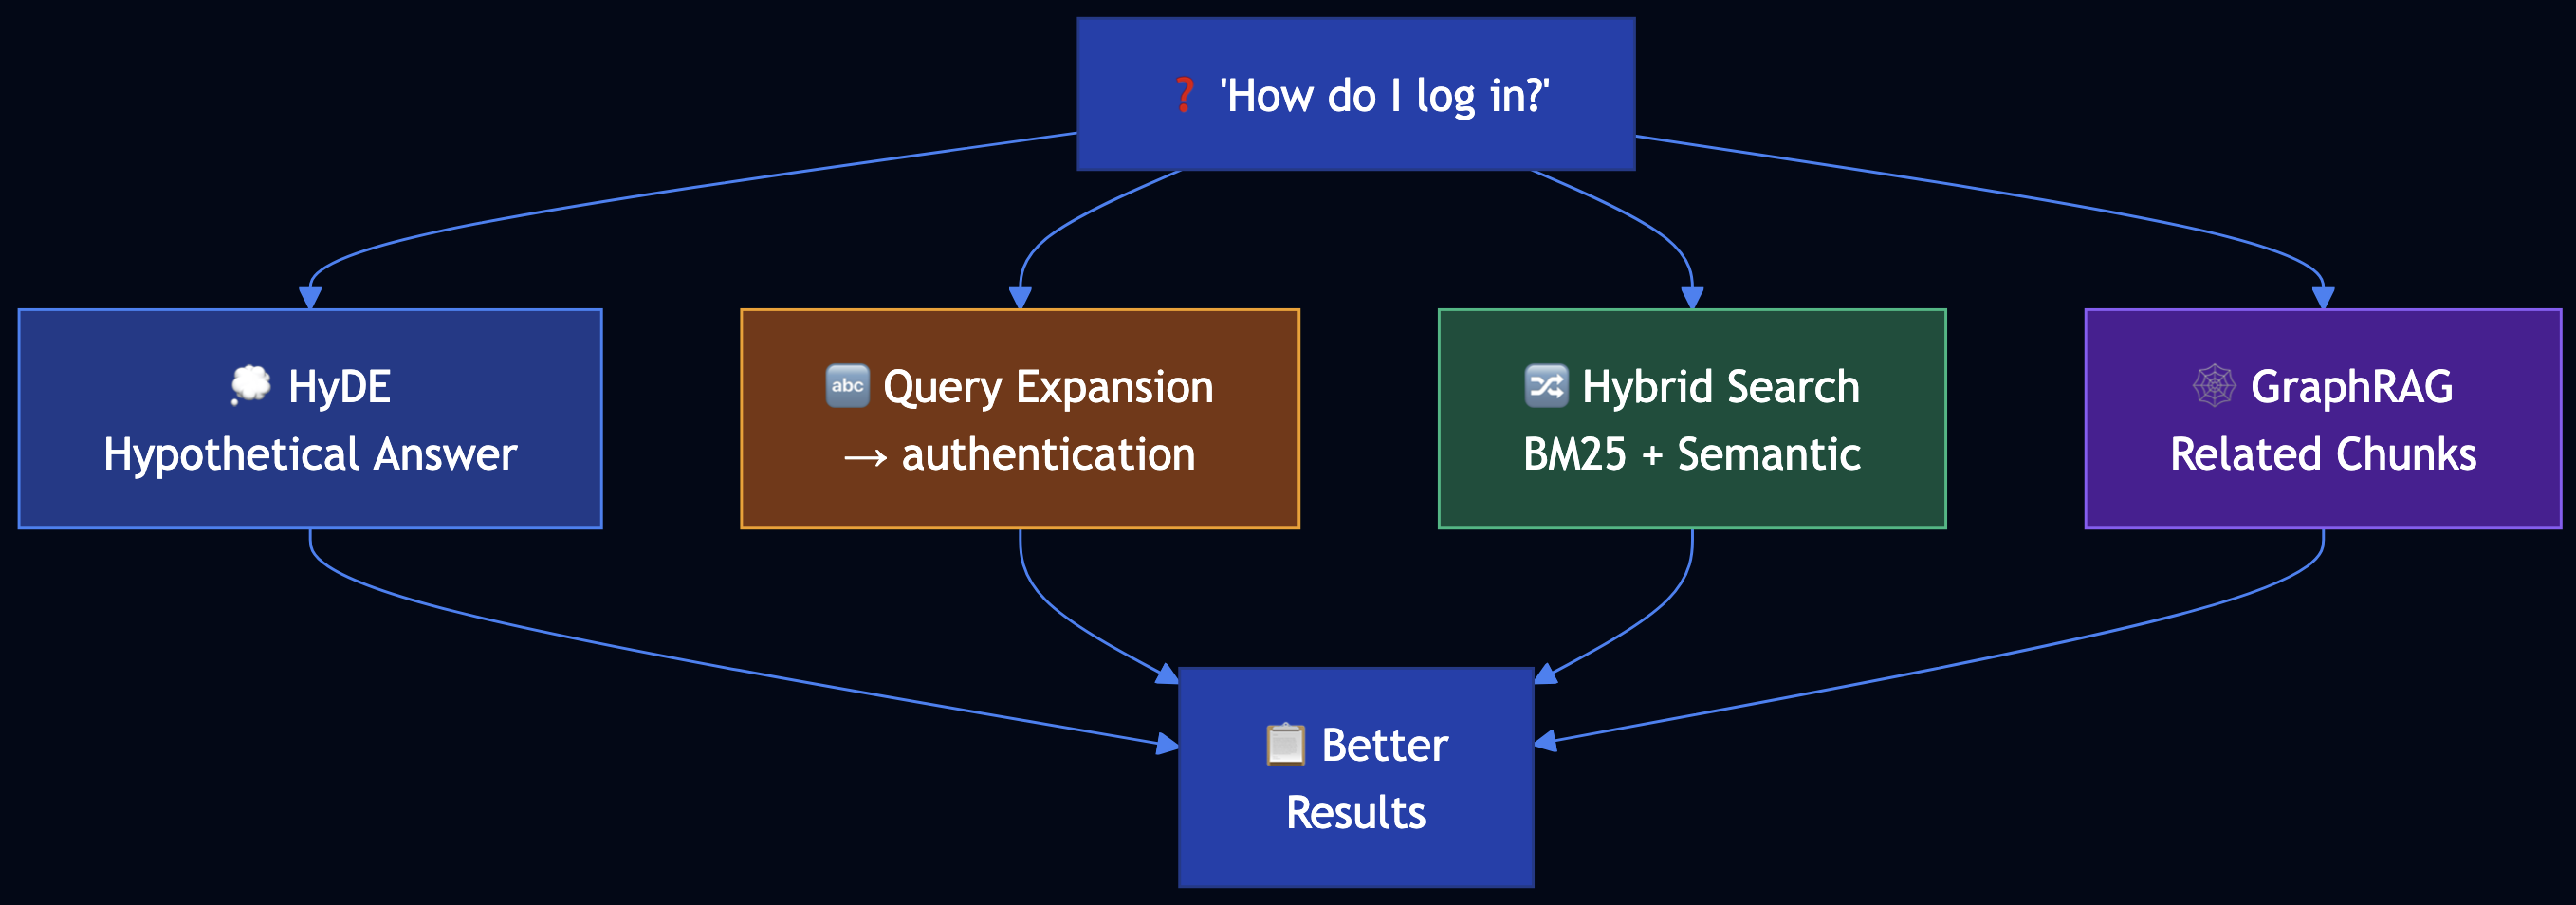
- Hypothetical Document Embedding (HyDE) — Generate hypothetical answer first, then match chunks to that answer
- Query Expansion — Translate user terms to technical terms used in chunks
- Hybrid Search — Combine keyword (BM25) and semantic (embedding) search with weighted average
- GraphRAG — Store documents in graph database, retrieve related chunks after finding initial match
Code Snippet
# TECHNIQUE 1: HYPOTHETICAL DOCUMENT EMBEDDING (HyDE)
class HyDEGenerator:
    def retrieve_with_hyde(self, query: str, chunks: List[DocumentChunk], top_k: int = 3):
        # Step 1: Generate hypothetical answer
        hypothetical_answer = self.generate_hypothetical_answer(query)
        # "To authenticate, use OAuth 2.0 access token..."

        # Step 2: Embed hypothetical answer (not original query)
        hyde_embedding = embedding_generator.generate_embedding(hypothetical_answer)

        # Step 3: Find chunks similar to hypothetical answer
        scored_chunks = []
        for chunk in chunks:
            similarity = cosine_similarity(hyde_embedding, chunk.embedding)
            scored_chunks.append((chunk, similarity))

        return sorted(scored_chunks, key=lambda x: x[1], reverse=True)[:top_k]

# TECHNIQUE 2: QUERY EXPANSION
class QueryExpander:
    def expand_query(self, query: str) -> str:
        term_translations = {
            "log in": ["authentication", "oauth", "access token"],
            "error": ["error code", "status code", "exception"]
        }
        expanded_terms = [query]
        for user_term, tech_terms in term_translations.items():
            if user_term in query.lower():
                expanded_terms.extend(tech_terms)
        return " ".join(expanded_terms)

# TECHNIQUE 3: HYBRID SEARCH (BM25 + Semantic)
class HybridRetriever:
    def retrieve(self, query: str, top_k: int = 5):
        bm25_score = bm25_scorer.score(query, chunk)
        semantic_score = cosine_similarity(query_embedding, chunk.embedding)
        # ? = 0.4 means 40% BM25, 60% semantic
        hybrid_score = 0.4 * bm25_score + 0.6 * semantic_score
        return sorted_chunks_by_score[:top_k]

# TECHNIQUE 4: GRAPHRAG
class GraphRAG:
    def retrieve_related(self, initial_chunk_id: str, depth: int = 1):
        related_ids = graph[initial_chunk_id]
        for _ in range(depth - 1):
            next_level = [graph[rid] for rid in related_ids]
            related_ids.extend(next_level)
        return [chunks[cid] for cid in related_ids]
Full Example: patterns/index-aware-retrieval/example.py
Pattern 10: Node Postprocessing
Category: Adding Knowledge
Use When: Retrieved chunks have issues like ambiguous entities, conflicting content, obsolete information, or are too verbose
Problem
Your RAG system retrieves legal document chunks with issues: ambiguous entities (“Apple” could be company or fruit), conflicting interpretations of the same law, obsolete regulations superseded by new ones, and verbose chunks with only small relevant sections.
Solution
Node Postprocessing improves retrieved chunks through a pipeline:

- Reranking — Use more accurate models (like BGE) to rerank chunks
- Hybrid Search — Combine BM25 and semantic retrieval
- Query Expansion and Decomposition — Expand queries and break into sub-queries
- Filtering — Remove obsolete, conflicting, or irrelevant chunks
- Contextual Compression — Extract only relevant parts from verbose chunks
- Disambiguation — Resolve ambiguous entities and clarify context
Code Snippet
# TECHNIQUE 1: RERANKING (BGE-style Cross-Encoder)
# In production: from sentence_transformers import CrossEncoder
# model = CrossEncoder('BAAI/bge-reranker-base')

# TECHNIQUE 5: CONTEXTUAL COMPRESSION
class ContextualCompressor:
    def compress(self, chunk: DocumentChunk, query: str, max_length: int = 200):
        query_words = set(query.lower().split())
        sentences = chunk.content.split('.')
        relevant_sentences = [
            s for s in sentences
            if query_words & set(s.lower().split())
        ]
        compressed_content = '. '.join(relevant_sentences[:3]) + '.'
        return DocumentChunk(id=chunk.id + "_compressed", content=compressed_content[:max_length])

# TECHNIQUE 6: DISAMBIGUATION
class Disambiguator:
    def disambiguate(self, chunks: List[DocumentChunk], query: str):
        entity_contexts = {
            "apple": {
                "company": ["technology", "iphone", "corporate"],
                "fruit": ["nutrition", "eating", "food"]
            }
        }
        query_words = set(query.lower().split())
        for chunk in chunks:
            for entity, contexts in entity_contexts.items():
                if entity in chunk.content.lower():
                    entity_type = determine_from_context(entity, query_words, chunk.content)
                    if entity_type:
                        chunk.entities.append(f"{entity}:{entity_type}")
        return chunks

# COMPLETE POSTPROCESSING PIPELINE
def query_with_postprocessing(question: str):
    expanded = query_processor.expand_query(question)
    candidates = hybrid_retriever.retrieve(expanded, top_k=10)
    filtered = filter.filter_obsolete([c for c, _ in candidates])
    filtered = filter.filter_by_relevance(candidates, threshold=0.3)
    reranked = reranker.rerank(question, filtered, top_k=5)
    disambiguated = disambiguator.disambiguate([c for c, _ in reranked], question)
    compressed = [compressor.compress(c, question) for c in disambiguated]
    return compressed
Full Example: patterns/node-postprocessing/example.py
Pattern 11: Trustworthy Generation
Category: Adding Knowledge
Use When: RAG systems need to build user trust by preventing hallucination, providing citations, and detecting out-of-domain queries
Problem
Users lose trust because the system answers questions outside its knowledge domain, answers lack citations, and it provides confident answers when retrieval actually failed.
Solution
Trustworthy Generation builds user trust through multiple mechanisms:
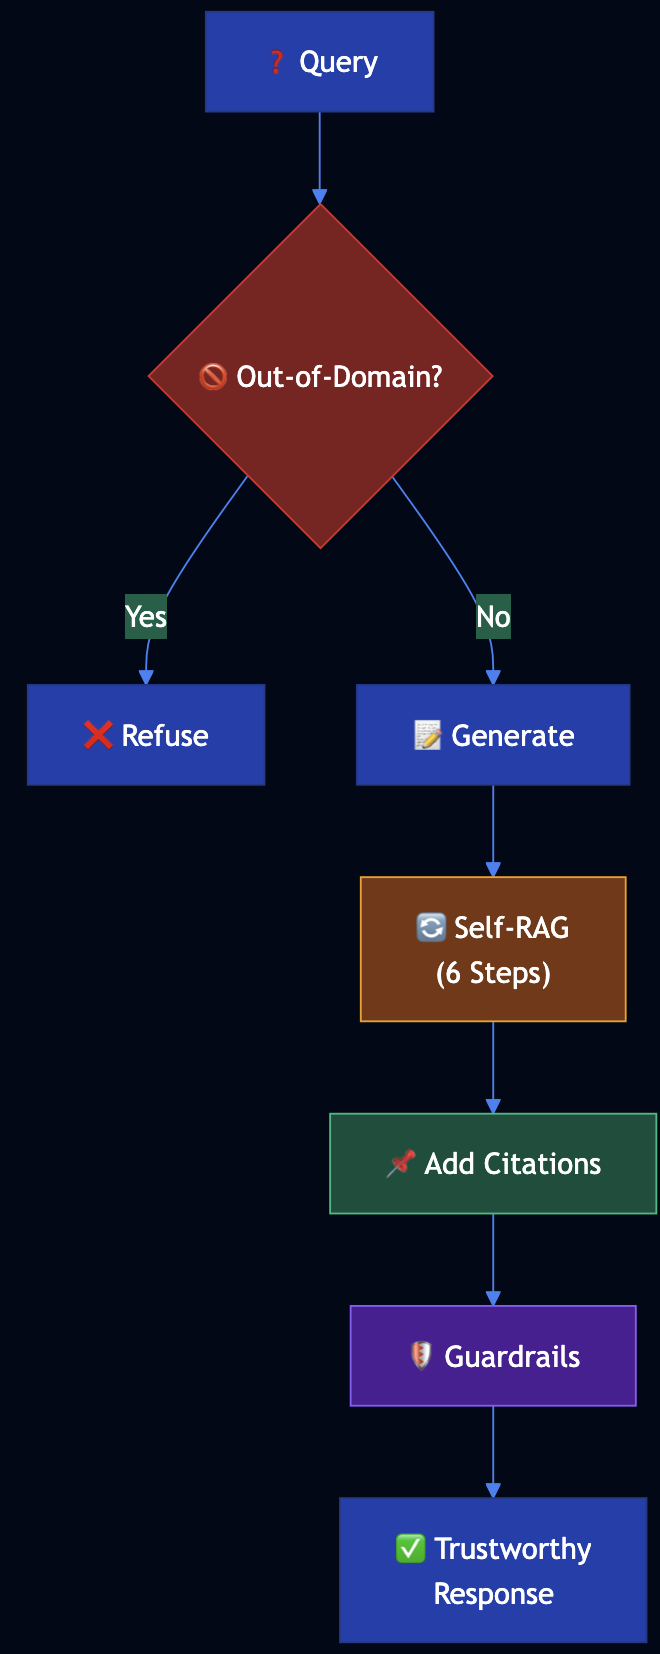
- Out-of-Domain Detection — Detect when knowledge base doesn’t contain relevant information
- Embedding Distance Checking — Measure similarity between query and retrieved chunks
- Citations — Provide source citations for all factual claims
- Self-RAG Workflow — 6-step self-reflective process to verify responses
- Guardrails — Prevent generation of unsafe or unreliable content
Code Snippet
# OUT-OF-DOMAIN DETECTION
class OutOfDomainDetector:
    def is_out_of_domain(self, query: str, chunks: List[DocumentChunk]) -> Tuple[bool, str]:
        if chunks:
            query_embedding = embedding_generator.generate_embedding(query)
            min_distance = min([
                1 - cosine_similarity(query_embedding, chunk.embedding)
                for chunk in chunks
            ])
            if min_distance > threshold:
                return True, "Query too far from knowledge base"
        if not has_domain_keywords(query):
            return True, "Query lacks domain-specific terminology"
        if not chunks:
            return True, "No relevant chunks found"
        return False, ""

# SELF-RAG WORKFLOW (6 Steps)
class SelfRAGProcessor:
    def process(self, query: str, retrieved_chunks: List[DocumentChunk]):
        # STEP 1: Generate initial response
        initial_response = generate_initial_response(query, retrieved_chunks)
        # STEP 2: Chunk the response
        response_chunks = chunk_response(initial_response)
        # STEP 3: Check whether chunk needs citation
        for chunk in response_chunks:
            chunk.needs_citation = needs_citation(chunk.text)
        # STEP 4: Lookup sources
        for chunk in response_chunks:
            if chunk.needs_citation:
                chunk.sources = lookup_sources(chunk.text, retrieved_chunks)
        # STEP 5: Incorporate citations
        final_response = incorporate_citations(response_chunks)
        # STEP 6: Add warnings
        warnings = generate_warnings(response_chunks)
        return {"response": final_response, "warnings": warnings}

# COMPLETE TRUSTWORTHY GENERATION PIPELINE
def query_with_trustworthiness(question: str):
    is_ood, reason = out_of_domain_detector.is_out_of_domain(question, chunks)
    if is_ood:
        return {"response": f"Cannot answer: {reason}", "out_of_domain": True}
    result = self_rag.process(question, retrieved_chunks)
    passed, reason = guardrails.check(question, result, retrieved_chunks)
    if not passed:
        result["response"] = f"Cannot provide reliable answer: {reason}"
    return result
Full Example: patterns/trustworthy-generation/example.py
Pattern 12: Deep Search
Category: Adding Knowledge
Use When: Complex information needs require iterative retrieval, multi-hop reasoning, or comprehensive research across multiple sources
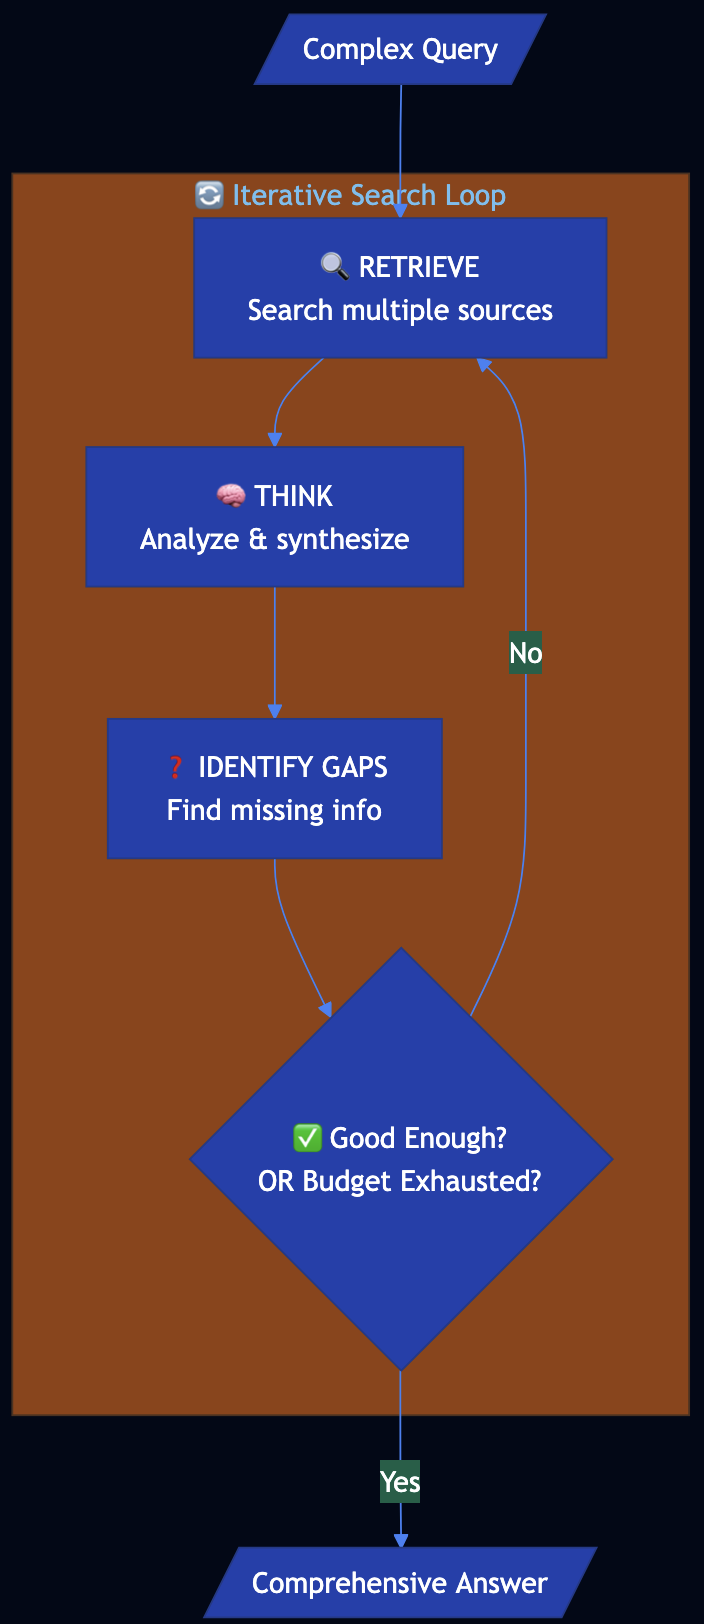
Problem
Investment analysts need comprehensive research on companies/industries. Basic RAG retrieves a few chunks and provides incomplete answers. They need a system that iteratively explores multiple sources, identifies gaps, and follows up on missing information.
Solution
Deep Search uses an iterative loop that retrieves and thinks until a good enough answer is found or a time/cost budget is exhausted:
Code Snippet
class DeepSearchOrchestrator:
    def __init__(self, budget: Budget):
        self.retriever = MultiSourceRetriever()  # Web, APIs, knowledge bases
        self.reasoner = LLMReasoner()
        self.budget = budget  # Time/cost constraints

    def search(self, query: str, depth: int = 2) -> DeepSearchResult:
        root_section = self._create_section(query)
        sections = [root_section]
        sections_to_expand = [root_section]
        current_depth = 0

        while current_depth < depth:
            current_depth += 1
            exhausted, reason = self.budget.is_exhausted()
            if exhausted:
                break
            next_sections = []
            for section in sections_to_expand:
                gaps = self.reasoner.identify_gaps(query, section.answer, section.sources)
                follow_ups = self.reasoner.generate_follow_ups(query, gaps)
                for follow_up in follow_ups:
                    subsection = self._create_section(follow_up)
                    section.subsections.append(subsection)
                    sections.append(subsection)
                    next_sections.append(subsection)
            sections_to_expand = next_sections
            is_good_enough, quality = self.reasoner.assess_answer_quality(
                query, root_section.answer, sections
            )
            if is_good_enough:
                break

        final_answer = self.reasoner.final_synthesis(query, sections)
        return DeepSearchResult(query, final_answer, sections, self.all_sources)

@dataclass
class Budget:
    max_iterations: int = 5
    max_time_seconds: float = 60.0
    max_cost_dollars: float = 1.0

    def is_exhausted(self) -> Tuple[bool, str]:
        if self.iterations_used >= self.max_iterations:
            return True, "max_iterations"
        if self.time_used >= self.max_time_seconds:
            return True, "max_time"
        if self.cost_used >= self.max_cost_dollars:
            return True, "max_cost"
        return False, ""

# USAGE
analyst = MarketResearchAnalyst()
result = analyst.research(
    query="What factors should I consider when evaluating TechCorp as an investment?",
    max_iterations=10,
    max_time_seconds=30.0
)
Full Example: patterns/deep-search/example.py
Category 3: LLM Reasoning
Patterns 13–16 address reasoning and task specialization: how to get step-by-step or multi-path reasoning from LLMs.
Pattern 13: Chain of Thought (CoT)
Category: LLM Reasoning
Use When: Problems require multistep reasoning, logical deduction, or an auditable reasoning trace
Problem
Foundational models suffer from critical limitations on math, logical deduction, and sequential reasoning:
- Zero-shot often fails when the problem requires multistep reasoning
- Black-box answers with no insight into how the conclusion was reached
- Misinterpretation of rules
Solution
Chain of Thought (CoT) prompts request a step-by-step reasoning process before the final answer. Three variants:
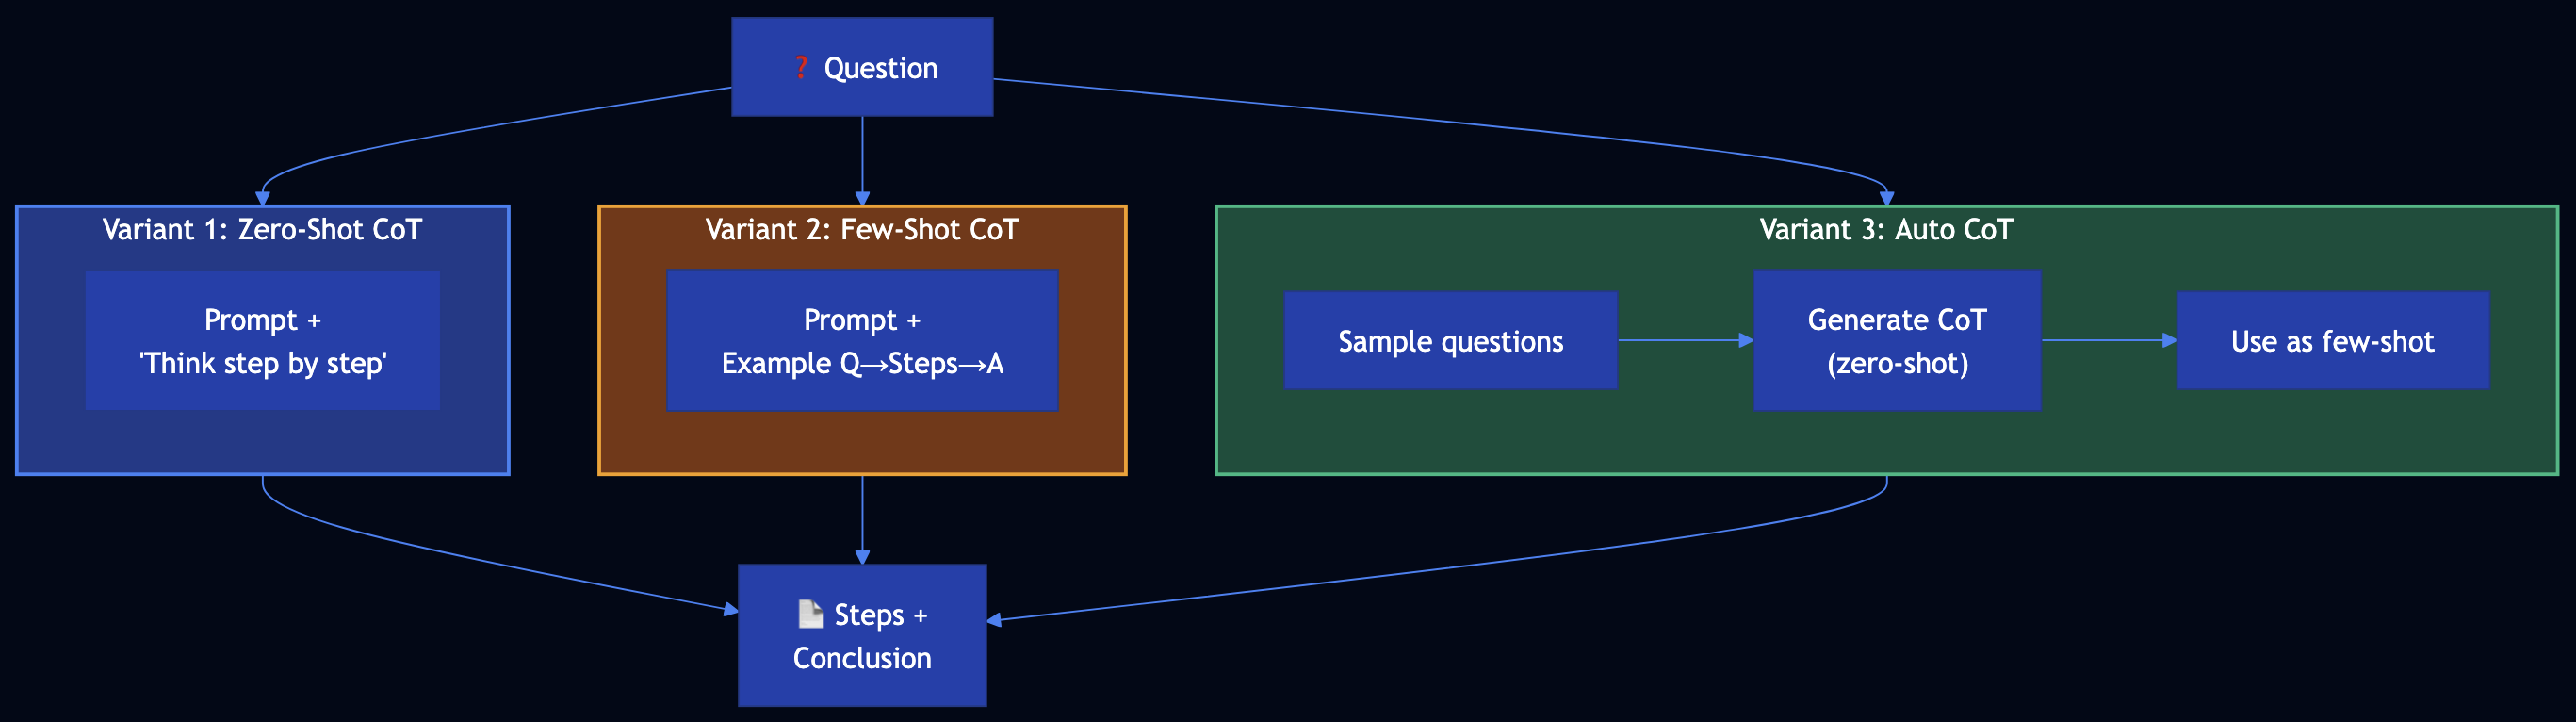
- Zero-shot CoT — Append “Think step by step” (no examples)
- Few-shot CoT — Provide example (question ? step-by-step reasoning ? answer). RAG gives fish; few-shot CoT shows how to fish.
- Auto CoT — Sample questions ? generate reasoning for each with zero-shot CoT ? use as few-shot examples for the actual query
Code Snippet
# VARIANT 1: ZERO-SHOT COT
ZERO_SHOT_COT_SUFFIX = "\n\nThink step by step. Show your reasoning and then state the final conclusion."

def zero_shot_cot(policy: str, case_description: str, question: str, llm=None) -> CoTResult:
    prompt = f"{policy}\n\nCase: {case_description}\n\nQuestion: {question}{ZERO_SHOT_COT_SUFFIX}"
    full_response = llm(prompt)
    return CoTResult(question=question, reasoning=..., conclusion=..., variant="zero_shot")

# VARIANT 2: FEW-SHOT COT — "show how to fish"
FEW_SHOT_EXAMPLES = """
Example 1:
Q: Customer purchased 10 days ago, unopened, has receipt. Eligible for full refund?
A: Step 1: Within 30 days? Yes. Step 2: Unopened? Yes. Step 3: Receipt? Yes.
   Conclusion: Yes, full refund.
"""
def few_shot_cot(policy: str, case_description: str, question: str, llm=None) -> CoTResult:
    prompt = f"{policy}\n\n{FEW_SHOT_EXAMPLES}\n\nNew question:\nQ: {question}\n\nCase: {case_description}\n\nA:"
    return ...

# VARIANT 3: AUTO COT — build few-shot automatically
def auto_cot(policy: str, case_description: str, question: str, num_demos: int = 2, llm=None) -> CoTResult:
    demos = []
    for sample_q in question_pool[:num_demos]:
        response = llm(f"{policy}\n\nQuestion: {sample_q}\n\nThink step by step.")
        demos.append(f"Q: {sample_q}\nA:\n{response}\n")
    prompt = f"{policy}\n\n" + "\n".join(demos) + f"\n\nNew question:\nQ: {question}\n\nCase: {case_description}\n\nA:"
    return ...

# REFUND ELIGIBILITY ADVISOR
advisor = RefundEligibilityAdvisor(policy=REFUND_POLICY)
result = advisor.check_eligibility(case, variant="few_shot")  # zero_shot | few_shot | auto_cot
# result.reasoning, result.conclusion
Full Example: patterns/chain-of-thought/example.py
Pattern 14: Tree of Thoughts (ToT)
Category: LLM Reasoning
Use When: Strategic tasks with multiple plausible paths; single linear CoT is insufficient
Problem
Many tasks that demand strategic thinking cannot be solved by a single multistep reasoning path:
- Single-path limitation — CoT follows one sequence; if that path is wrong, the answer suffers
- Branching decisions — Multiple plausible next steps
- Need for exploration — Best solution often requires exploring several directions
Solution
Tree of Thoughts treats problem-solving as tree search with four components:
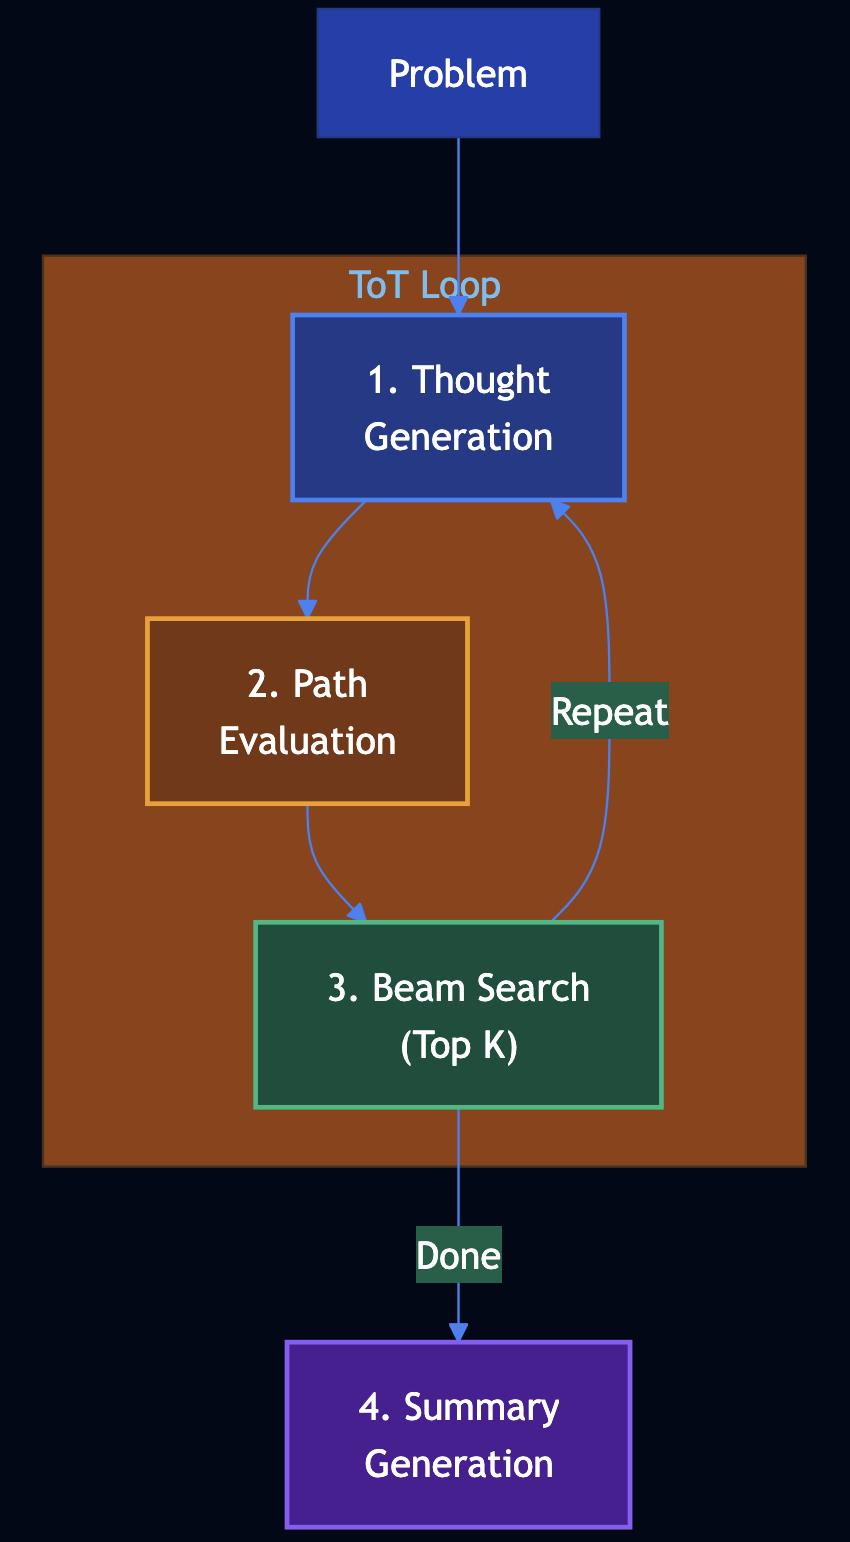
- Thought generation — From current state, generate N possible next steps
- Path evaluation — Score each partial solution (0–100) for promise
- Beam search (top K) — Keep only the top K states; prune the rest
- Summary generation — Produce a concise summary and answer from the best path
Code Snippet
class TreeOfThoughts:
    def generate_thoughts(self, state: str, step: int, problem: str) -> List[str]:
        """Generate N possible next thoughts from current state."""
        return thoughts

    def evaluate_state(self, state: str, problem: str) -> float:
        """Score path promise (0-1). Correctness, progress, potential."""
        return score

    def solve(self, problem: str) -> ToTResult:
        beam = [(0.5, initial_state, [], 0)]
        for step in range(1, self.max_steps + 1):
            candidates = []
            for score, state, path, _ in beam:
                thoughts = self.generate_thoughts(state, step, problem)
                for thought in thoughts:
                    new_state = state + "\nStep N: " + thought
                    new_score = self.evaluate_state(new_state, problem)
                    candidates.append((new_score, new_state, path + [thought], step))
            beam = sorted(candidates, key=lambda x: -x[0])[:self.beam_width]
        best_state, best_path = beam[0]
        summary = self.generate_summary(problem, best_state)
        return ToTResult(..., solution_summary=summary, reasoning_path=best_path)

# INCIDENT ROOT-CAUSE ANALYZER
analyzer = IncidentRootCauseAnalyzer()
result = analyzer.analyze("API latency spiked; DB, cache, dependencies in use.")
# result.solution_summary, result.reasoning_path
Full Example: patterns/tree-of-thoughts/example.py
Pattern 15: Adapter Tuning
Category: LLM Reasoning
Use When: You need a foundation model to perform a specialized task with a small dataset and want to keep base weights frozen while training only a small adapter (e.g., LoRA)
Problem
Incoming tickets must be routed to billing, technical, sales, or general. Prompt-only classification can be brittle. Adapter tuning trains a small task-specific head on a few hundred labeled tickets while keeping the foundation model frozen.
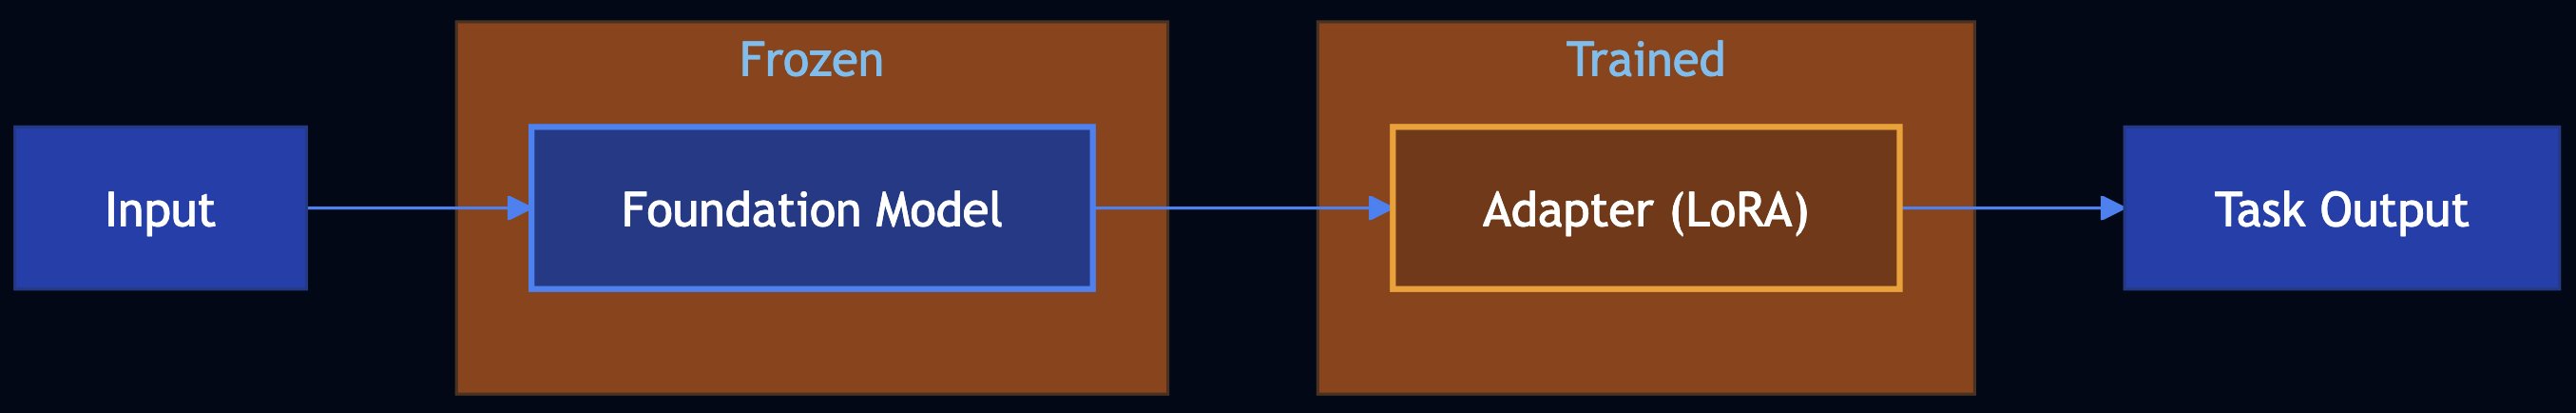
Solution
Adapter tuning (PEFT) has three key aspects:
- Teaches the foundation model a specialized task — Train on input-output pairs
- Foundation weights frozen; only a small adapter is updated — LoRA or adapter layers are trained
- Training dataset can be smaller — Often a few hundred to a few thousand high-quality pairs suffice
Code Snippet
class TicketIntentRouter:
    def __init__(self):
        self._pipeline = Pipeline([
            ("foundation", TfidfVectorizer(max_features=2000)),  # frozen after fit
            ("adapter", LogisticRegression(max_iter=500)),       # only this is "trained"
        ])

    def train(self, examples: List[TicketExample]) -> None:
        texts = [ex.text for ex in examples]
        labels = [ex.intent for ex in examples]
        self._pipeline.fit(texts, labels)

    def predict(self, text: str) -> AdapterTuningResult:
        pred = self._pipeline.predict([text])[0]
        probs = self._pipeline.predict_proba([text])[0]
        return AdapterTuningResult(intent=pred, confidence=float(probs.max()))

router = TicketIntentRouter()
router.train(train_examples)  # 200–2000 (text, intent) pairs
result = router.predict("I was charged twice, please refund.")
# result.intent -> "billing"
Full Example: patterns/adapter-tuning/example.py
Pattern 16: Evol-Instruct
Category: LLM Reasoning
Use When: You need to teach a pretrained model new, complex tasks from private data by evolving simple instructions into harder ones, generating answers, and instruction tuning (SFT/LoRA)
Problem
The company wants a model that answers complex policy questions from internal docs under data privacy. Manually creating thousands of hard (question, answer) pairs is expensive.
Solution
Evol-Instruct in four steps:
- Evolve instructions — From seed questions, create harder variants: deeper (constraints, hypotheticals), more concrete (“list 3 reasons”), multi-step (combine two questions)
- Generate answers — For each instruction, produce a high-quality answer (LLM with access to your private context)
- Evaluate and filter — Score each (instruction, answer) 1–5; keep only examples above a threshold
- Instruction tuning — SFT on an open-weight model (Llama, Gemma) using the filtered dataset; PEFT/LoRA for efficient training

Code Snippet
# STEP 1: Evolve instructions
def evolve_instructions(seeds: List[str]) -> List[str]:
    # Deeper: add constraints/hypotheticals
    # Concrete: "List 3 reasons...", "What are the steps..."
    # Multi-step: combine two questions
    return all_instructions

# STEP 2: Generate answers (LLM + policy context)
qa_pairs = generate_answers(all_instructions)

# STEP 3: Score and filter (LLM or model; 1-5)
scored = [score_instruction_answer(ia) for ia in qa_pairs]
filtered = [ex for ex in scored if ex.score >= 4]

# STEP 4: SFT-ready dataset (chat format) -> then HuggingFace SFT/LoRA
sft_dataset = [{"messages": [{"role": "user", "content": ex.instruction},
                             {"role": "assistant", "content": ex.answer}]}
               for ex in filtered]
# Train with transformers + peft + trl SFTTrainer
Full Example: patterns/evol-instruct/example.py
Category 4: Reliability & Evaluation
Patterns 17–20 focus on evaluation, safety, and reliability: using LLMs to judge quality, and guard against harmful or off-policy outputs.
Pattern 17: LLM as Judge
Category: Reliability
Use When: You need nuanced evaluation of model or human outputs with scores and justifications to drive feedback loops, filtering, or training
Problem
Teams must evaluate thousands of support replies for helpfulness, tone, accuracy, clarity, and completeness. Human review does not scale; simple metrics (length, keyword match) miss nuance.
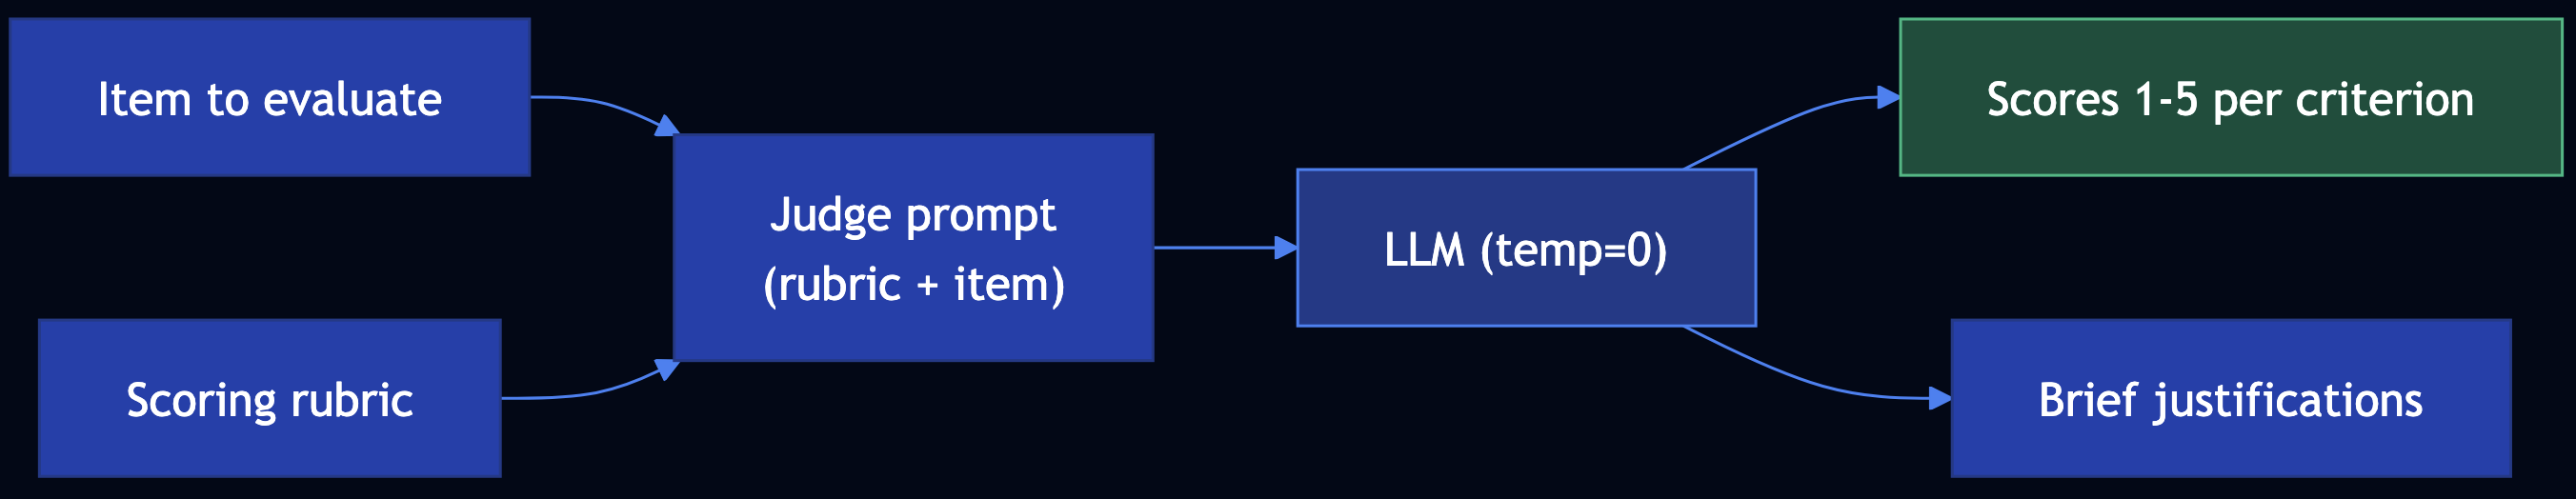
Solution
LLM as Judge uses an LLM to score and justify outputs against a scoring rubric. Three options:
- Prompting — Criteria and instructions in the prompt; LLM returns score (1–5) per criterion and brief justification. Temperature=0 for consistency.
- ML — Create rubric, collect historical (item, scores) data, train a classification model to replicate the rubric at scale.
- Fine-tuning — Fine-tune a model as a dedicated judge on your rubric and labeled data.
Code Snippet
SUPPORT_REPLY_CRITERIA = """
- Helpfulness: Addresses the customer's question; actionable next steps.
- Tone: Professional, empathetic.
- Accuracy: Factually correct.
- Clarity: Easy to read; no unnecessary jargon.
- Completeness: Covers the main ask.
"""

def build_judge_prompt(item: str, criteria: str) -> str:
    return f"""You are evaluating a customer support reply. Score 1-5 per criterion with brief justification.
Criteria: {criteria}
Reply: --- {item} ---
Scores:"""

# Invoke judge with temperature=0 for consistency
raw = run_judge(build_judge_prompt(reply))
result = parse_judge_response(raw, reply)
# result.scores -> [CriterionScore(criterion="Helpfulness", score=4, justification="..."), ...]
Full Example: patterns/llm-as-judge/example.py
Pattern 18: Reflection
Category: Reliability
Use When: You invoke the LLM via a stateless API and want it to correct or improve its first response without the user sending a follow-up.
Problem
The API must return a short apology email for a delayed shipment. A single LLM call may omit an order reference, sound generic, or lack a clear next step.
Solution
Reflection: Do not return the first response to the client. (1) First call ? initial response. (2) Evaluate: send initial response to an evaluator; get feedback. (3) Modified prompt: original request + initial response + feedback. (4) Second call ? revised response. Return the revised response.

Code Snippet
def run_reflection(user_prompt: str) -> ReflectionResult:
    initial_response = generate_initial(user_prompt)       # First call
    feedback, notes = evaluate(user_prompt, initial_response)  # Evaluator
    modified_prompt = (
        f"Original request:\n{user_prompt}\n\n"
        f"Your previous response:\n---\n{initial_response}\n---\n\n"
        f"Feedback to apply:\n{feedback}\n\nProduce an improved version."
    )
    revised_response = generate_revised(modified_prompt)  # Second call
    return ReflectionResult(initial_response, feedback, revised_response)
# Return revised_response to client; initial_response is not sent.
Full Example: patterns/reflection/example.py
Pattern 19: Dependency Injection
Category: Reliability
Use When: Developing and testing GenAI apps are nondeterministic, models change quickly, and you need code to be LLM-agnostic; inject LLM and tool calls
Problem
Developing and testing is hard: LLM output is nondeterministic, APIs change, and you want CI and local dev without API keys.
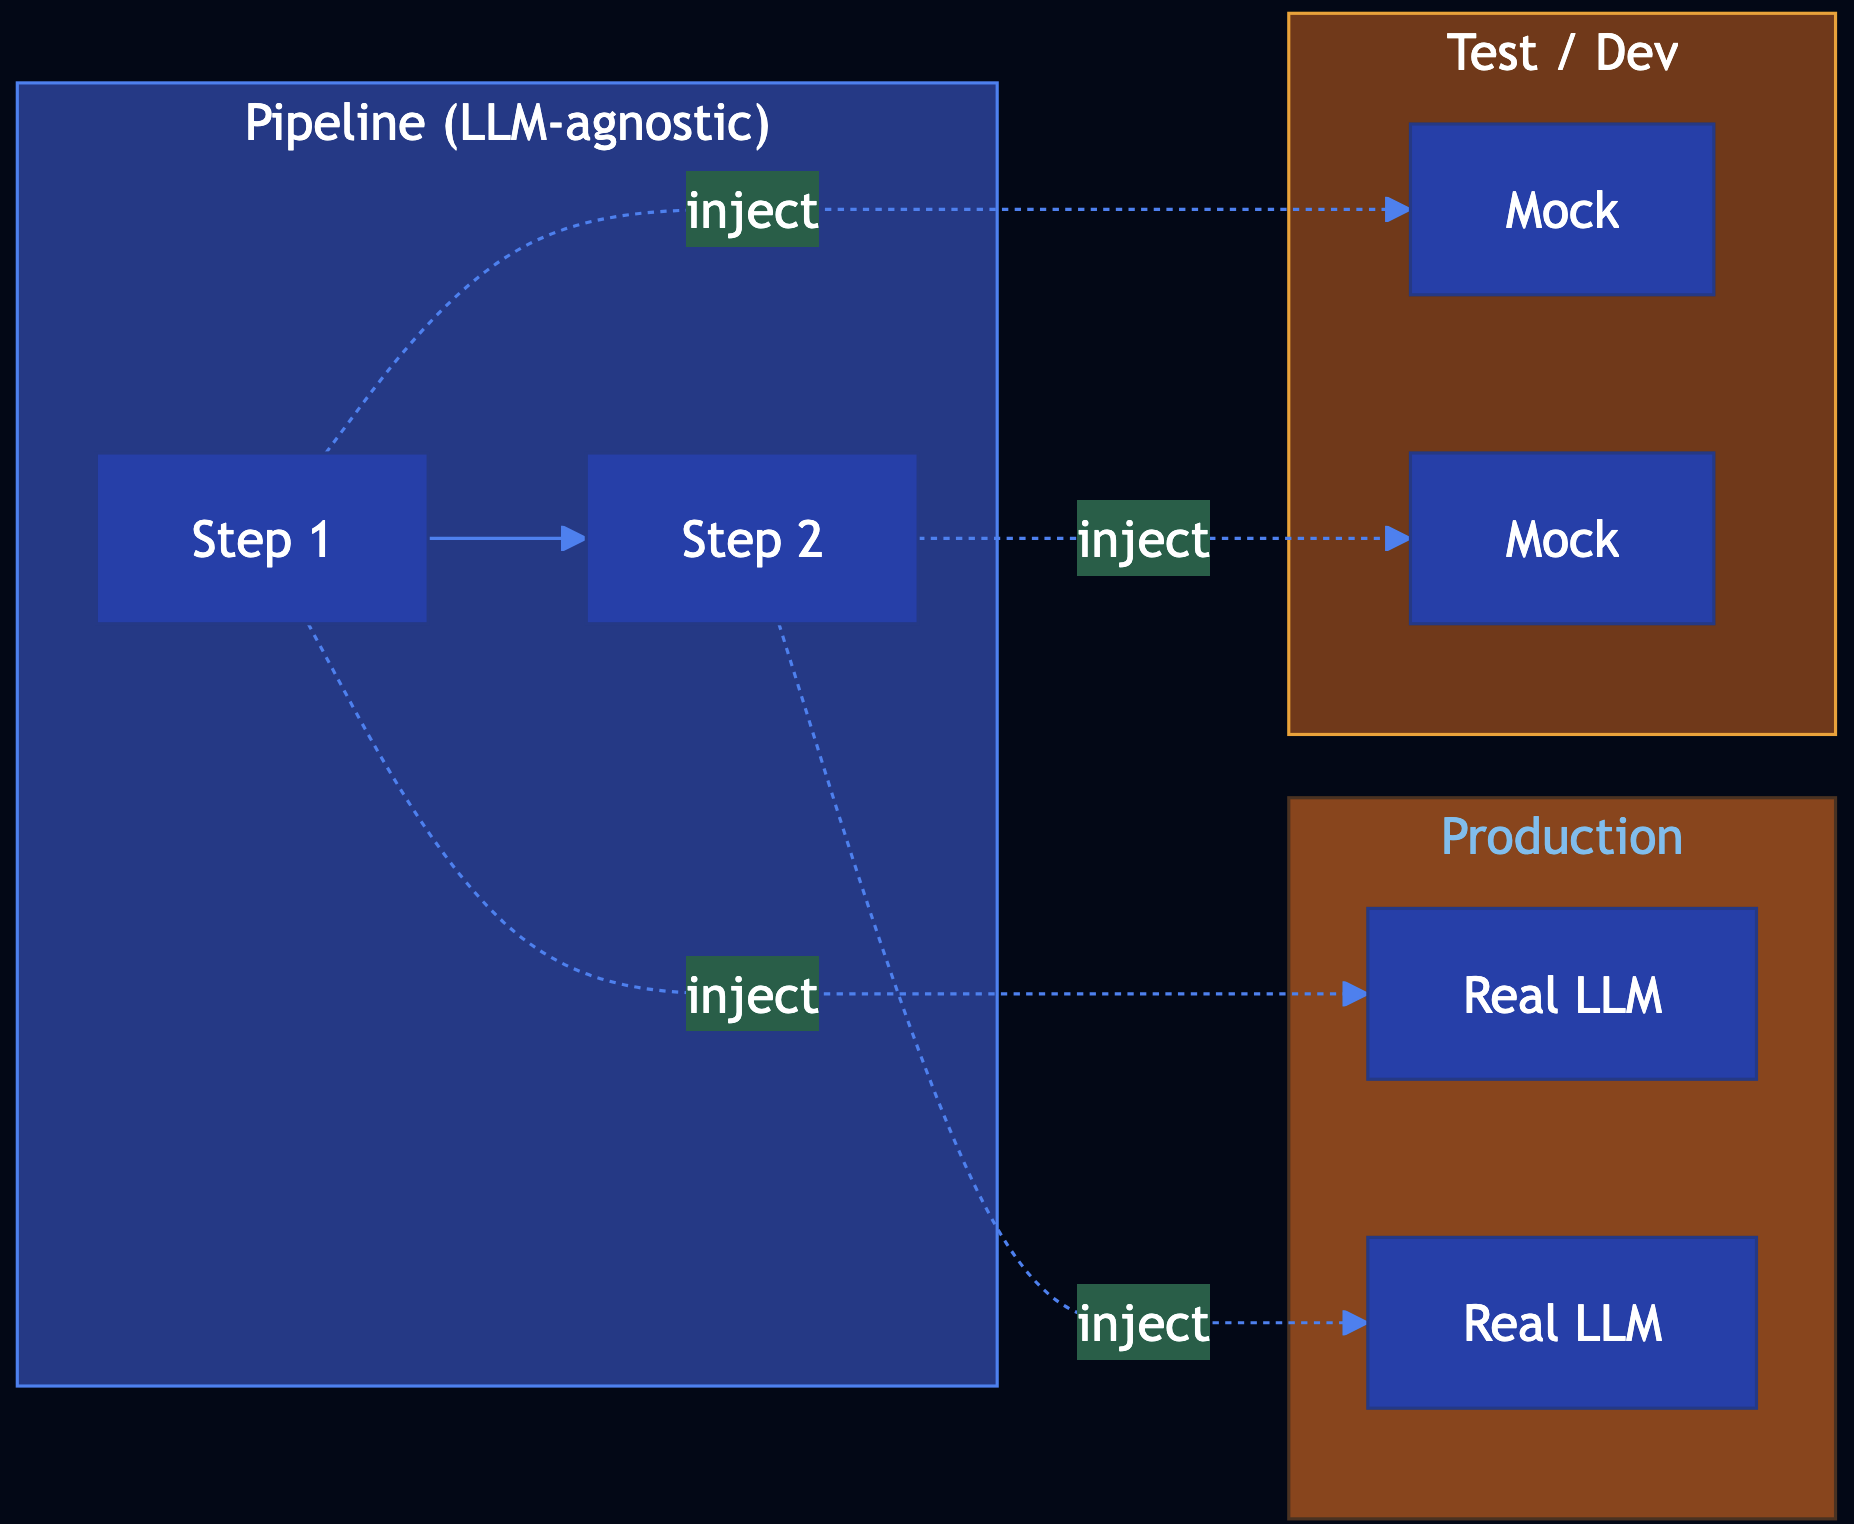
Solution
Dependency Injection: Pass LLM and tool calls into the pipeline as dependencies. Production uses real implementations; tests and dev use mocks that return hardcoded, deterministic results.
Code Snippet
# Pipeline accepts dependencies; no direct LLM calls inside
def run_ticket_pipeline(
    ticket_text: str,
    summarize_fn: Callable[[str], str],
    suggest_action_fn: Callable[[str, str], str],
) -> TicketResult:
    summary = summarize_fn(ticket_text)
    suggested_action = suggest_action_fn(ticket_text, summary)
    return TicketResult(summary=summary, suggested_action=suggested_action)

# Production: real implementations
result = run_ticket_pipeline(ticket, real_summarize, real_suggest_action)

# Tests: mocks (hardcoded, deterministic)
result = run_ticket_pipeline(ticket, mock_summarize, mock_suggest_action)
assert result.summary == "Customer reports an issue..."
Full Example: patterns/dependency-injection/example.py
Pattern 20: Prompt Optimization
Category: Reliability
Use When: You want better results from prompt engineering but changing the foundational model would force repeating all trials so use a repeatable optimization loop with pipeline
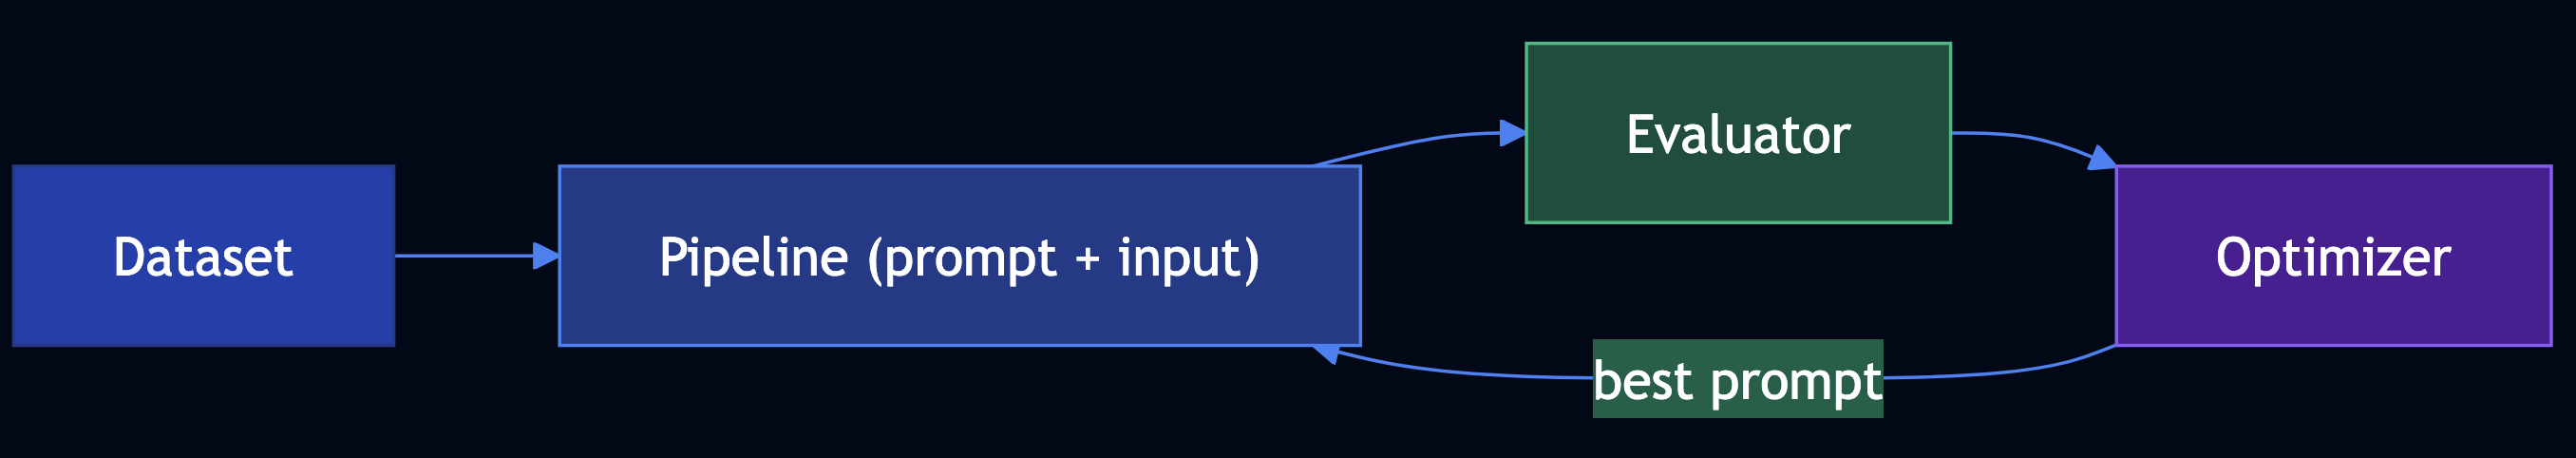
Solution
Prompt optimization as four components — (1) Pipeline of steps that use the prompt (prompt is a parameter), (2) Dataset to evaluate on, (3) Evaluator that scores each output, (4) Optimizer that proposes candidates and picks the best by score.
Code Snippet
def run_pipeline(prompt_template: str, ticket: str) -> str:
    return generate_fn(prompt_template, ticket)

dataset = get_dataset()

def evaluate_summary(summary: str, ticket: str) -> float:
    return 0.0  # ... length, key-info, or LLM-as-Judge

best_prompt, best_score = optimize_prompt(
    candidate_prompts=["Summarize in one sentence.", "Write a one-line summary.", ...],
    dataset=dataset,
    run_fn=lambda p, t: run_pipeline(p, t),
    eval_fn=evaluate_summary,
)
# When model changes: re-run optimize_prompt with same dataset/evaluator
Full Example: patterns/prompt-optimization/example.py
Category 5: Tools, Agents & Efficiency
Patterns 21–32 extend LLMs with tool calling, code execution, multi-agent collaboration, and production efficiency techniques.
Pattern 21: Tool Calling
Category: Tools & Agents
Use When: You need the model to act by calling APIs, looking up live order status, searching internal systems
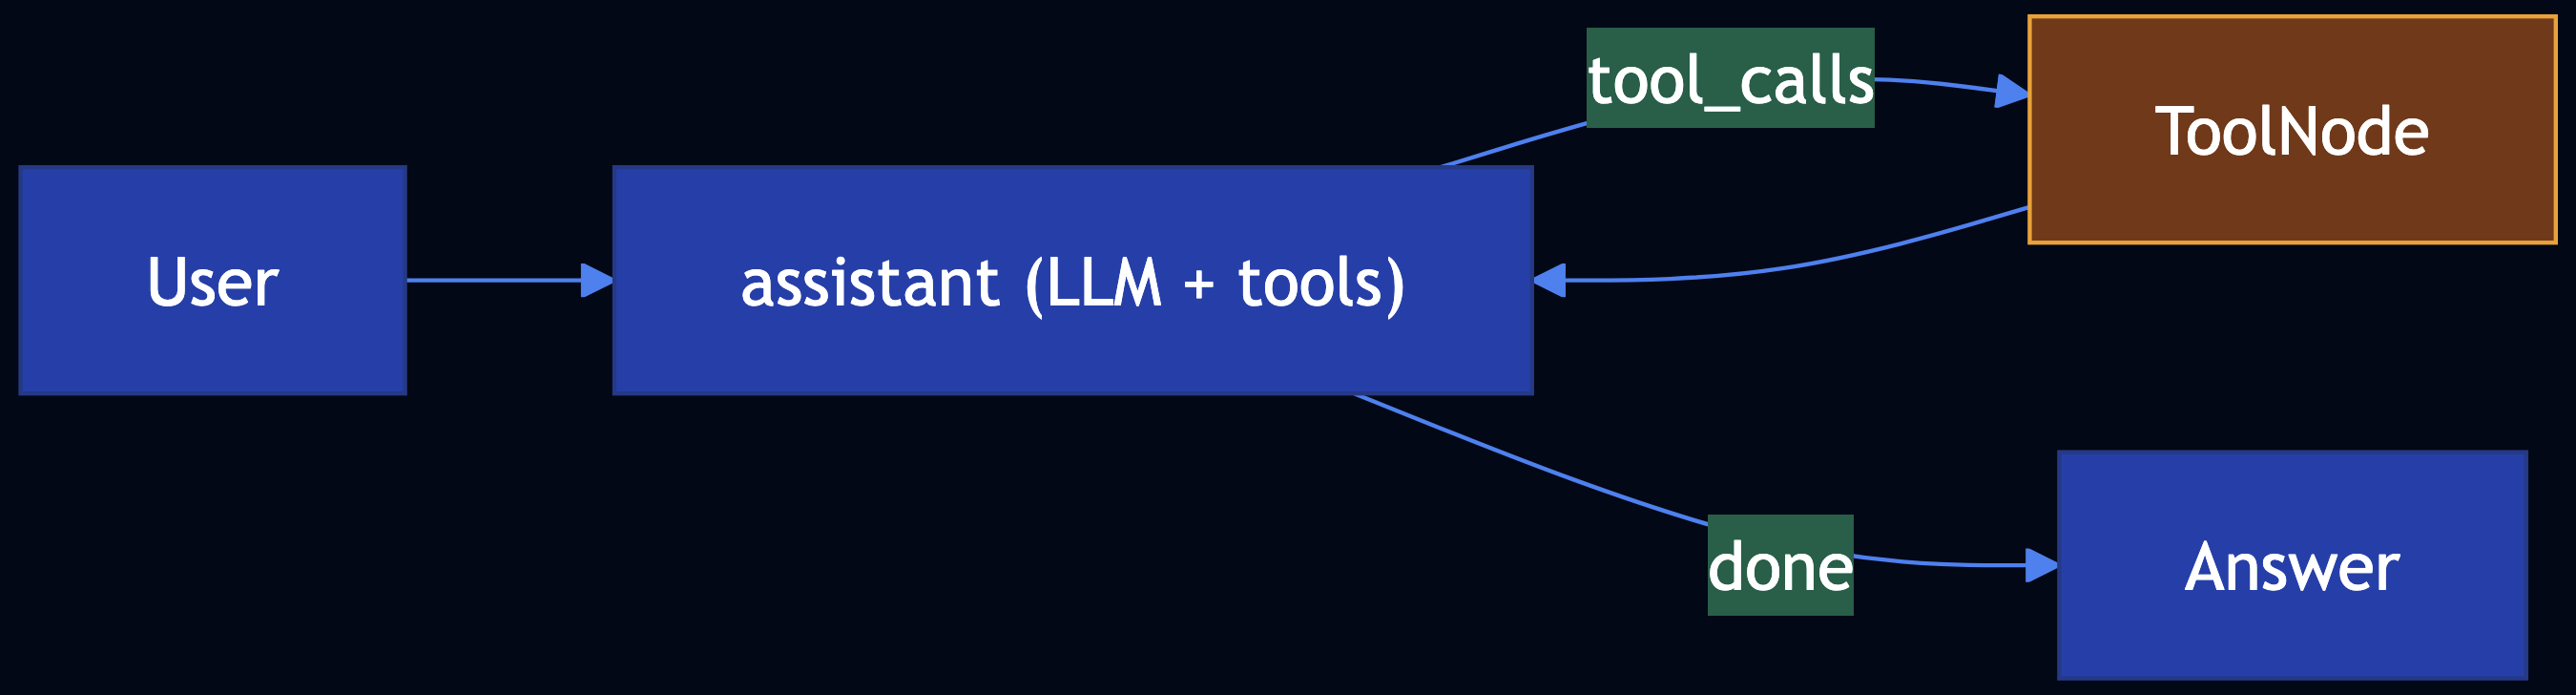
Solution
Bind tools to the model; run a LangGraph with an assistant node (LLM) and ToolNode (executes tools). Conditional routing: if the last message has tool_calls, run tools and loop back.
Code Snippet
from langgraph.graph import END, MessagesState, StateGraph
from langgraph.prebuilt import ToolNode
from langchain_core.tools import tool

@tool
def lookup_order_status(order_id: str) -> str:
    """Look up order in OMS."""
    return '{"status":"shipped",...}'

workflow = StateGraph(MessagesState)
workflow.add_node("assistant", call_model)
workflow.add_node("tools", ToolNode([lookup_order_status]))
workflow.set_entry_point("assistant")
workflow.add_conditional_edges("assistant", route_tools_or_end)
workflow.add_edge("tools", "assistant")
app = workflow.compile()
Full Example: patterns/tool-calling/example.py
Dependencies: pip install -r patterns/tool-calling/requirements.txt; Ollama with a tool-capable model (e.g. llama3.2)
Pattern 22: Code Execution
Category: Tools & Agents
Use When: The task needs an artifact (diagram, plot, query): the model should emit a DSL and a sandbox runs it
Solution
Code execution: Prompt the model for DSL (low temperature). A sandbox writes temp files, runs dot, python (restricted), or a DB driver with timeouts and allowlists. LangGraph can wire generate_dsl ? execute_sandbox as a linear graph.

Code Snippet
from langgraph.graph import END, StateGraph

workflow = StateGraph(CodeExecutionState)
workflow.add_node("generate_dsl", node_generate_dsl)
workflow.add_node("sandbox", execute_in_sandbox)
workflow.set_entry_point("generate_dsl")
workflow.add_edge("generate_dsl", "sandbox")
workflow.add_edge("sandbox", END)
app = workflow.compile()
final = app.invoke({"user_request": "..."})
Full Example: patterns/code-execution/example.py
Dependencies: pip install -r patterns/code-execution/requirements.txt; optional Graphviz (brew install graphviz)
Pattern 23: Multi-Agent Collaboration
Category: Tools & Agents
Use When: Work is multistep, multi-domain, and long-running; a single agent hits cognitive, tool, and tuning limits
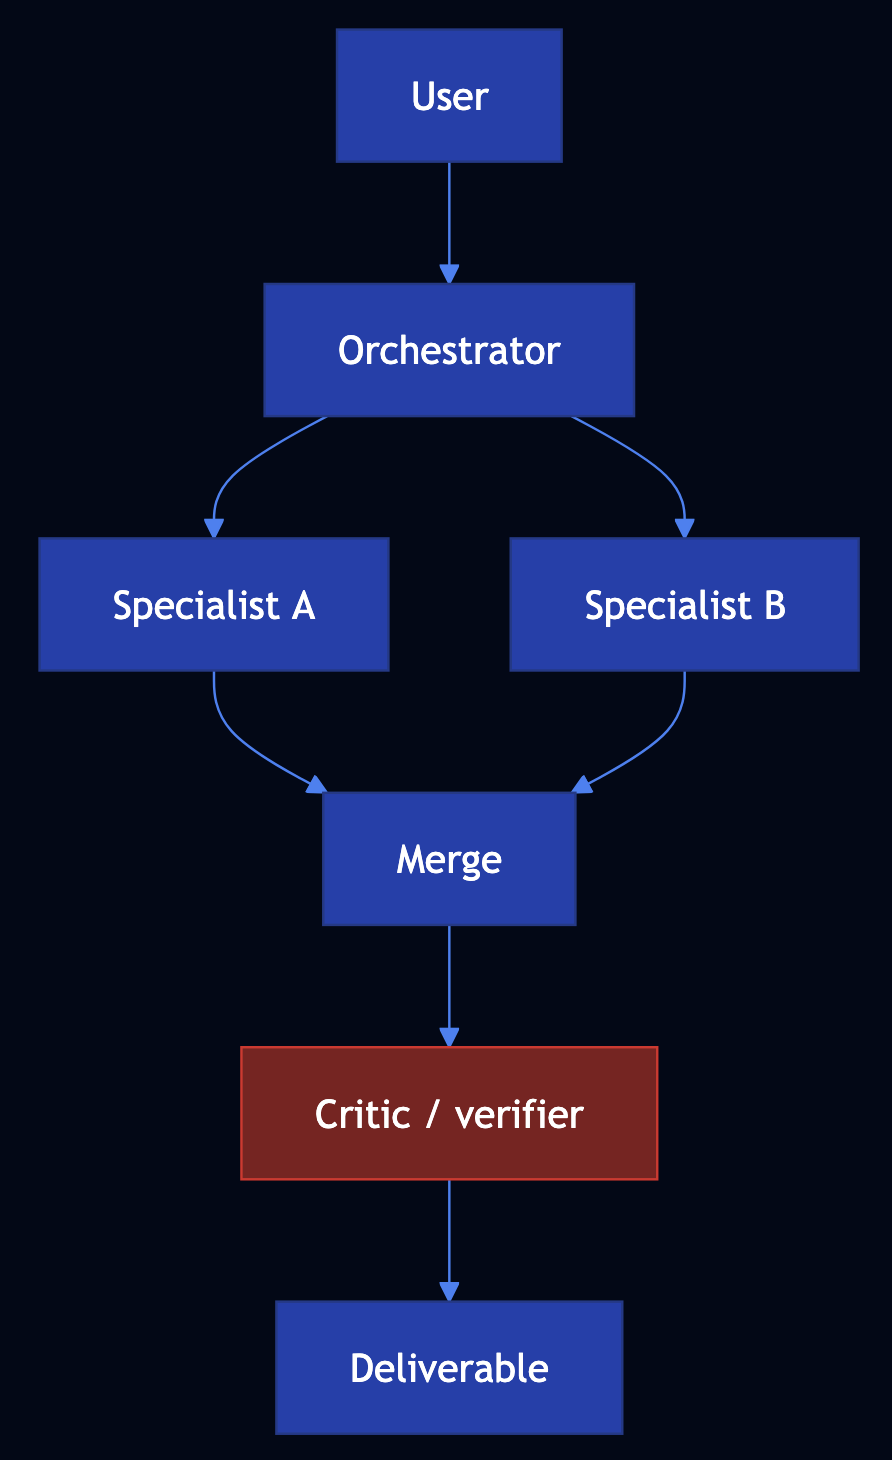
Solution
Multi-agent collaboration: Define agents with narrow mandates and clear handoffs. Patterns include hierarchical (planner delegates), prompt chaining (sequential pipelines), peer-to-peer / blackboard (shared store), and parallel execution.
Code Snippet
from langgraph.graph import END, StateGraph

g = StateGraph(MultiAgentState)
g.add_node("plan", node_plan)
g.add_node("technical", node_technical)
g.add_node("compliance", node_compliance)
g.add_node("merge", node_merge)
g.add_node("critic", node_critic)
g.add_node("finalize", node_finalize)
g.set_entry_point("plan")
app = g.compile()
result = app.invoke({"user_request": "..."})
Full Example: patterns/multiagent-collaboration/example.py
Pattern 24: Small Language Model
Category: Efficiency & Deployment
Use When: Frontier models are too large or too expensive to self-host; you want smaller models, distillation, quantization, or faster decoding
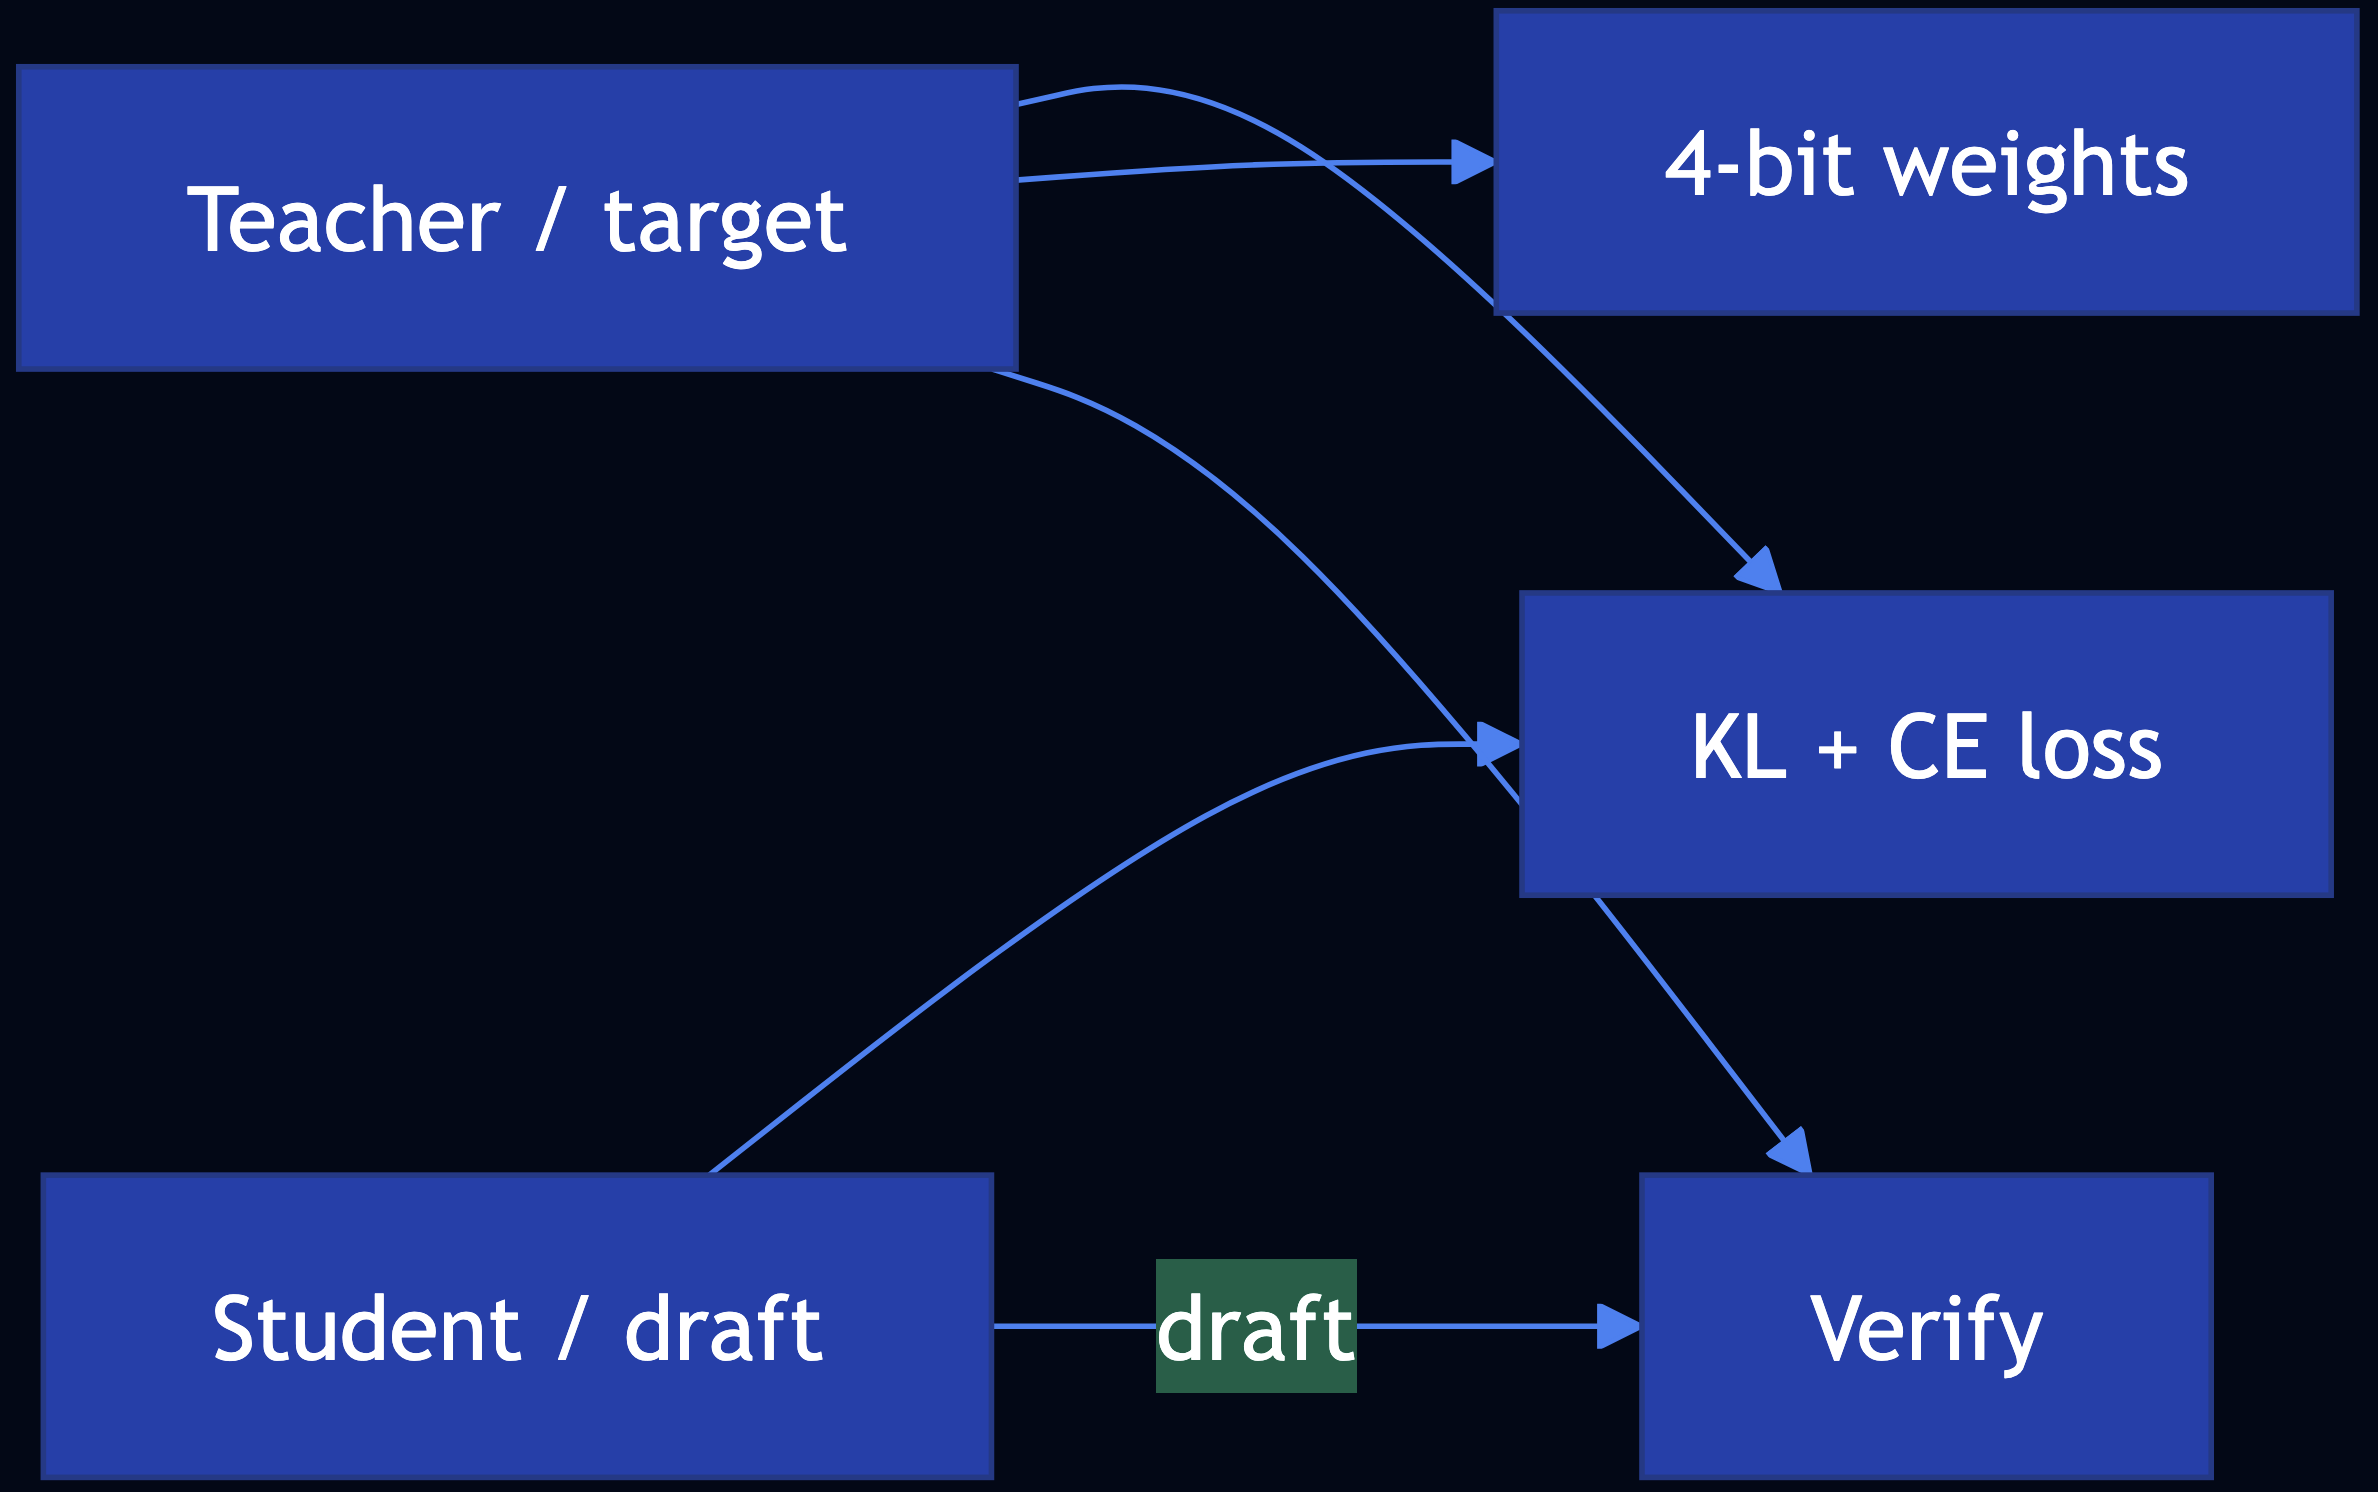
Solution
- Knowledge distillation — Train a student on teacher soft targets; KL divergence aligns token distributions
- Quantization — 4-bit / 8-bit weights (BitsAndBytesConfig, NF4) shrink footprint
- Speculative decoding — A small draft model proposes tokens; a large target verifies in parallel
Code Snippet
# Distillation: minimize KL(student || teacher) on teacher softmax + CE on labels
# Quantization: BitsAndBytesConfig(load_in_4bit=True, bnb_4bit_quant_type="nf4", ...)
# Speculative decoding: vLLM speculative_config={"model": draft_id, "num_speculative_tokens": k}
Full Example: patterns/small-language-model/example.py
Pattern 25: Prompt Caching
Category: Efficiency & Deployment
Use When: The same or similar prompts hit your LLM repeatedly and you want lower latency, lower cost, and less load
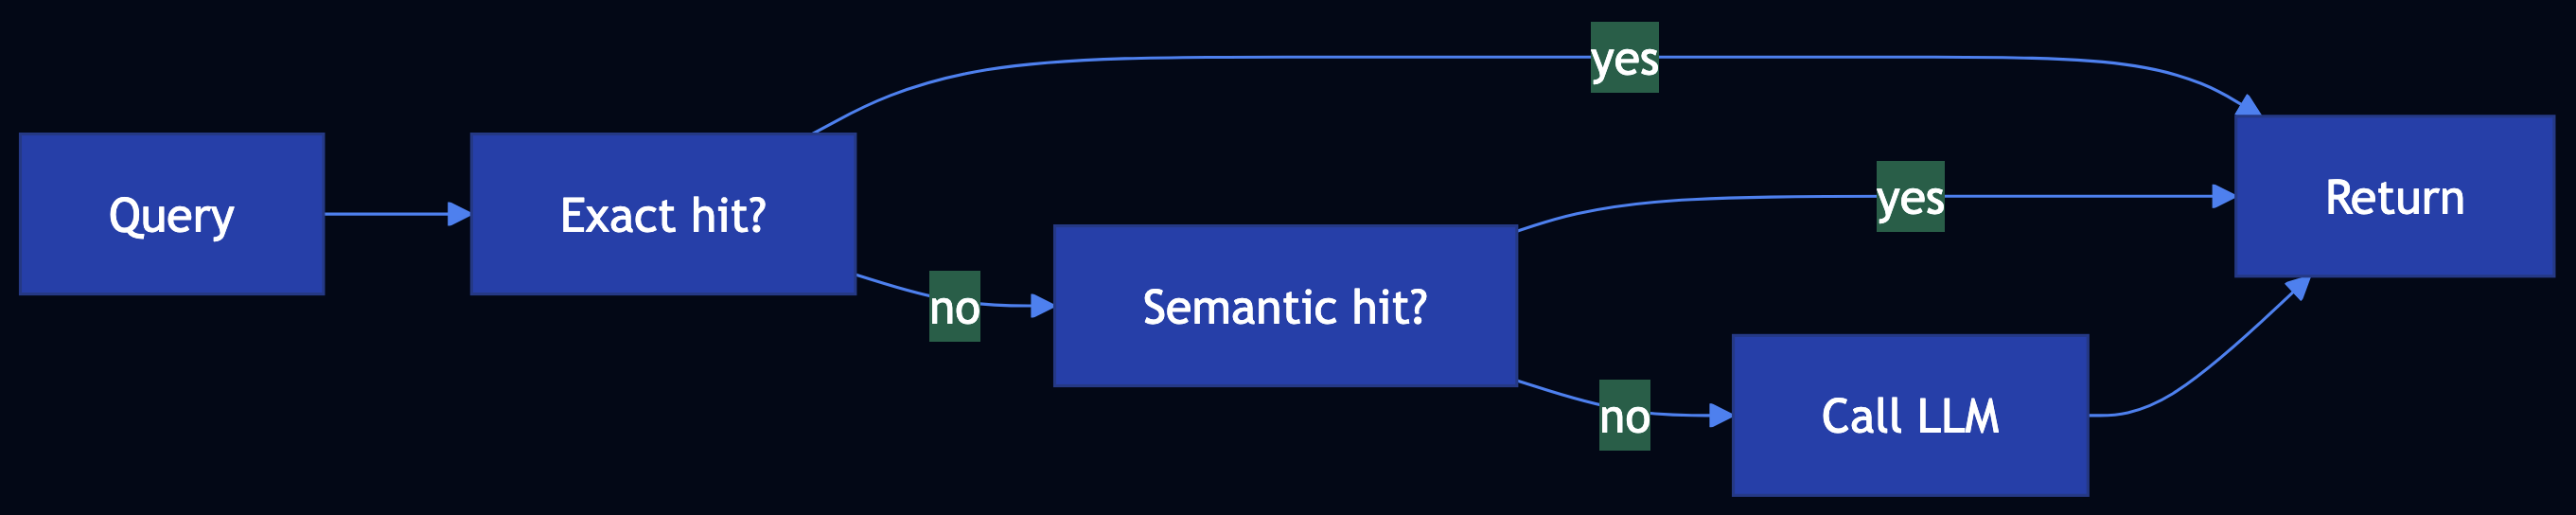
Solution
- Client-side exact cache — Hash
(model, params, messages)? store response - Framework caches — LangChain
InMemoryCache/SQLiteCacheviaset_llm_cache - Semantic cache — Embeddings to match paraphrases; return cached answer if similarity ? threshold
- Server-side prompt caching — Anthropic / OpenAI may cache eligible long prompts inside the API
Code Snippet
# Exact: sha256(f"{model}\n{prompt}") -> response
# Semantic: cosine(embed(query), embed(cached_prompt)) >= threshold
# LangChain: set_llm_cache(SQLiteCache(database_path="..."))
# Provider: Anthropic cache_control / OpenAI automatic prefix caching (see docs)
Full Example: patterns/prompt-caching/example.py
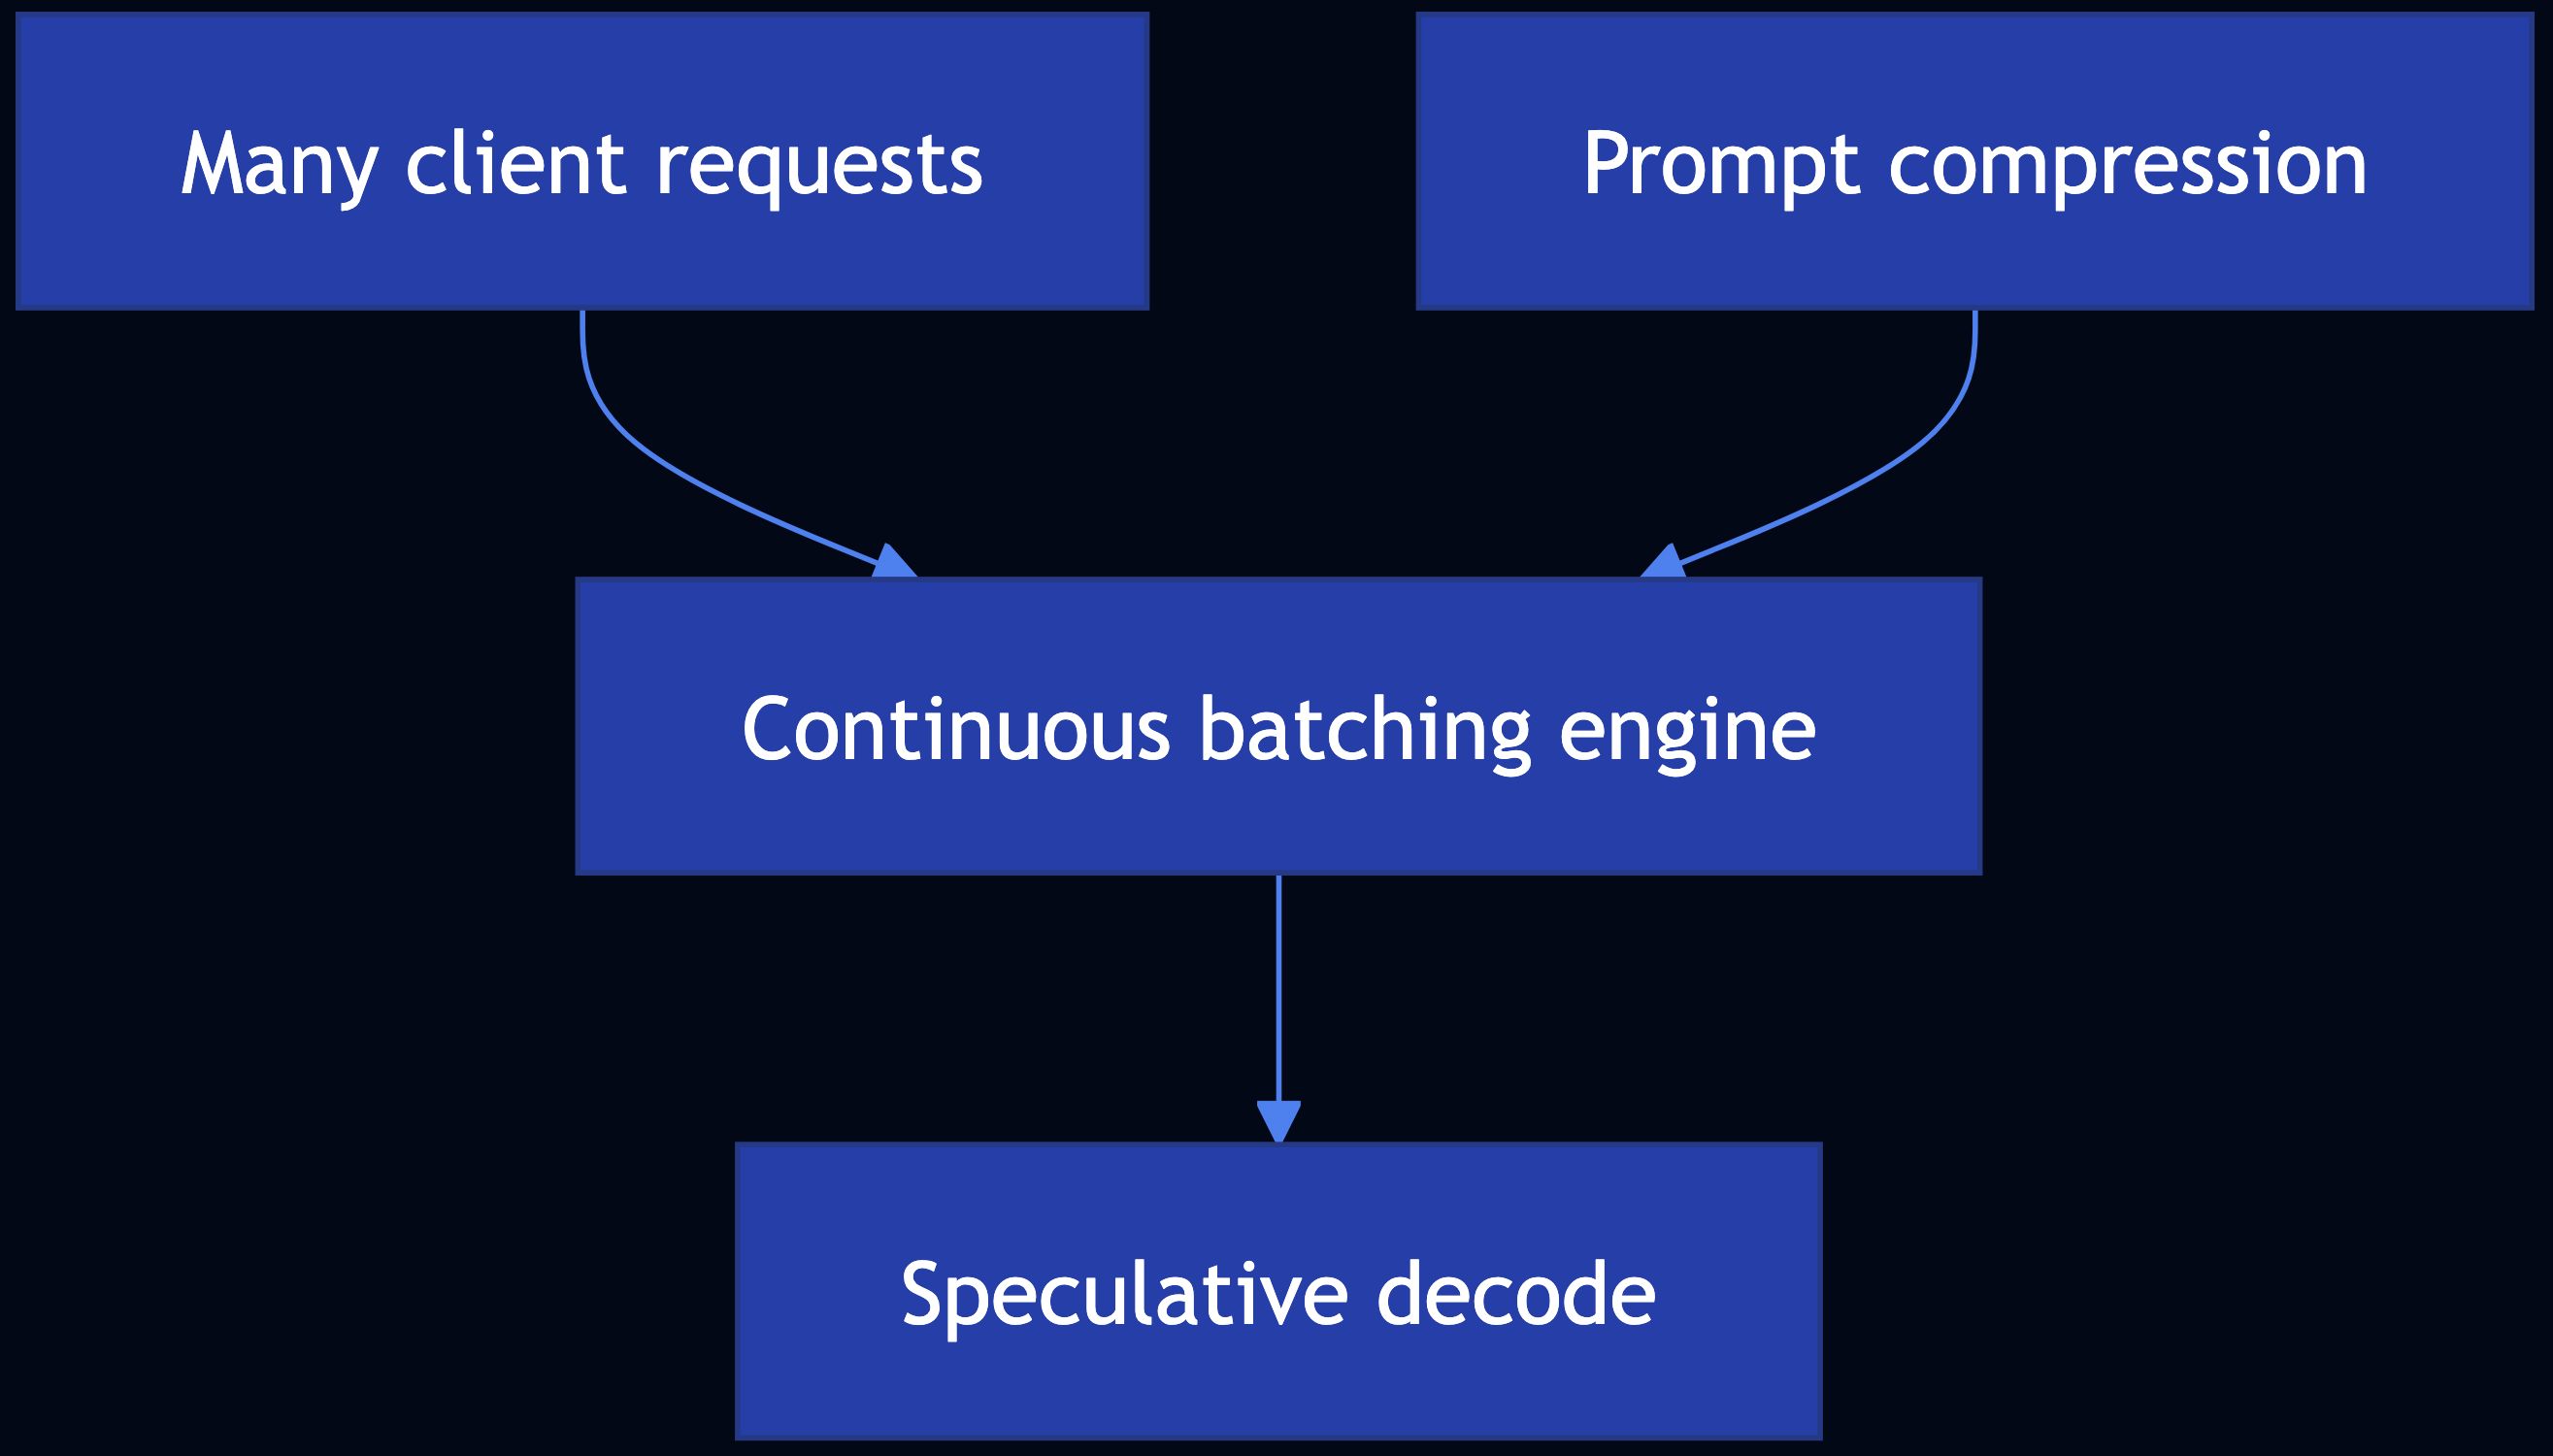
Pattern 26: Inference Optimization
Category: Efficiency & Deployment
Use When: You self-host LLMs and must maximize throughput, cut latency, and control KV-cache memory
Solution
- Continuous batching (dynamic batching) — Requests enter and leave at fine granularity; vLLM (PagedAttention) and SGLang reduce padding waste
- Speculative decoding — Draft + target models (see Pattern 24)
- Prompt compression — Remove redundancy in system + RAG context to shrink KV footprint
Code Snippet
# Continuous batching: use vLLM / SGLang / TensorRT-LLM — not hand-rolled pad batches
# Speculative decoding: vLLM speculative_config={...} (see Pattern 24)
# Prompt compression: dedupe, summarize, or learned compressors before .generate()
Full Example: patterns/inference-optimization/example.py
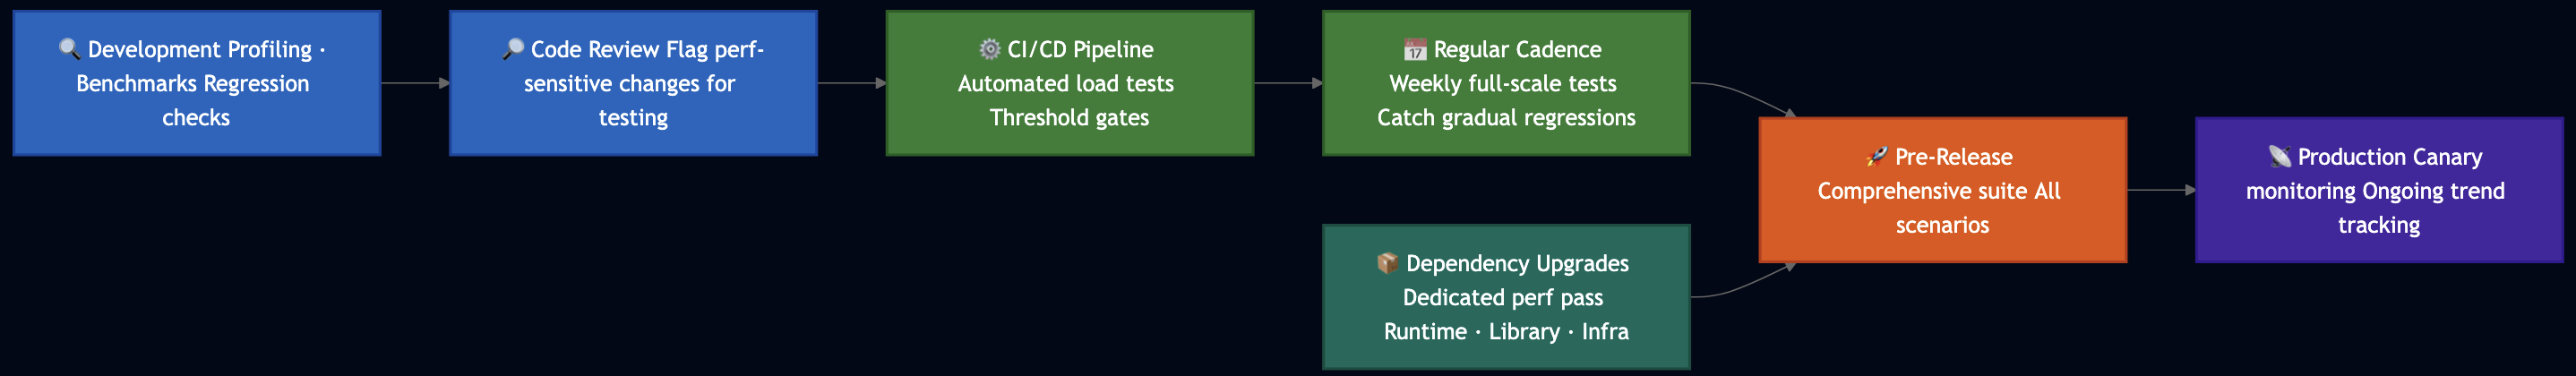
Pattern 27: Degradation Testing
Category: Efficiency & Deployment
Use When: You need load testing that matches LLM inference behavior with TTFT, end-to-end latency, token throughput, and RPS under rising concurrency
Key Metrics
- TTFT — Time from request to first token (streaming)
- EERL — End-to-end request latency (wall time to last token)
- Output tokens / second — Generation throughput
- Requests / second — Completed requests per second at a given concurrency

Code Snippet
# Per request: ttft_s, eerl_s, output_tokens -> tok/s = tokens / (eerl_s - ttft_s)
# Aggregate: p95_ttft, p95_eerl, mean tok/s, rps = n / wall_time
# Tools: LLMPerf, LangSmith traces
Full Example: patterns/degradation-testing/example.py
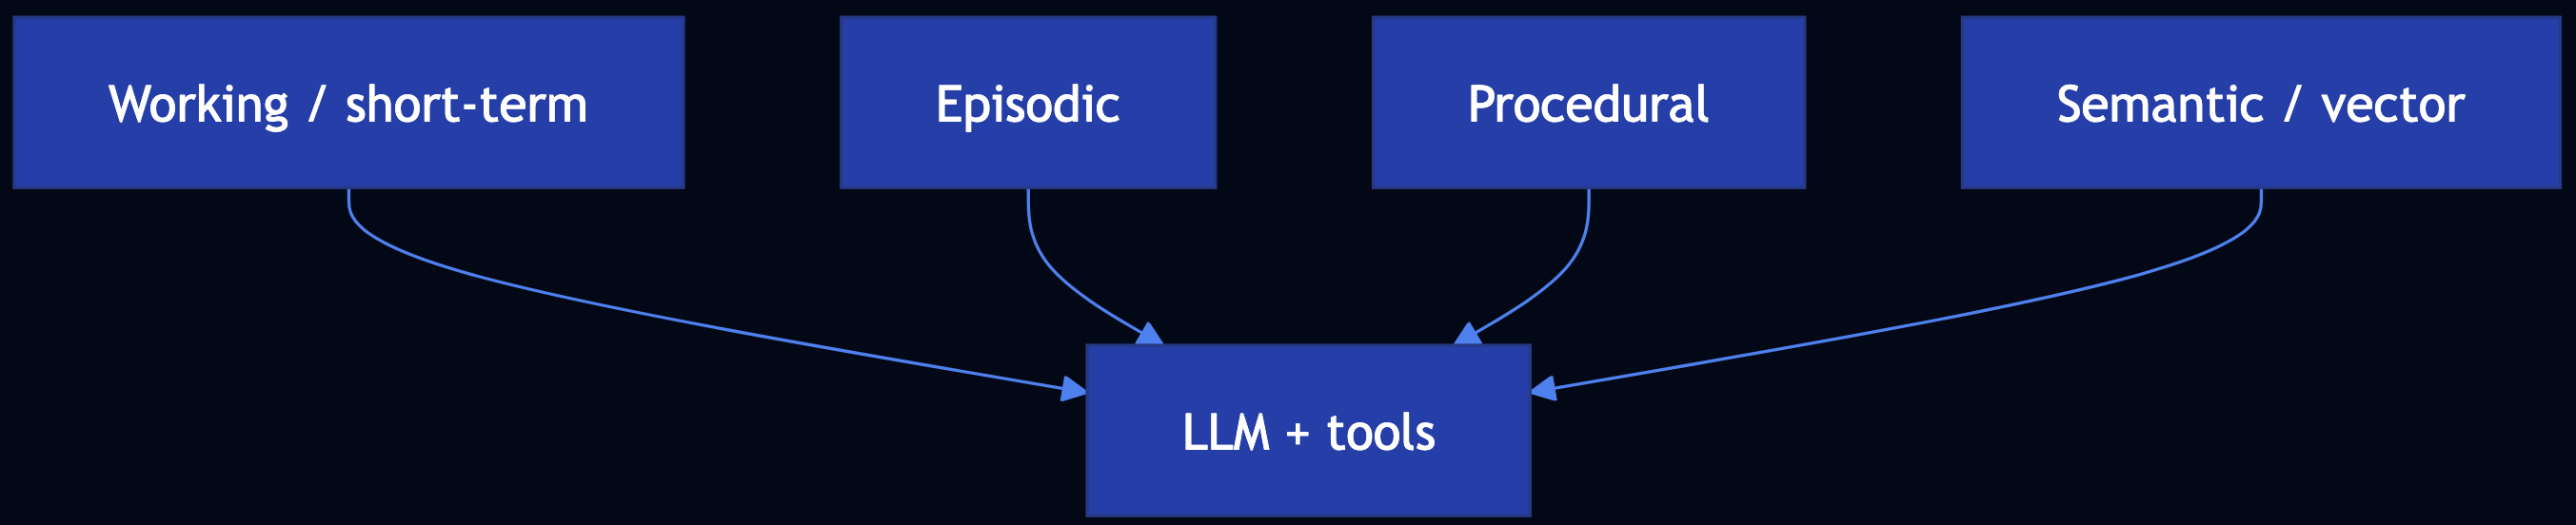
Pattern 28: Long-Term Memory
Category: Memory & Agents
Use When: LLM calls are stateless; you need continuity across sessions with working, episodic, procedural, and semantic memory
Solution
- Working memory — Recent turns / scratch context (sliding window)
- Episodic memory — Dated interactions (“what we did”)
- Procedural memory — Playbooks and tool recipes
- Semantic memory — Stable facts; typically embedding search (Mem0, custom RAG-over-memories)
Code Snippet
# Mem0: memory.add(messages, user_id=...); memory.search(query, user_id=...)
# Four layers: working (deque), episodic (log), procedural (playbooks), semantic (vector / KV)
Full Example: patterns/long-term-memory/example.py
Dependencies: pip install mem0ai openai chromadb for Mem0-aligned version
Pattern 29: Template Generation
Category: Setting Safeguard
Use When: You need repeatable, reviewable customer-facing text; full free-form generation is too variable or mixes facts with creativity unsafely
Solution
- Prompt the model to output a template only, with explicit placeholders (
[CUSTOMER_NAME],[ORDER_ID], …) - Human / comms reviews the template (per locale/product), not every send
- Fill slots in code; optional second LLM pass only for lint or translation
- Few-shot examples in the prompt show approved shapes so new templates stay grounded

Code Snippet
# Low temp + few-shot -> template with [SLOT_NAME]
# validate required [ORDER_ID], [CUSTOMER_NAME] present
# fill_template(template, slots_from_crm)
Full Example: patterns/template-generation/example.py
Pattern 30: Assembled Reformat
Category: Setting Safeguard
Use When: A full LLM-generated page can hallucinate high-risk attributes (battery chemistry, hazmat, allergens, medical claims)
Solution
- Risk registry — chemistry, Wh, hazmat, etc. from structured sources only
- Assemble deterministic blocks (specs, shipping, legal)
- Optional LLM for tone/SEO only, conditioned on the assembled facts
- Validate — banned claims, chemistry contradictions

Code Snippet
# facts = load_pim(sku)  # BatteryChemistry.NIMH, ...
# page = render_compliance_block(facts)  # deterministic
# fluff = llm_marketing(facts)  # constrained; validate_high_risk(page + fluff, facts)
Full Example: patterns/assembled-reformat/example.py
Pattern 31: Self-Check
Category: Setting Safeguard
Use When: You can obtain per-token logprobs from inference and want a statistical signal to flag uncertain or fragile generations for review
Solution
- Logits ? softmax ? probabilities (p_i)
- Logprob (log p) for the sampled token (APIs often return this directly)
- Flag tokens with low (p) or small margin to the second-best token
- Perplexity on a sequence:
PPL = exp(-mean(logprobs))

Code Snippet
# p_i = exp(logprob_i); flag if p_i < threshold
# PPL = exp(-mean(logprobs))  # natural-log probs per token
Full Example: patterns/self-check/example.py
Pattern 32: Guardrails
Category: Setting Safeguard
Use When: You must enforce security, privacy, moderation, and alignment around LLM and RAG systems
Solution
- Prebuilt — Gemini safety settings; OpenAI Moderation API; hosted provider filters
- Custom — PII redaction, banned topics, allowlists, regex injection detectors, LLM-as-Judge (Pattern 17)
- Compose —
apply_guardrails(text, scanners)pipeline; scan query, then answer

Code Snippet
# apply_guardrails(user_query, [pii_redact, banned_topic])
# answer = engine.query(sanitized); apply_guardrails(answer, [pii_redact, moderation])
Full Example: patterns/guardrails/example.py
Category 6: Agentic Behavior Patterns
Patterns 33–50 align with Agentic Design Patterns (Antonio Gulli): specialized agent roles, orchestration, and production agentic systems.
Pattern 33: Prompt Chaining
Category: Agentic Orchestration
Use When: A task benefits from sequential decomposition where each LLM call has one job, structured output feeds the next step
Solution

Code Snippet
# state = classify(q); state = decompose(state); state = answer(state); state = format(state)
# Or LangGraph: add_node per step, linear edges
Full Example: patterns/prompt-chaining/example.py
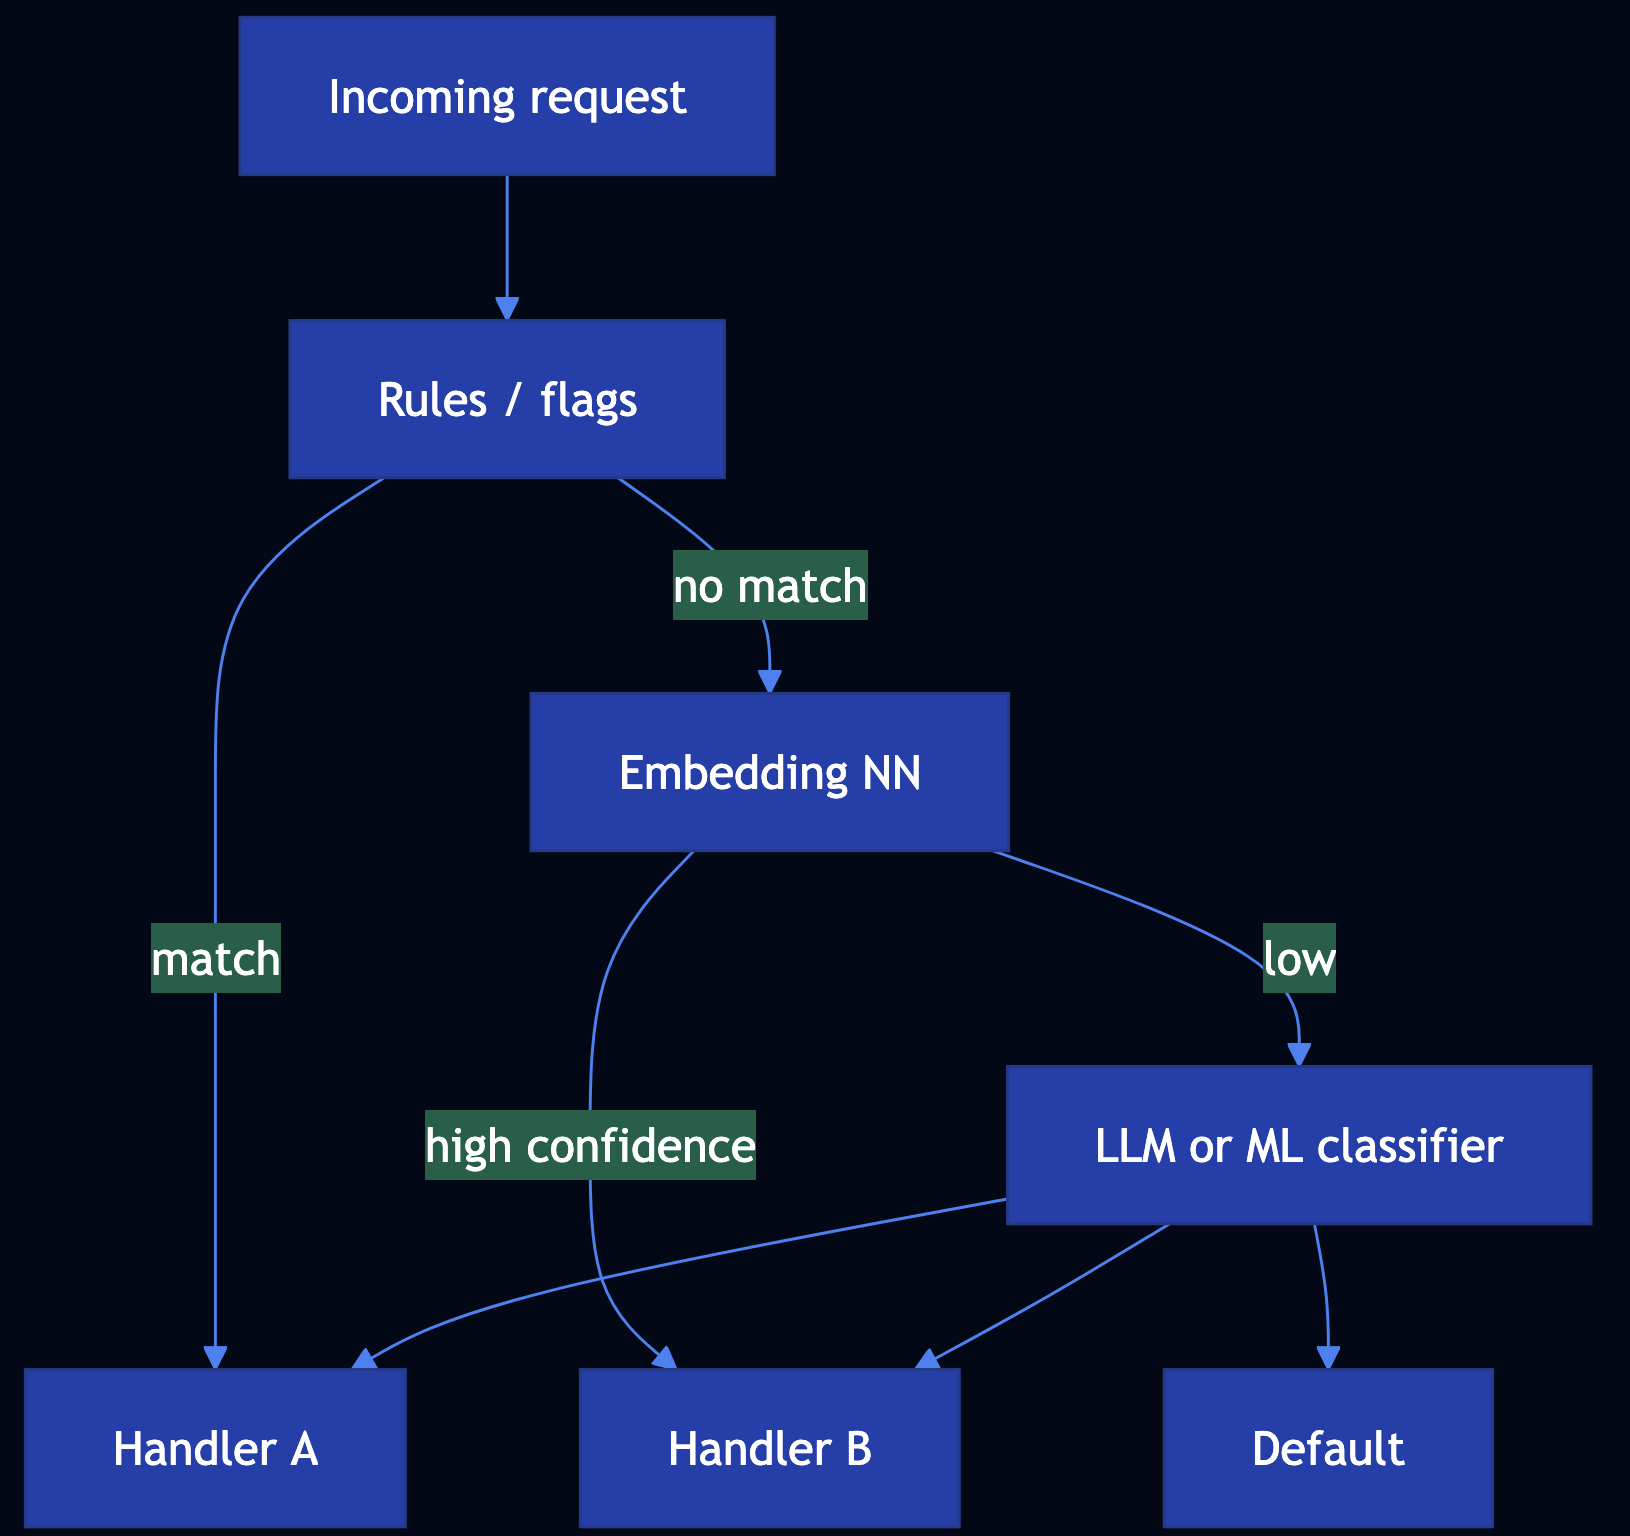
Pattern 34: Routing
Category: Agentic Orchestration
Use When: You must classify or direct each request to the right handler
Solution
- Rule-based routing for deterministic paths
- Embedding similarity to handler descriptions or labeled exemplars
- LLM routing with JSON schema:
route,confidence, optionalrationale - ML classifier on features for scale and SLOs
Code Snippet
# RunnableBranch (langchain_core): (predicate, runnable), ..., default
# Or: rules_first = route_rules(text); if conf < 0.9: route_llm(text)
Full Example: patterns/routing/example.py
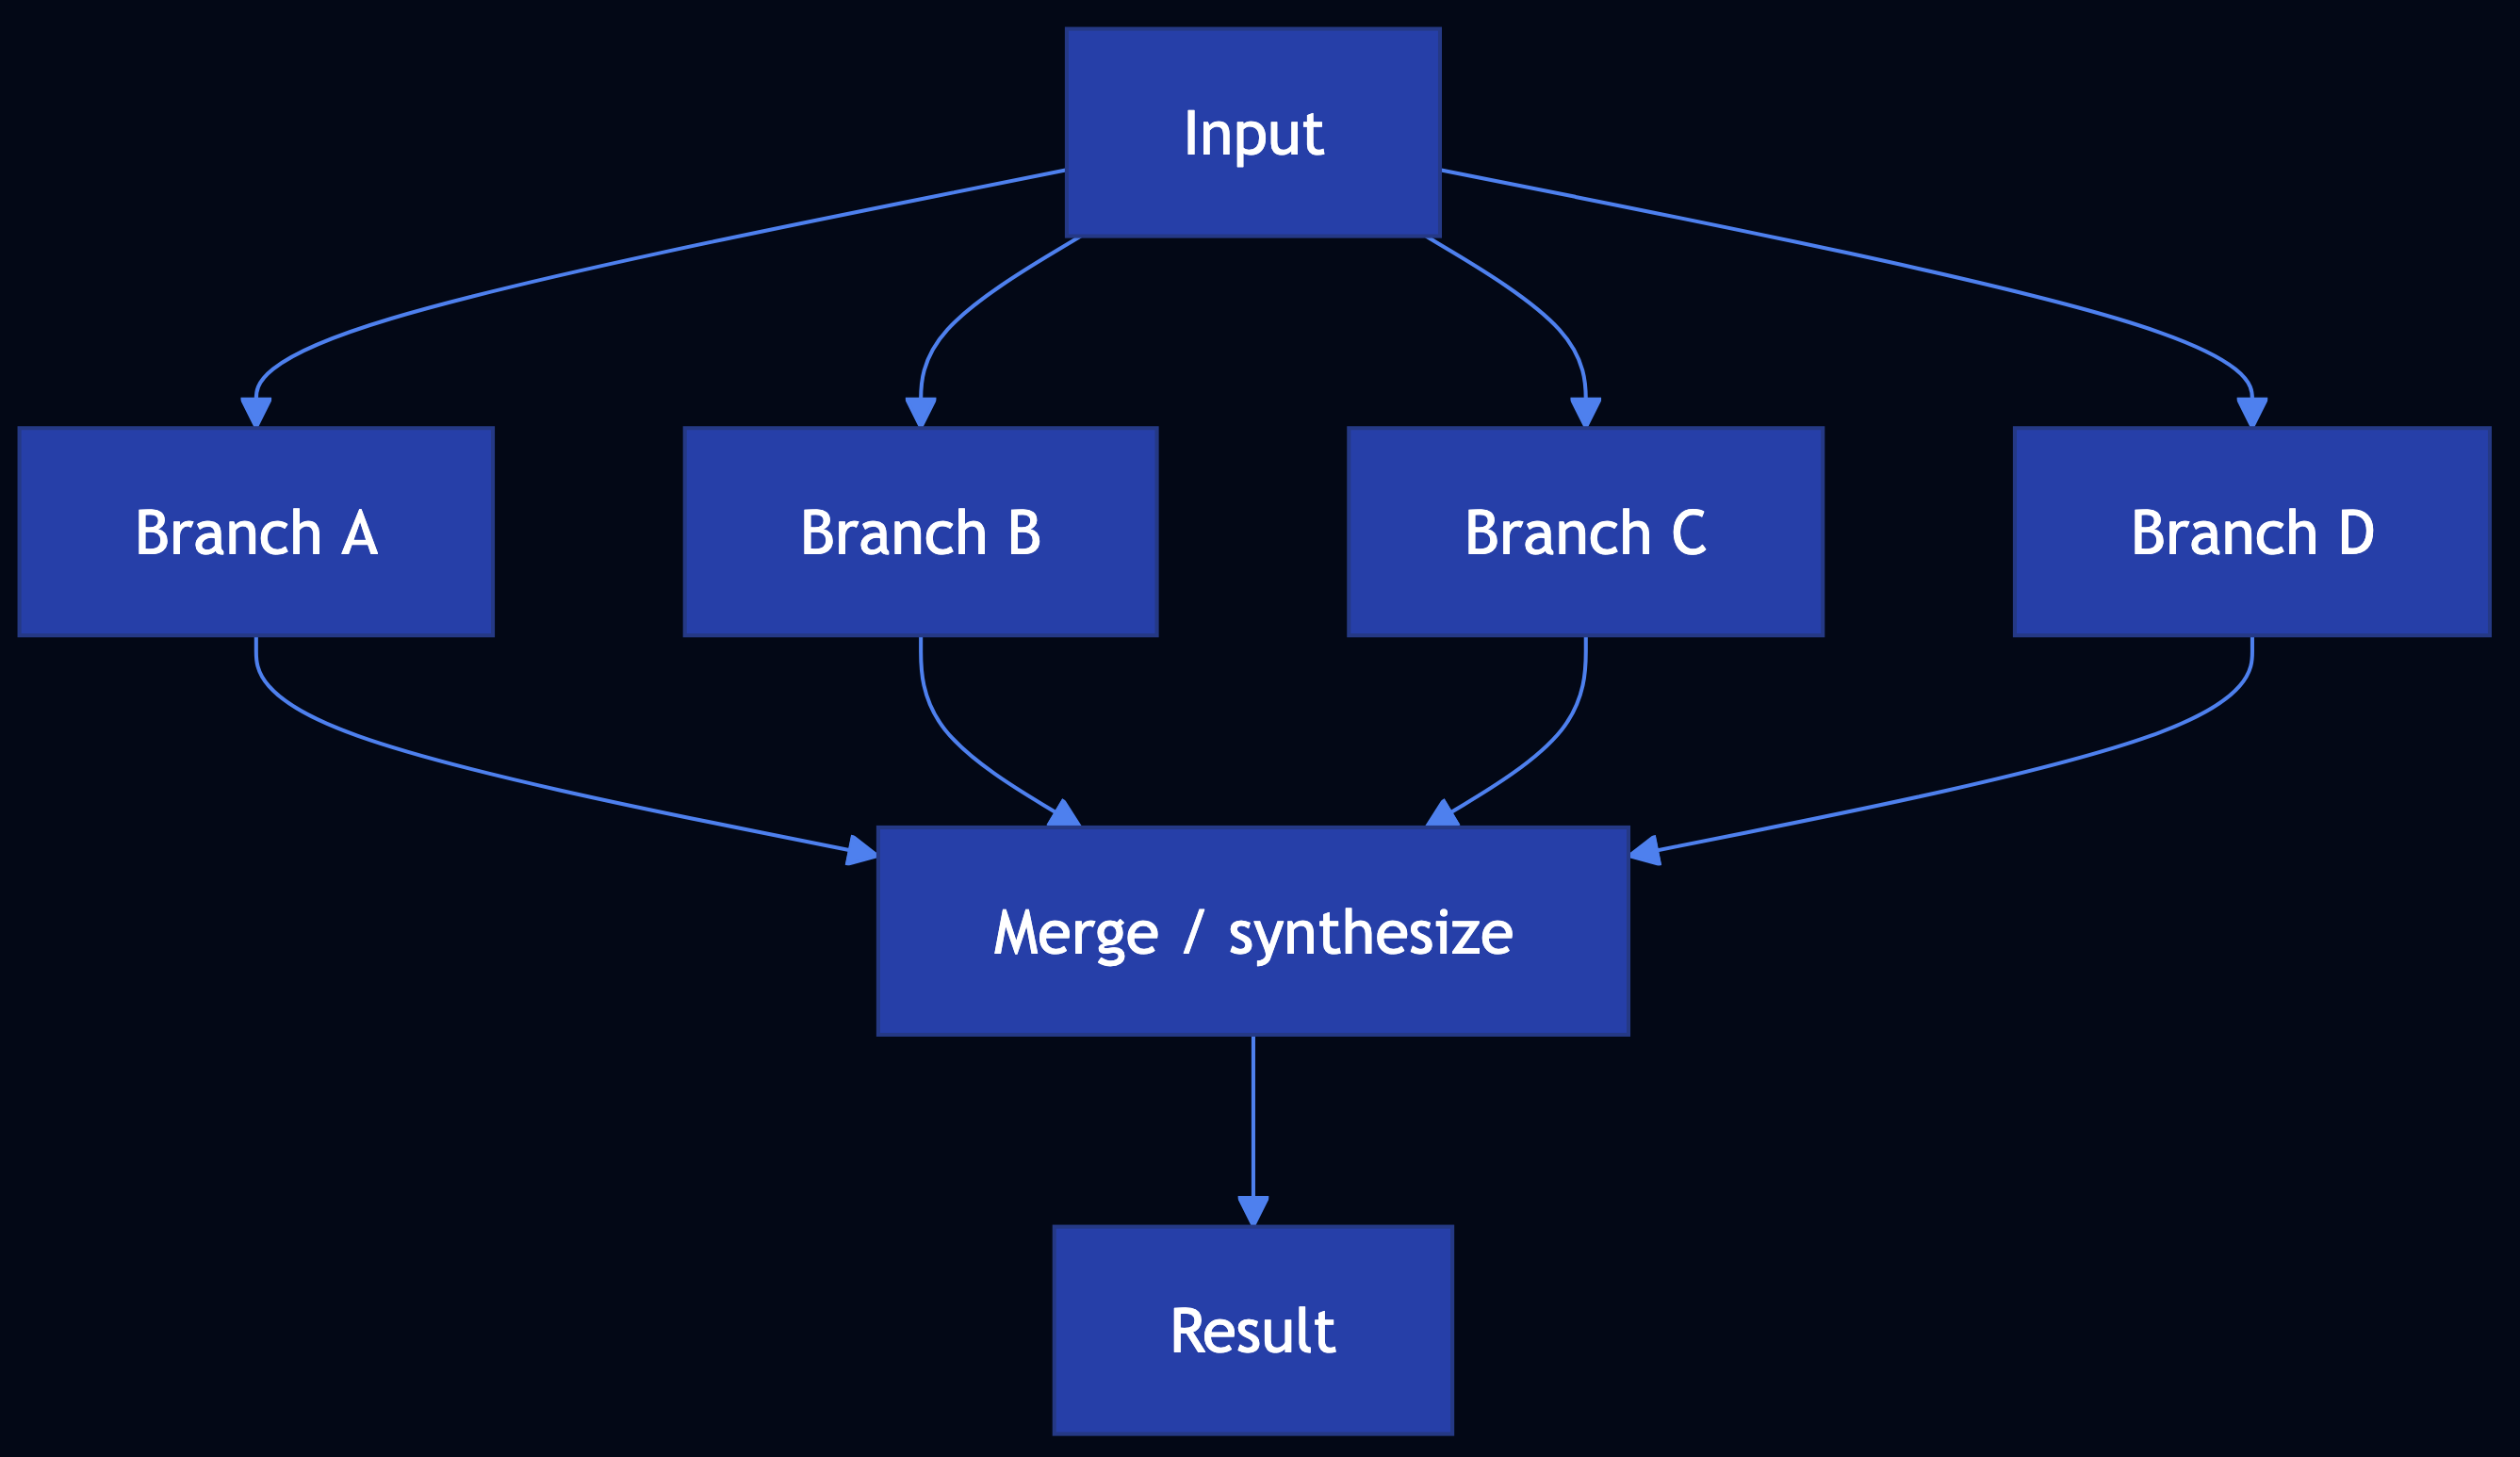
Pattern 35: Parallelization
Category: Agentic Orchestration
Use When: Independent subtasks can run together such as research fan-out, analytics partitions, parallel validators
Solution
Code Snippet
# LCEL: RunnableParallel(gather=..., analyze=..., verify=...) | RunnableLambda(merge)
# stdlib: ThreadPoolExecutor; submit each branch; as_completed ? dict
Full Example: patterns/parallelization/example.py
Pattern 36: Learning and Adaptation
Category: Agentic Learning
Use When: Systems must improve from experience such as RL (PPO with clipped surrogate for stability) and preference alignment (DPO without a separate reward model)
Solution
- RL agents — collect trajectories ? advantage estimates ? PPO-style clipped ratio to limit destructive updates
- LLM alignment — RLHF path (reward model + PPO) vs DPO (direct policy update from chosen/rejected completions)
- Online / memory — replay, regularization, retrieval over past successes

Code Snippet
# PPO: clip ratio r to [1-eps, 1+eps]; surrogate min(r*A, clip(r)*A)
# DPO: preference loss on log pi(y_w) - log pi(y_l) vs reference (see TRL / papers)
Full Example: patterns/learning-adaptation/example.py
Pattern 37: Exception Handling and Recovery
Category: Agentic Reliability
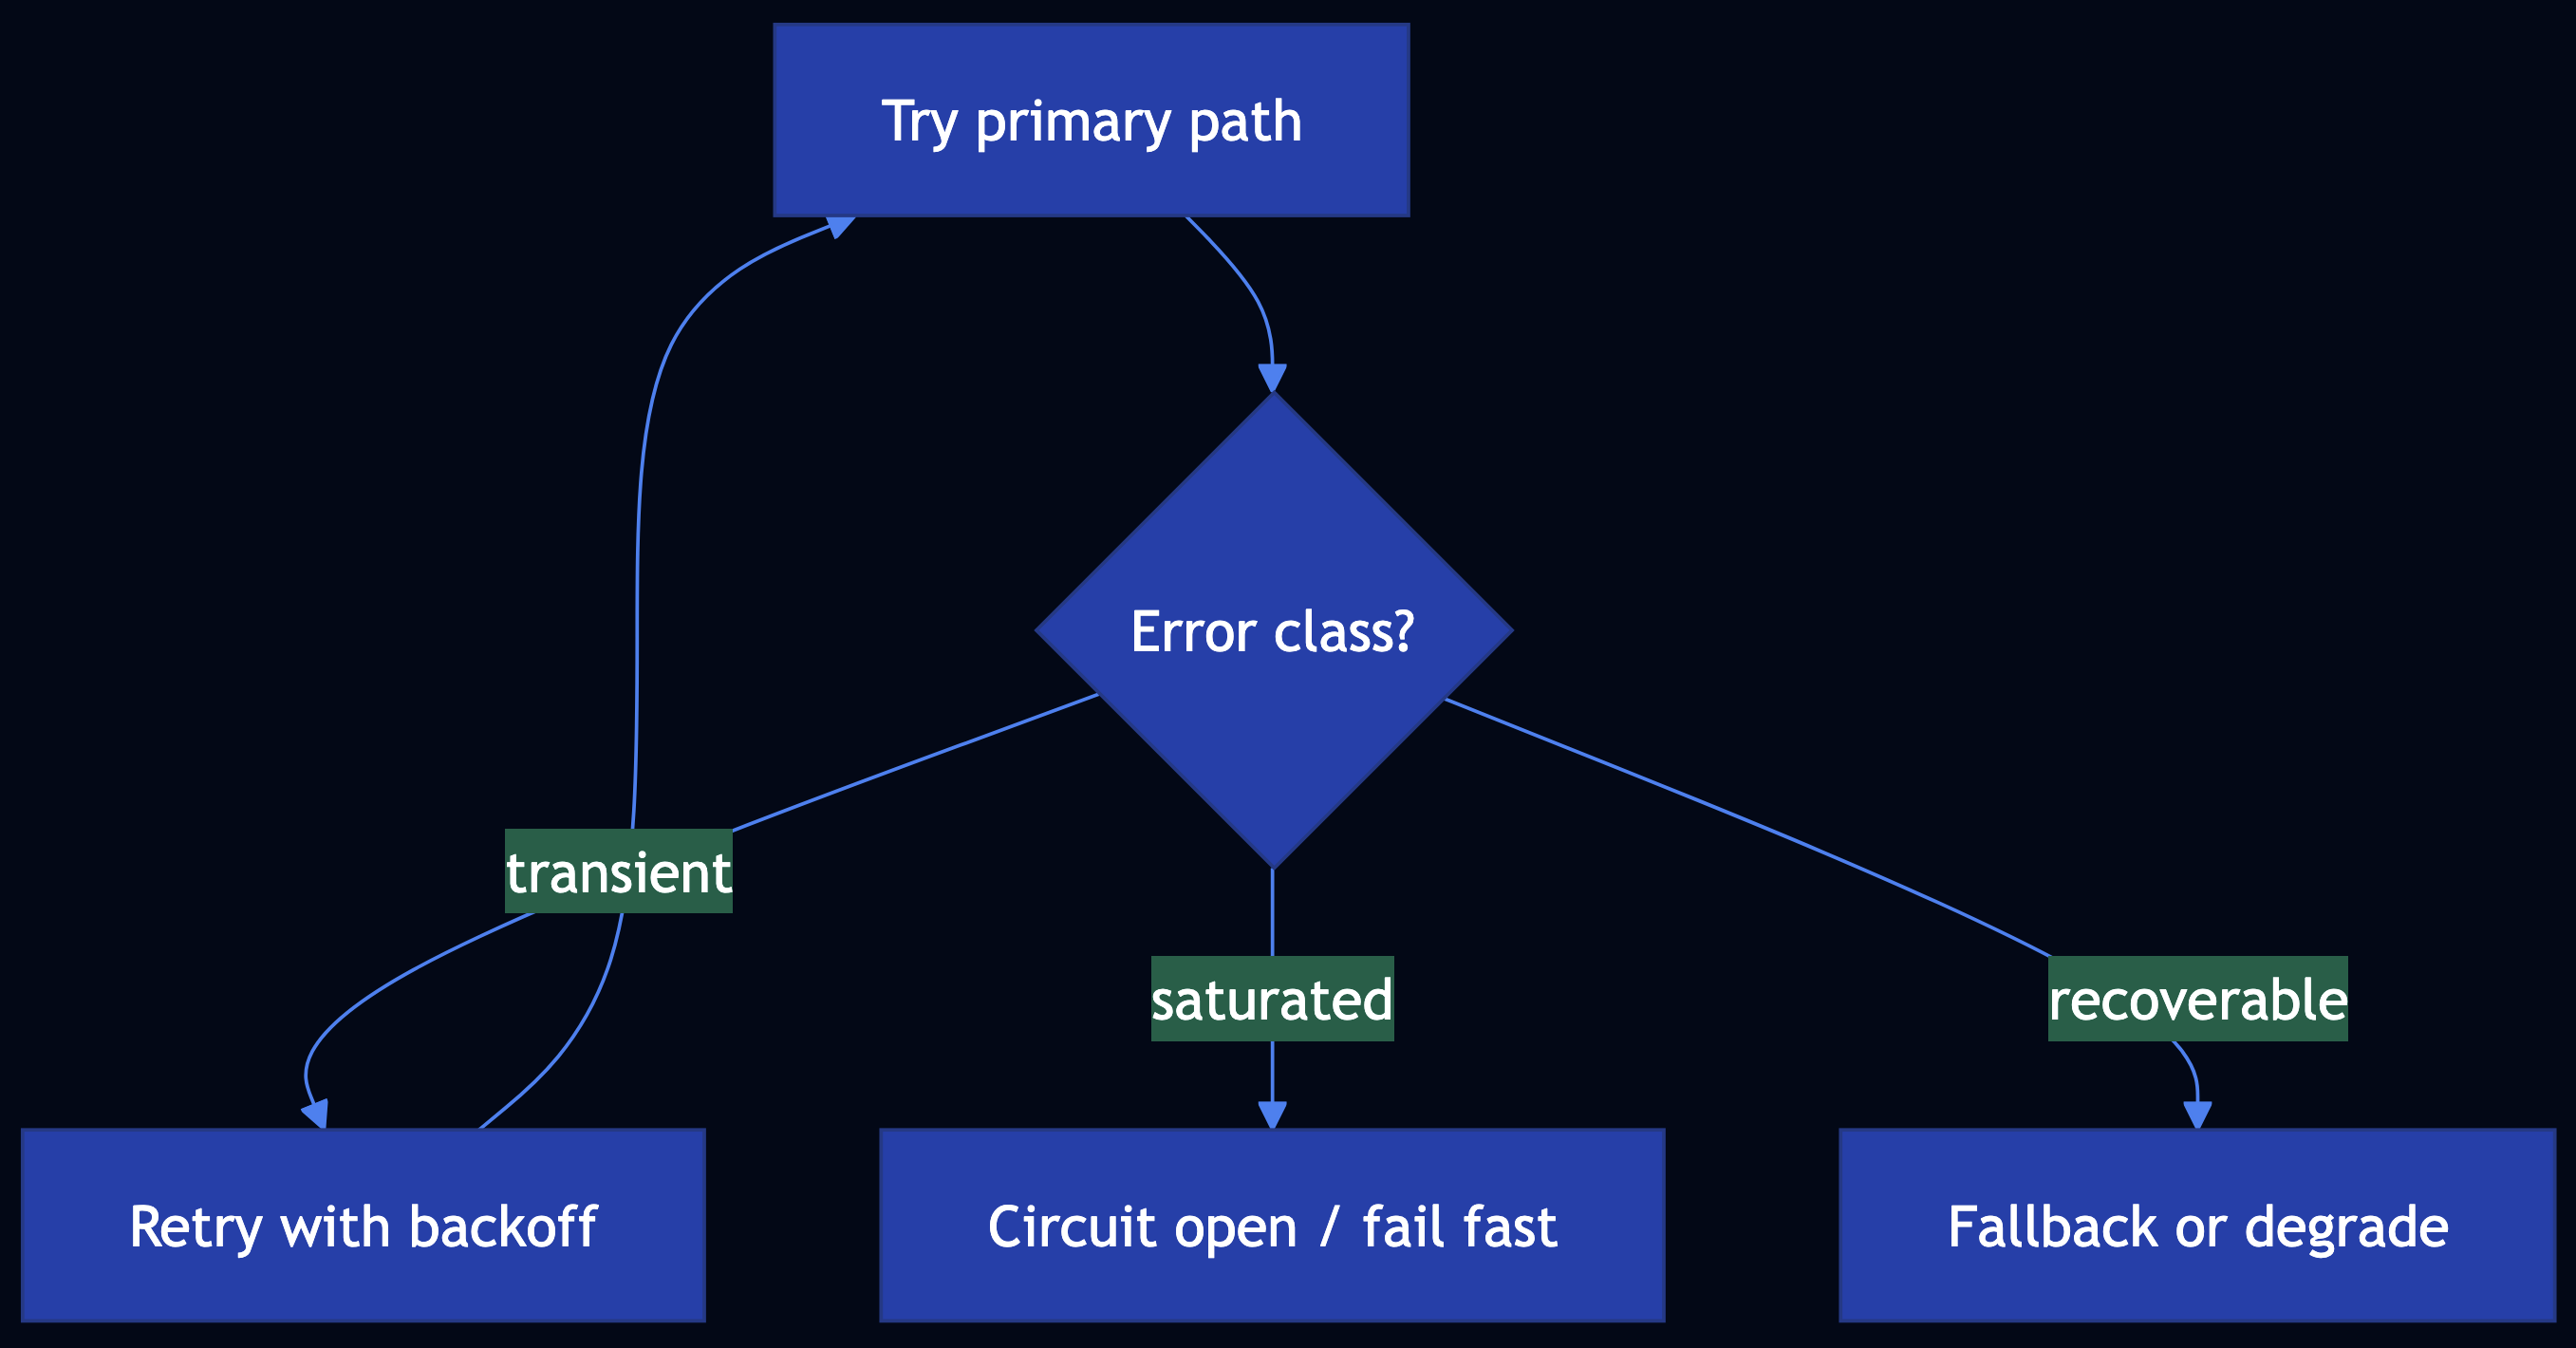
Use When: Agents, chains, and tools must survive failures by detecting and classifying errors, and retrying wisely and fallback to degraded paths
Solution
- Detect — Structured errors, validation, guardrails, timeouts
- Classify — Transient vs permanent vs policy
- Handle — Exponential backoff, circuit breaker, fallback model or cache
- Recover — Idempotent retries, compensation, checkpoint resume
def run_with_fallback(
    primary: Callable[[], T],
    fallback: Callable[[], T],
    is_recoverable: Callable[[BaseException], bool],
) -> T:
    """
    Try ``primary``; on a recoverable exception, invoke ``fallback``.

    Args:
        primary: Preferred code path (e.g. frontier model).
        fallback: Degraded path (e.g. smaller model or cached stub).
        is_recoverable: Whether to use fallback for this exception type.

    Returns:
        Result from primary or fallback.

    Raises:
        Re-raises if the primary fails with a non-recoverable error.
    """
    try:
        return primary()
    except Exception as exc:
        if not is_recoverable(exc):
            raise
        return fallback()
Full Example: patterns/exception-handling-recovery/example.py
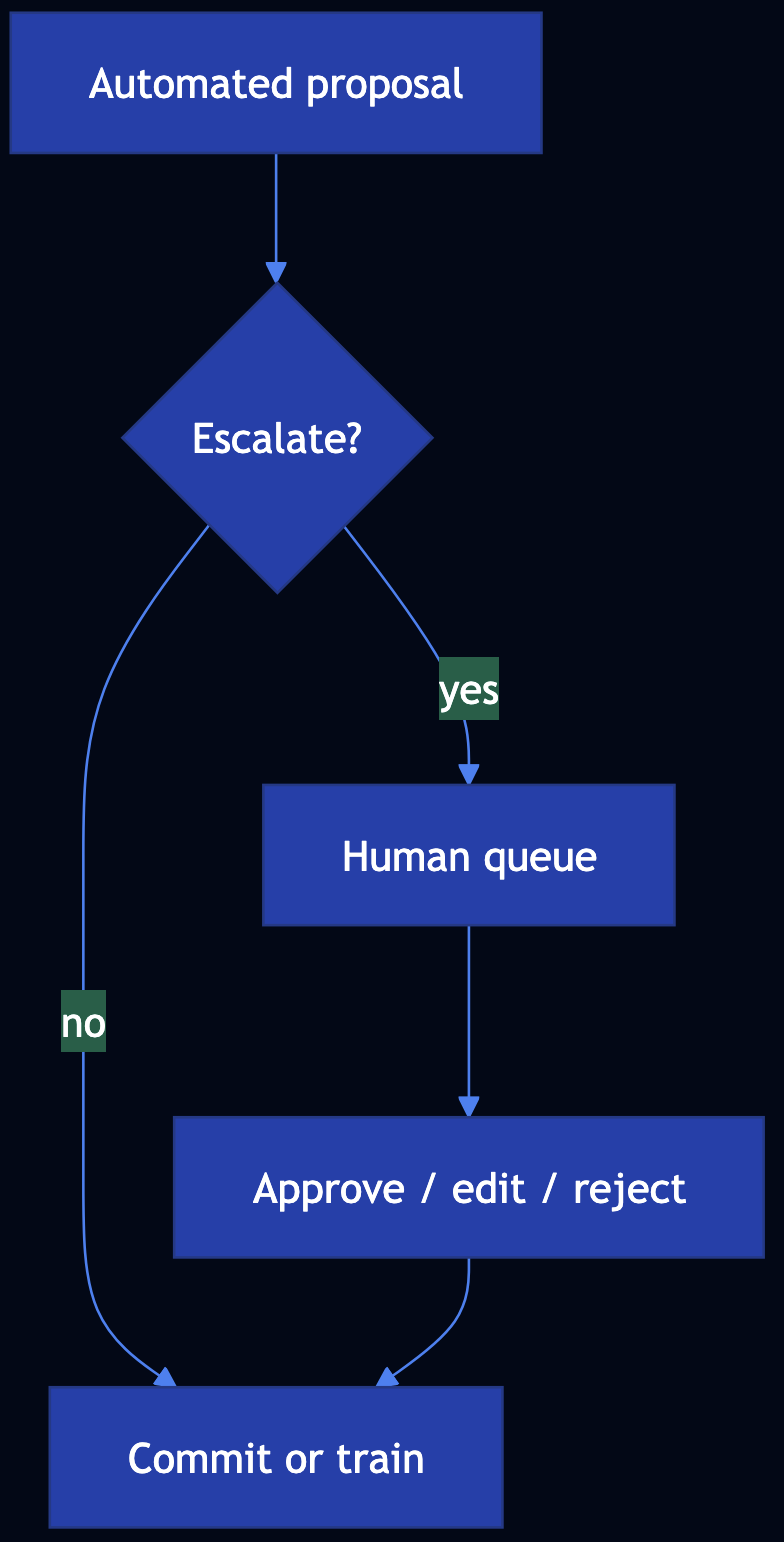
Pattern 38: Human-in-the-Loop (HITL)
Category: Agentic Safety
Use When: Automation must yield to people for quality, compliance, or risk
Solution
- Triggers — Low confidence, high stakes, novel situations, regulatory rules, sampling
- Review — Queues, rubrics, SLAs, multi-level approval
- Feedback — Labels and edits ? datasets, policies, routing
- Orchestration — LangGraph interrupt / human nodes; workflow engines with wait states
Code Snippet
# if stakes == HIGH or conf < tau: enqueue(HumanReviewTicket)
# LangGraph: interrupt_before=[human_node]; resume with Command
Full Example: patterns/human-in-the-loop/example.py
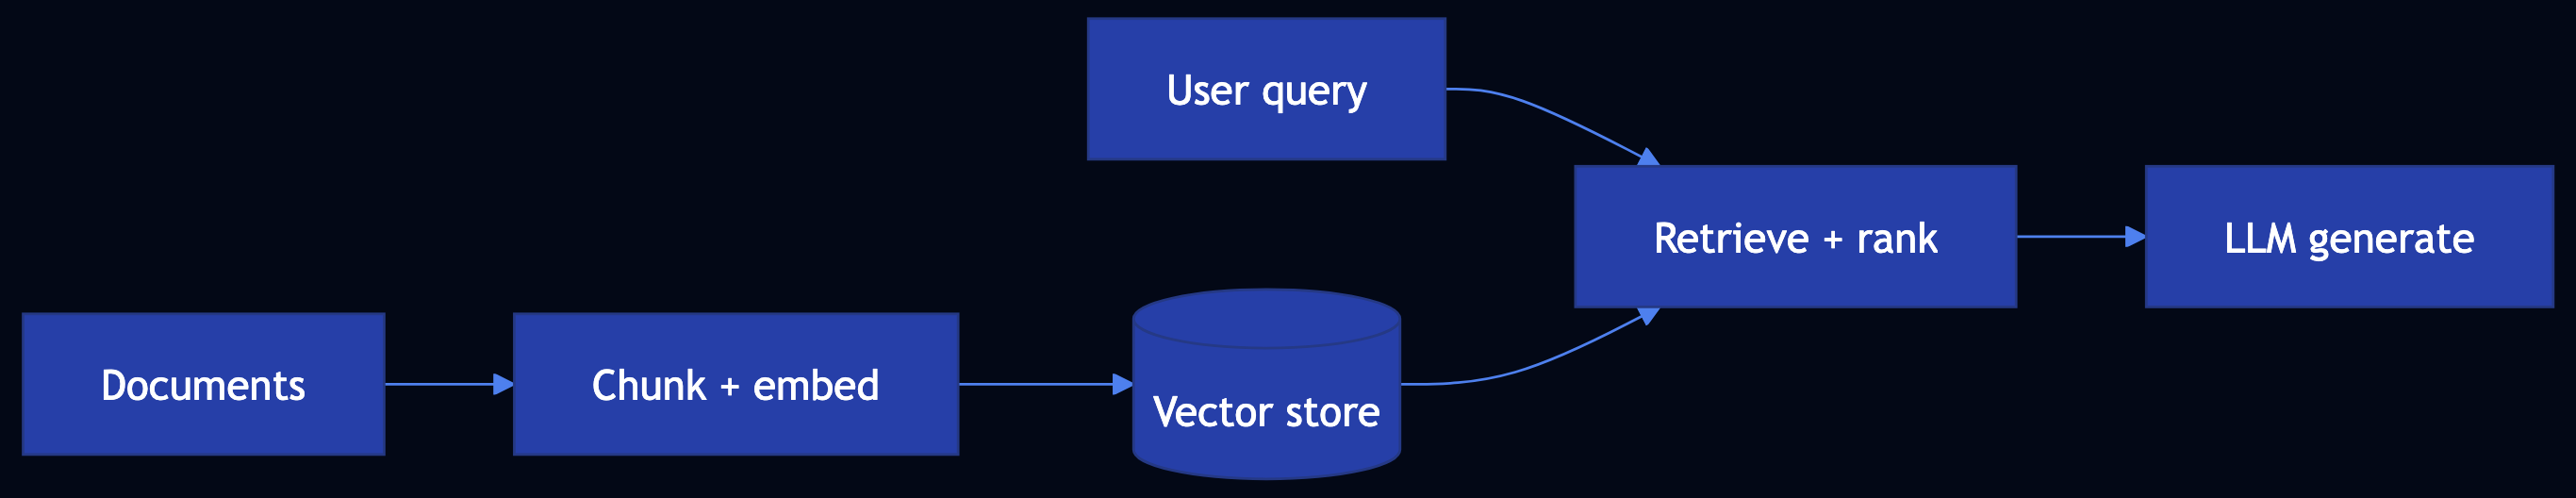
Pattern 39: Agentic RAG (Knowledge Retrieval)
Category: Agentic Knowledge
Use When: You need up-to-date, source-grounded answers with embeddings, semantic search, chunking, vector stores, and advanced variants
Solution
- Chunk ? embed ? vector DB; measure relevance via cosine / distance metrics
- Hybrid retrieval (dense + sparse) where lexical match matters
- Graph RAG for entity-centric queries; agentic RAG for query rewrite, tool retrieval, multi-hop
- LangChain LCEL / LangGraph for pipelines and cycles
Code Snippet
# LCEL: RunnablePassthrough.assign(context=retriever) | prompt | llm
# LangGraph: retrieve -> grade_documents -> [rewrite_query | generate]
Full Example: patterns/agentic-rag/example.py
See also Patterns 6–12 for depth implementations of each RAG component.
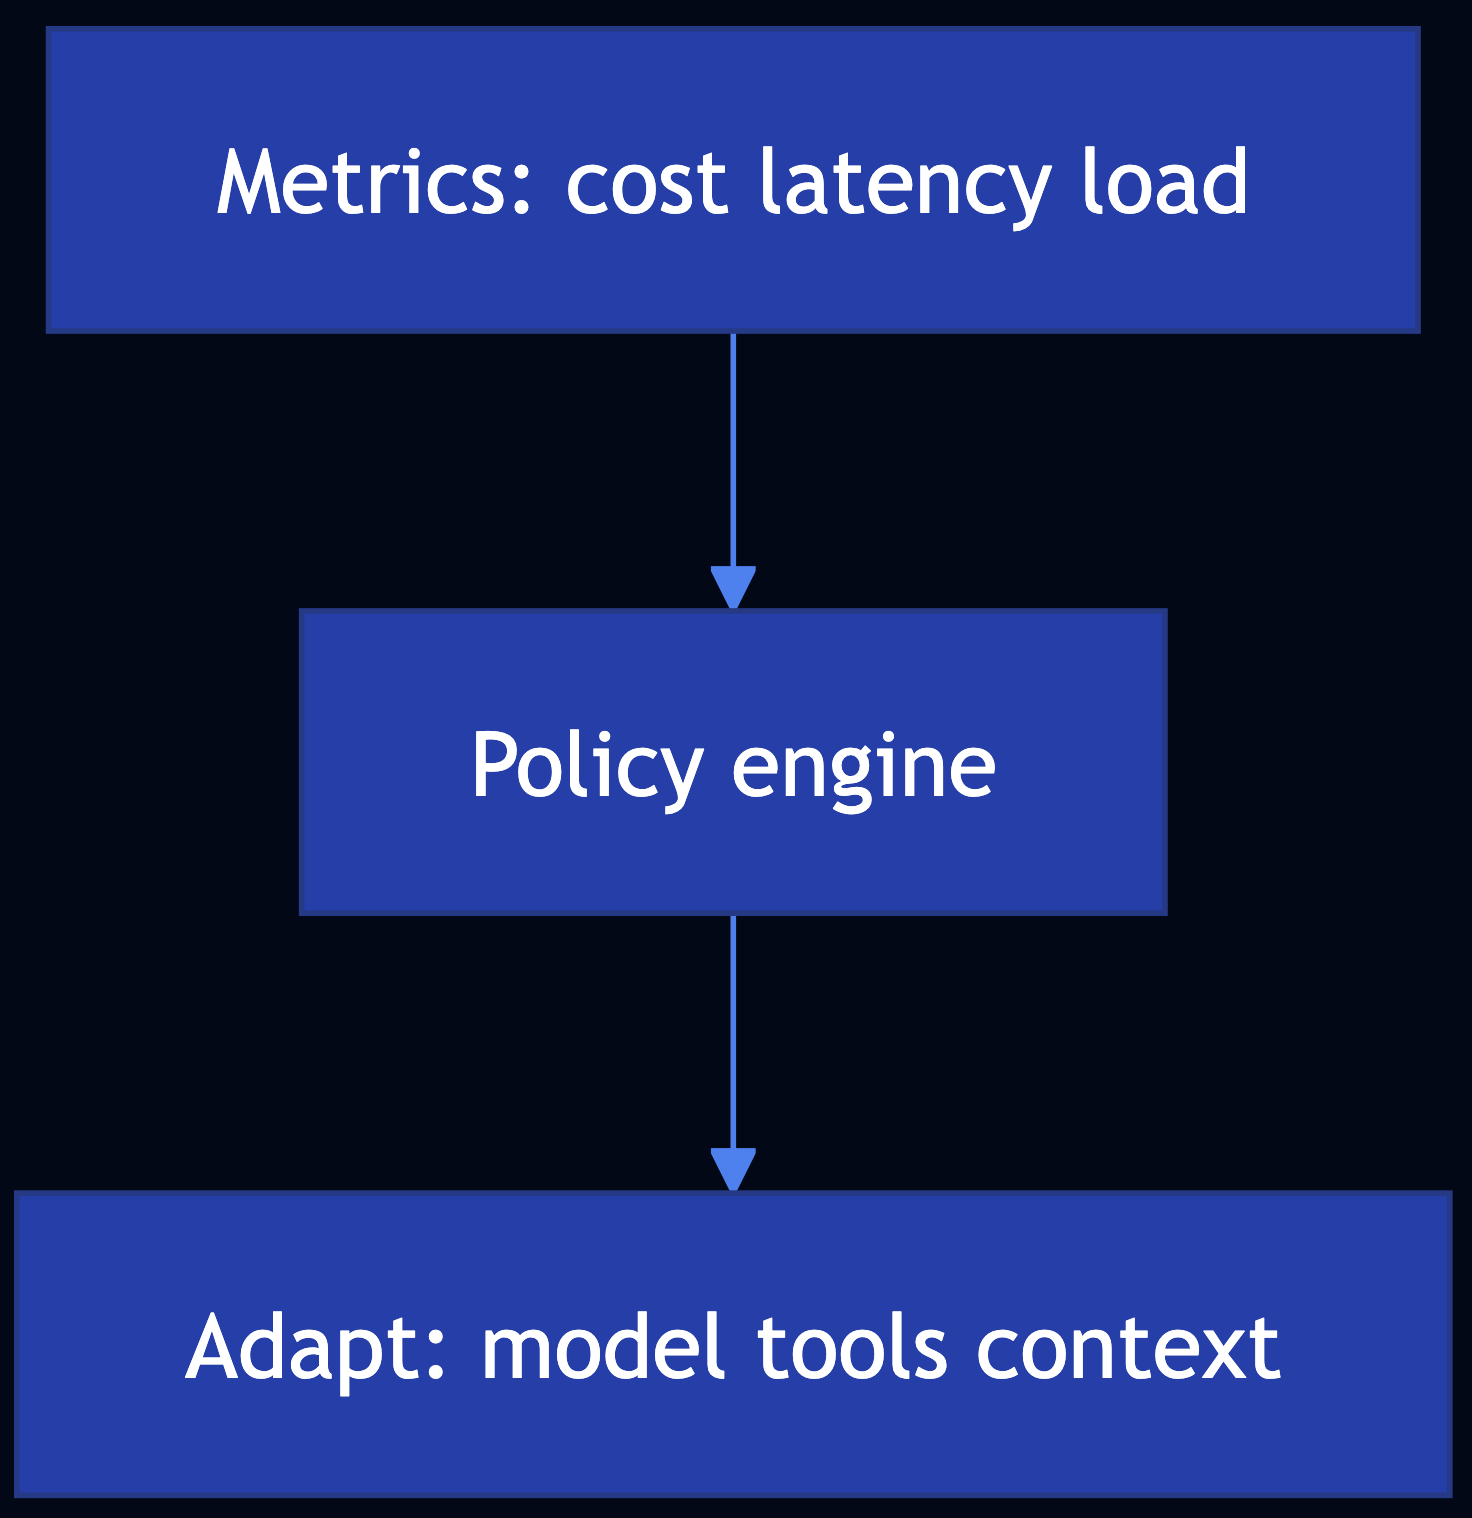
Pattern 40: Resource-Aware Optimization
Category: Agentic Efficiency
Use When: You must optimize LLM and agent workloads for cost, latency, capacity, and graceful degradation
Solution
- Budgets and tiered models — Estimate $ per request
- Route by priority and load (Pattern 34)
- Prune / summarize context; cache (25); smaller models (24)
- Degrade — Fewer tools, shorter answers, async handoff
Code Snippet
# if budget.remaining() < need: summarize(history) or tier = "small"
# if degradation == MINIMAL: tool_gate.disable_heavy_tools()
Full Example: patterns/resource-aware-optimization/example.py
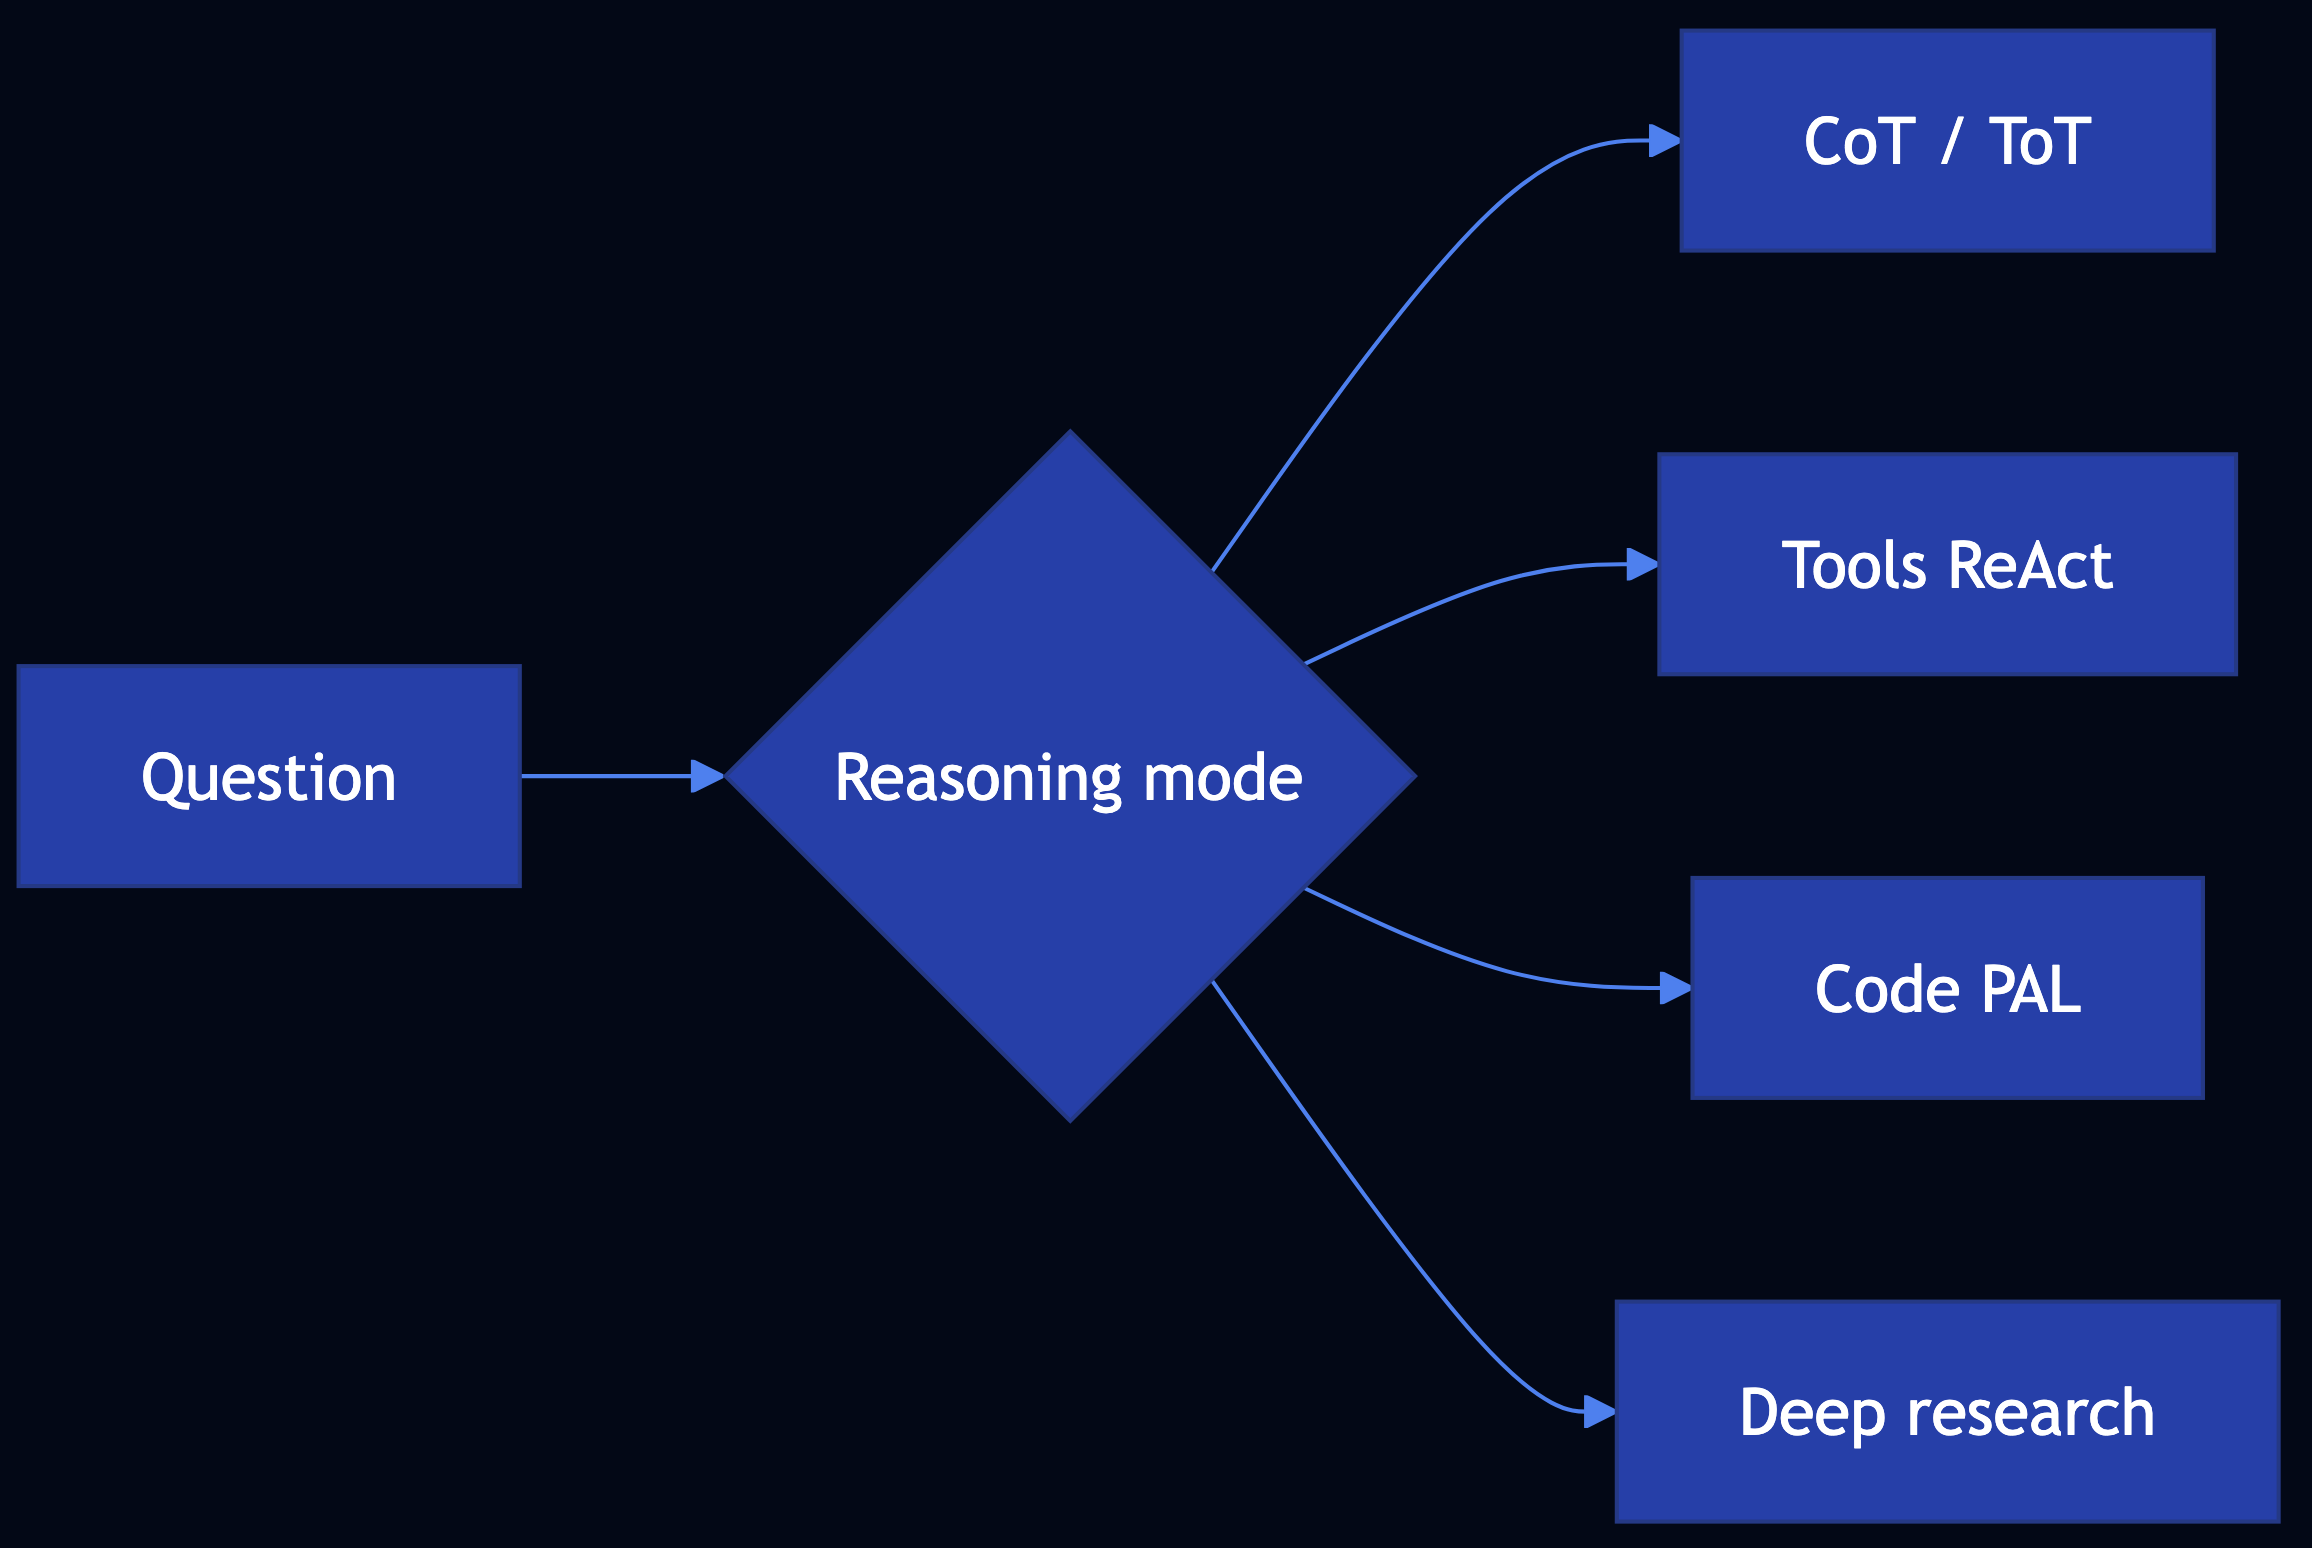
Pattern 41: Reasoning Techniques (Agentic)
Category: Agentic Reasoning
Use When: You need a structured approach to complex Q&A using CoT, ToT, self-correction, PAL / code-aided reasoning, ReAct, RLVR, debates (CoD), deep research
Solution
Use the technique map in patterns/reasoning-techniques/README.md: CoT (13), ToT (14), Reflection (18), Deep Search (12), ReAct / tools (21), PAL-style code (22), multi-agent debates (23), prompt / workflow optimization (20).
def language_agent_tree_search_stub(
    frontier: list[str],
    expand_fn: Callable[[str], list[str]],
    score_fn: Callable[[str], float],
    beam_width: int = 2,
) -> list[tuple[str, float]]:
    """
    Minimal beam-style selection (stand-in for Language Agent Tree Search).

    LATS in the literature expands **language** states/actions, scores children
    with a value model or LLM critic, and prunes—unlike a flat ToT breadth list.

    Args:
        frontier: Current candidate partial solutions or thoughts.
        expand_fn: Callable taking one candidate, returning child strings.
        score_fn: Callable taking a string, returning higher-is-better score.
        beam_width: Max states to keep after scoring.

    Returns:
        Top ``beam_width`` (candidate, score) pairs.
    """
    children: list[tuple[str, float]] = []
    for node in frontier:
        for ch in expand_fn(node):
            children.append((ch, float(score_fn(ch))))
    children.sort(key=lambda x: x[1], reverse=True)
    return children[:beam_width]
Full Example: patterns/reasoning-techniques/example.py
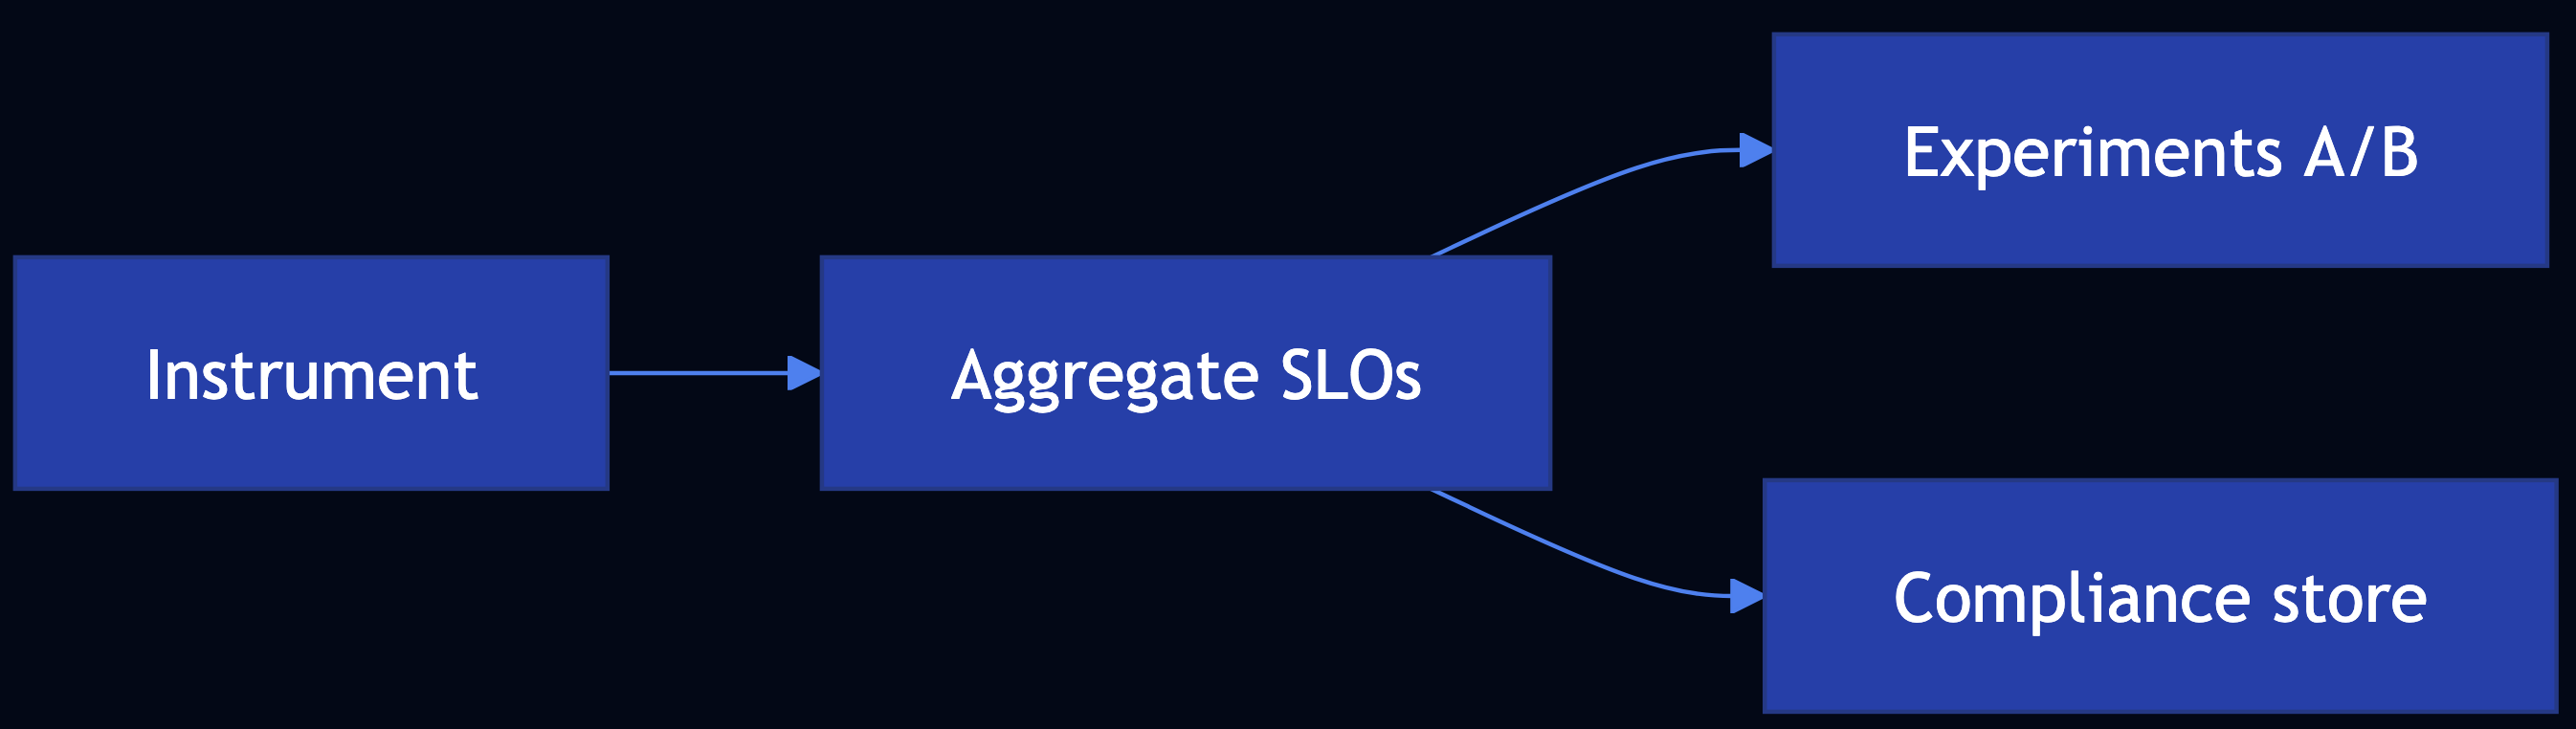
Pattern 42: Evaluation and Monitoring (Agentic)
Category: Agentic Observability
Use When: You need performance tracking, A/B tests, compliance evidence, latency SLOs, token/cost telemetry, custom quality metrics (LLM-as-judge), and multi-agent traces
Solution
Instrument calls, aggregate SLAs, run experiments with guardrail metrics, store audit evidence, trace multi-agent workflows.
Code Snippet
# trace_id + span per LLM/tool; tokens += pt+ct; export to OTLP
# ab_variant(user_key, "exp", ("a","b")); compare judge_score & p95_latency
Full Example: patterns/evaluation-monitoring/example.py
Pattern 43: Prioritization
Category: Agentic Scheduling
Use When: Competing tasks must be ordered to support queues, cloud jobs, trading paths, security incidents using multi-criteria scores, dynamic re-ranking, and resource-aware scheduling
Solution
Weighted dimensions (urgency, impact, effort, SLA, security), recompute on events, integrate with routing (34) and capacity (40).

Code Snippet
# score = w1*urgency + w2*importance - w3*effort + w4*f(sla) + w5*security
Full Example: patterns/prioritization/example.py
Pattern 44: Memory Management
Category: Agentic State
Use When: Agents need short-term context, long-term persistence, episodic retrieval, procedural playbooks, and privacy-aware storage
Solution
Tier memory (working, episodic, procedural, semantic); extract and retrieve selectively; persist orchestrator state with MemorySaver.
Code Snippet
# LangGraph: compile(..., checkpointer=MemorySaver()); thread_id in config
# External: memory.search(query, user_id=...) for semantic / episodic layers
Full Example: patterns/memory-management/example.py
Pattern 45: Planning and Task Decomposition
Category: Agentic Orchestration
Use When: You need explicit task graphs, dependencies, and valid execution order
Decompose goals into a DAG of subtasks with dependencies. The planner agent determines which tasks to run in parallel vs. sequentially based on dependency analysis.
Full Example: patterns/planning-task-decomposition/example.py
Pattern 46: Goal Setting and Monitoring
Category: Agentic Governance
Use When: SMART goals, progress vs. targets, deviation detection, strategy updates
The goal-monitor agent tracks metrics against defined targets, detects when progress deviates from expected trajectories, and adjusts strategy when needed.
Full Example: patterns/goal-setting-monitoring/example.py
Pattern 47: MCP Integration (Agentic)
Category: Tooling / Integration
Use When: Model Context Protocol servers — discovery, tools/list, tools/call — secure composition with Pattern 21
Model Context Protocol (MCP) provides a standardized interface between agents and external resources. Agents discover available tools at runtime through the protocol, call them with structured inputs, and receive structured outputs.
Full Example: patterns/mcp-integration/example.py
Pattern 48: Inter-Agent Communication
Category: Distributed Agents
Use When: Message envelopes, routing, correlation, capability discovery (A2A-style) with Pattern 23
Agent-to-Agent (A2A) communication defines structured message schemas and communication protocols for inter-agent coordination. Agents send typed messages (task assignments, results, status updates, requests for clarification) through a message bus or shared workspace.
Full Example: patterns/inter-agent-communication/example.py
Pattern 49: Safety Guardian
Category: Safety / Compliance
Use When: Multi-layer defense, risk thresholds, shutdown paths beyond single guardrail scanners (extends Pattern 32)
The safety guardian agent implements three-tier protection: pre-action guardrails (evaluate the proposed action before execution), in-process monitoring (enforce scope and resource constraints during execution), and post-action auditing. Includes prompt injection detection for agents that process external content.
Full Example: patterns/safety-guardian/example.py
Pattern 50: Exploration and Discovery
Category: Search / Learning
Use When: Explore vs. exploit, novel environments, hypothesis cycles (pairs with Patterns 12, 14, 41, 36)
Implements a multi-armed bandit or curiosity-driven strategy that balances exploitation (using known-good approaches) with exploration (trying new approaches to discover if they’re better). Scores update from outcomes, so the agent continuously refines its strategy distribution.
Full Example: patterns/exploration-discovery/example.py
Pattern Comparison Matrix
| # | Pattern | Complexity | Training Required | Best For |
|---|---|---|---|---|
| 1 | Logits Masking | Medium | No | Valid JSON, banned words |
| 2 | Grammar Constrained Generation | High | No | API configs, schemas |
| 3 | Style Transfer | Low–Medium | Optional | Notes to emails |
| 4 | Reverse Neutralization | High | Yes | Your writing style |
| 5 | Content Optimization | High | Yes | Open rates, conversions |
| 6 | Basic RAG | Medium | No | Documentation, knowledge bases |
| 7 | Semantic Indexing | High | No | Technical docs, multimedia, tables |
| 8 | Indexing at Scale | High | No | Healthcare guidelines, policies |
| 9 | Index-Aware Retrieval | High | No | Technical docs, API docs |
| 10 | Node Postprocessing | High | No | Legal docs, medical records |
| 11 | Trustworthy Generation | High | No | Medical Q&A, legal research |
| 12 | Deep Search | High | No | Market research, due diligence |
| 13 | Chain of Thought | Low–Medium | No | Policy eligibility, math, compliance |
| 14 | Tree of Thoughts | High | No | Root-cause analysis, design exploration |
| 15 | Adapter Tuning | Medium–High | Yes (adapter only) | Intent routing, content moderation |
| 16 | Evol-Instruct | High | Yes (SFT/LoRA) | Policy Q&A, compliance playbooks |
| 17 | LLM as Judge | Low–Medium | No | Support quality, model evaluation |
| 18 | Reflection | Medium | No | Drafts, code, plans |
| 19 | Dependency Injection | Low–Medium | No | Fast deterministic tests with mocks |
| 20 | Prompt Optimization | Medium–High | No | Summarization, copy, classification |
| 21 | Tool Calling | Medium–High | No | APIs, live data, actions (ReAct) |
| 22 | Code Execution | Medium–High | No | Diagrams, plots, SQL |
| 23 | Multi-Agent Collaboration | High | No | Vendor review, incidents, research crews |
| 24 | Small Language Model | Medium–High | Optional | Cost, VRAM, throughput |
| 25 | Prompt Caching | Low–Medium | No | Repeated prompts, long prefixes |
| 26 | Inference Optimization | Medium–High | No | Self-hosted throughput, KV memory |
| 27 | Degradation Testing | Medium–High | No | TTFT, EERL, tok/s, RPS; LLMPerf |
| 28 | Long-Term Memory | Medium–High | No | Stateful assistants, personalization |
| 29 | Template Generation | Low–Medium | No | Transactional email/SMS |
| 30 | Assembled Reformat | Medium–High | No | PDPs with hazmat/battery risk |
| 31 | Self-Check | Medium | No | Logprobs, perplexity, uncertainty triage |
| 32 | Guardrails | Medium–High | No | Security, moderation, PII |
| 33 | Prompt Chaining | Low–Medium | No | Sequential workflows, structured handoffs |
| 34 | Routing | Low–High | Optional | Intent ? handler, tools, subgraph |
| 35 | Parallelization | Low–Medium | No | Research, analytics, multimodal |
| 36 | Learning and Adaptation | High | Yes | RL, preferences, online drift |
| 37 | Exception Handling & Recovery | Low–High | No | Agent tools, chains, APIs |
| 38 | Human-in-the-Loop (HITL) | Low–High | No | Moderation, fraud, trading, safety |
| 39 | Agentic RAG | Medium–High | No | Fresh knowledge, multi-hop retrieval |
| 40 | Resource-Aware Optimization | Medium–High | No | Cost/latency budgets, degradation |
| 41 | Reasoning Techniques | Low–Very High | Varies | CoT, ToT, ReAct, PAL, debates |
| 42 | Evaluation and Monitoring | Medium–High | No | LLM-judge metrics, multi-agent spans |
| 43 | Prioritization | Low–High | No | Support, cloud jobs, trading, security |
| 44 | Memory Management | Medium–High | No | LangGraph threads, episodic retrieval |
| 45 | Planning & Task Decomposition | Medium–High | No | DAG tasks, dependencies |
| 46 | Goal Setting & Monitoring | Medium | No | SMART goals, deviation detection |
| 47 | MCP Integration | Medium | No | Tool servers, discovery |
| 48 | Inter-Agent Communication | Medium–High | No | Messages, routing, A2A |
| 49 | Safety Guardian | High | No | Layered safety, shutdown paths |
| 50 | Exploration & Discovery | Medium | No | Explore/exploit, novel domains |
Choosing the Right Pattern
| If you need… | Use… |
|---|---|
| Enforce constraints during generation | Pattern 1: Logits Masking |
| Formal grammar compliance | Pattern 2: Grammar Constrained Generation |
| Transform content style quickly | Pattern 3: Style Transfer (Few-Shot) |
| Consistent personal style | Pattern 4: Reverse Neutralization |
| Optimize for performance metrics | Pattern 5: Content Optimization |
| External knowledge augmentation | Pattern 6: Basic RAG |
| Semantic search or complex content | Pattern 7: Semantic Indexing |
| Large-scale, evolving knowledge with freshness | Pattern 8: Indexing at Scale |
| Handle vocabulary mismatches | Pattern 9: Index-Aware Retrieval |
| Ambiguous entities, conflicting or verbose chunks | Pattern 10: Node Postprocessing |
| Prevent hallucination and build user trust | Pattern 11: Trustworthy Generation |
| Comprehensive research with multi-hop reasoning | Pattern 12: Deep Search |
| Multistep reasoning or auditable reasoning trace | Pattern 13: Chain of Thought |
| Explore multiple strategies or hypotheses | Pattern 14: Tree of Thoughts |
| Specialize a foundation model with small labeled dataset (100s–1000s pairs) | Pattern 15: Adapter Tuning |
| Teach a model new tasks from private data | Pattern 16: Evol-Instruct |
| Scalable, nuanced evaluation with scores and justifications | Pattern 17: LLM as Judge |
| Self-correction in stateless APIs without user follow-up | Pattern 18: Reflection |
| Develop and test GenAI pipelines without flaky LLM calls | Pattern 19: Dependency Injection |
| Find good prompts, re-run when model changes | Pattern 20: Prompt Optimization |
| Call APIs, live systems, or tools (not only RAG) | Pattern 21: Tool Calling |
| Diagrams, plots, or queries as DSL executed in sandbox | Pattern 22: Code Execution |
| Multiple specialized roles, decomposition, parallel work | Pattern 23: Multi-Agent Collaboration |
| Run on smaller GPUs, cut cost, speed up decoding | Pattern 24: Small Language Model |
| Avoid recomputing repeated or paraphrased prompts | Pattern 25: Prompt Caching |
| Higher throughput and lower KV pressure on self-hosted LLMs | Pattern 26: Inference Optimization |
| Load tests with LLM-native metrics (TTFT, EERL, tok/s, RPS) | Pattern 27: Degradation Testing |
| Durable user context beyond raw chat history | Pattern 28: Long-Term Memory |
| On-brand, reviewable customer email/SMS | Pattern 29: Template Generation |
| Product pages where wrong specs are unacceptable | Pattern 30: Assembled Reformat |
| Flag uncertain generations using token probabilities | Pattern 31: Self-Check |
| Policy enforcement (PII, banned topics, moderation) | Pattern 32: Guardrails |
| Reliable multi-step workflows with structured handoffs | Pattern 33: Prompt Chaining |
| Pick the right tool, model, or specialist path | Pattern 34: Routing |
| Run independent tasks concurrently, then merge | Pattern 35: Parallelization |
| Improve from rewards, preferences, or streaming feedback | Pattern 36: Learning and Adaptation |
| Agents and chains that survive tool/API failures | Pattern 37: Exception Handling & Recovery |
| People in the loop for high-stakes decisions | Pattern 38: HITL |
| Gulli-level RAG with agentic retrieval loops | Pattern 39: Agentic RAG |
| Cost/latency-aware agents with graceful degradation | Pattern 40: Resource-Aware Optimization |
| Map of reasoning methods tied to implementations | Pattern 41: Reasoning Techniques |
| Production observability: latency, tokens, A/B tests | Pattern 42: Evaluation and Monitoring |
| Rank competing tasks or incidents | Pattern 43: Prioritization |
| LangGraph-style memory tiers + checkpointing | Pattern 44: Memory Management |
| Explicit task DAGs and dependency order | Pattern 45: Planning & Task Decomposition |
| SMART goals and deviation from targets | Pattern 46: Goal Setting & Monitoring |
| MCP tool servers with discovery and secure calls | Pattern 47: MCP Integration |
| Agent message fabric / A2A-style coordination | Pattern 48: Inter-Agent Communication |
| Layered safety beyond I/O scanners | Pattern 49: Safety Guardian |
| Explore vs. exploit in open-ended search | Pattern 50: Exploration & Discovery |
Takeaways
Here are major takeaways from these agentic patterns:
Enforce constraints early. Logits Masking and Grammar Constrained Generation prevent bad output at the token level. The same logic applies to Guardrails: put them in the runtime layer, not in the system prompt.
RAG is a stack you build layer by layer. Start with Basic RAG. When vocabulary gaps break retrieval, add Semantic Indexing. When contradictions surface, add Indexing at Scale. When queries don’t match chunks, add Index-Aware Retrieval. When retrieved chunks are noisy, add Node Postprocessing. Each pattern fixes the failure mode of the one before.
Structure the reasoning. Chain of Thought, Tree of Thoughts, and ReAct all treat reasoning as something to engineer. Adding “think step by step” costs one line and measurably improves multi-step accuracy. Tree of Thoughts costs more but handles problems where a single reasoning path gets stuck.
You need less data than you think for specialization. Adapter Tuning and Evol-Instruct both produce strong task-specific models from hundreds of examples, not millions. Evolving seed questions into harder variants and filtering by quality gives you a curriculum worth training on. The bottleneck is usually data quality, not quantity.
The operational patterns matter as much as the modeling ones. Prompt Caching, Inference Optimization, and Degradation Testing don’t appear in research papers. They’re the difference between a working demo and a system that holds up under real traffic.
I have added examples for all 50 patterns at: github.com/bhatti/agentic-patterns
Run the setup in ten minutes with SETUP.md, then explore whichever patterns are most relevant to what you’re building.
Technology Stack
- Ollama — Local model serving
- LangChain — LLM orchestration
- CrewAI — Multi-agent systems
- LangGraph — Stateful agent workflows
- HuggingFace — Model hub and transformers
- PyTorch — Direct model access and logits manipulation